The Party Swamp

June 30, 2024

by Stephen Stofka

This week’s letter is on expectations and alliances. After separating voters into two parties, alliances within each of the parties coalesce to form intra-party squabbles. These alliances can form despite radically different approaches to managing problems: analytical and instinctual. Voting for the same candidate might be a person with an instinctive dislike of government and a business owner who estimates the impact of that candidate’s policy preferences on a company’s bottom line. These two different approaches also produce conflict.

In past weeks I have distinguished between expectations and anticipations, the first being more analytical and the second more imaginative or instinctual. The two work symbiotically in our individual lives but that symbiosis becomes outright conflict in a group. Some prefer a more analytical approach to discussing and solving problems while others rely on their gut, their moral compass. Individuals participating in that debate want to convince others to adopt their perspective and values. Perspective evolves over our adult lifetime and its purpose is to protect our values which have evolved since childhood. Attacking a person’s perspective can be perceived as an attack on their values, so we are resistant to persuasion. A variation of a 17th century quote goes, “A man convinced against his will is of the same opinion still.” The trick to persuasion is to insert your argument into another person’s perspective like a key and let them turn the key.  

In the Democrat Party, the center left contends with the radical left who weaponize shame. Advocates of DEI funding and mandates within all public institutions honestly believe that such training will moderate or eliminate racist attitudes. The majority of U.S. colleges and universities require students to take these non-credit classes to graduate. For students with a heavy academic schedule and work commitments, the burden of that mandate multiplies a student’s stress. Those within and without the academic community debate the conflict between these mandates and academic freedom.

Those favoring more spending on affordable housing disagree with voters in the party who prefer the personal space buffer that R-1 Single Family Home zoning gives residents. Proponents of free needle exchange must overcome fears that such tolerance will introduce a moral hazard that promotes more rather than less drug use. Supporters of more resources for  immigrant housing, job and medical services encounter principled opposition from those who are mindful of the resources and money that must be diverted from other programs. Should the needs of newcomers take higher priority than those of long- time residents, particularly the descendants of those African-Americans brought to this country centuries ago? Party leaders struggle to manage these ideological conflicts because these issues permeate the leadership ranks as well.

The Republican Party is more dominant in the ex-urban and rural parts of each state. Party leaders and candidates express strong support for religious faith as a cornerstone of American society. According  to Pew Research, Republicans attend church more often than Democrats or Independents but the majority of Republican voters do not attend church weekly. Like Democrats and Independents, a third of Republicans rarely step inside of a church. Those who believe that public institutions should be secular confront those who think religious principles and doctrine offer the only sound foundation to good governance. A person supporting their argument with Bible verses may truly believe that they are taking an analytical approach. In their belief framework, the Bible is history, recorded by various authors or sources but inspired by God himself. To those devotees, the Bible is fact, not an arbitrary assembling of oral traditions and myths. Two Republican voters, each with very different religious beliefs, practices and priorities still vote for the same candidates and issues. Leaders within the party must negotiate a compromise between Christian compassion and checkbook constraints.

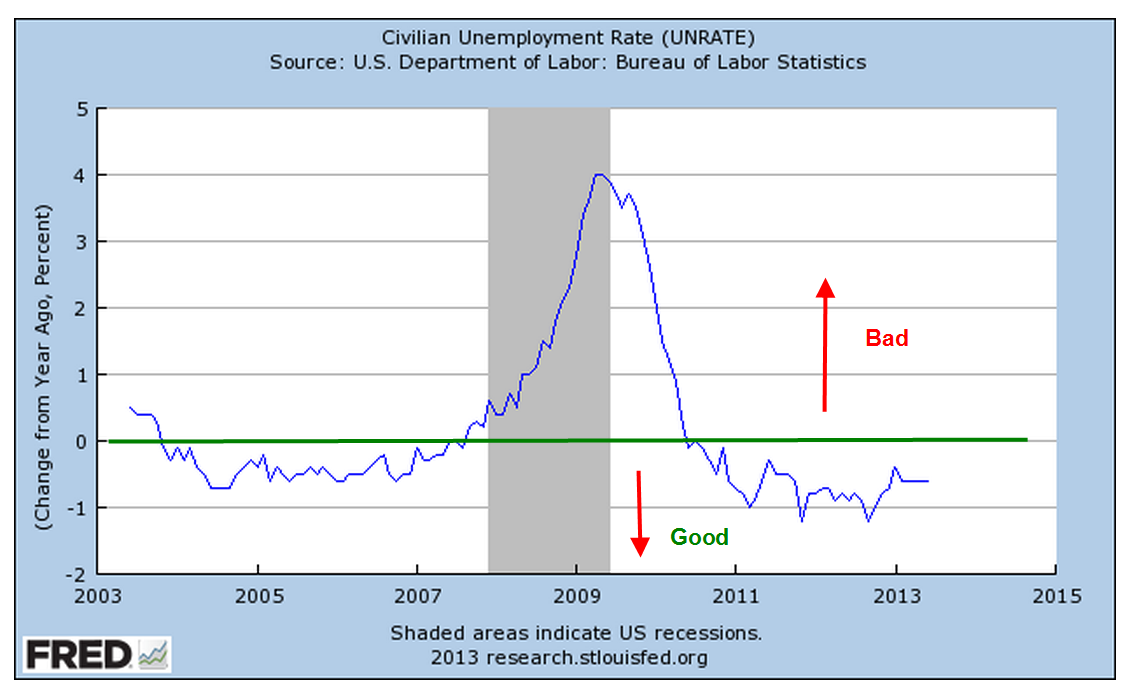
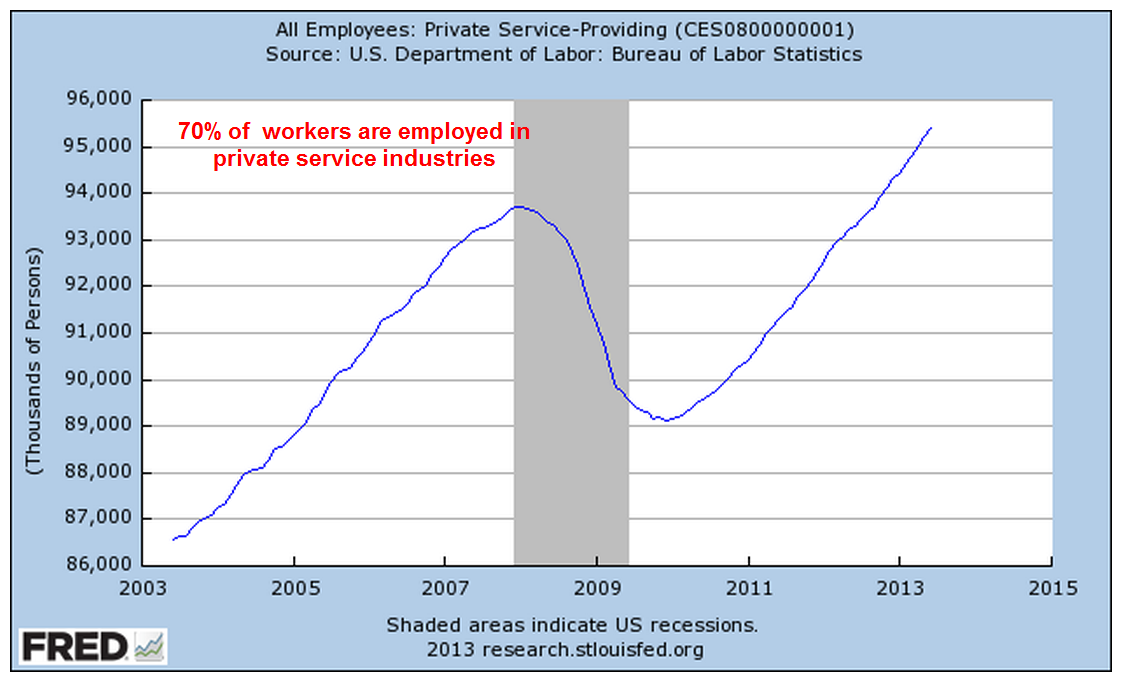
Immigration is a key issue on ideological lines even though most immigrants initially settle down in urban areas where political sentiments skew Democratic. When the labor market is strong in the U.S. relative to other countries, that acts as a draw to legal and illegal immigration. The emphasis is on the “relative to other countries” part. A mismatch in labor market demand between the U.S. and neighboring countries is an important contributor to immigration flows. The strong economy in the late 1990s and early 2000s attracted a surge of immigrants, far more than today’s levels when adjusted for population.

 A recent analysis by the Federal Reserve estimated that restrictive immigration policies from 2017 to 2020 made it moderately more difficult for employers to fill job vacancies.  Farmers and ranchers, a strong Republican cohort, have long lobbied for changes to the H-2A “guest worker” program that would help them meet seasonal worker demand. The number of slots for foreign workers is not enough to meet demand and the application process is burdensome. Employers have similar complaints about the H-2B program for non-agricultural workers, and are heavily used by janitorial and landscaping services. Regardless of the impact of restrictive immigration policies on their businesses, owners may still vote for a candidate who promotes an immigration crackdown.

Jobs and sustainable wages are the cornerstones of family support, individual self-respect and autonomy. Those in rural areas are keenly aware that urban areas offer a more developed communications and transportation network that attracts companies, jobs and talent. For the past several decades, small to medium-sized manufacturing has migrated to foreign markets which offer lower labor costs. The influx of immigrants is yet another potential threat to community stability and resources. Long established immigrants who came to the U.S. through a legal process may not feel welcoming to those who have jumped ahead in the immigration line.   For decades, rural areas have fought to retain businesses and develop more jobs at a sustainable wage. Those who advocate more government spending on infrastructure to attract businesses clash with those having an ideological preference for laissez-faire markets.

Candidates within each party search for and exploit the shifting alliances within their party’s voters. Challenges to incumbents emerge not from the other party but from a primary election by a candidate in their own party. Primary elections attract only a small percent of party faithful whose political passion gives their small numbers a lot of leverage within the party. Fringe candidates with less funding can appeal to special interest groups to further an agenda with a dedicated party base. A candidate can appeal to a single-issue like abortion, immigration, or project a no-nonsense, get-tough persona and attack an incumbent who compromised on a piece of legislation. A Representative must learn to manage different sets of alliances: those in their district and state, and those in Washington. Next week, I will look at several Representatives and how they have navigated relationships of political power within their party.

////////////////////////////

Photo by Ryan Noeker on Unsplash

Life Choices

September 19, 2021

by Steve Stofka

Economics is built on the principle of the rational person capable of making a choice between two options. In casual conversation we use the word “rational” to mean making sense but in economics it means making a choice. The choices presented may have constraints that make the word “choice” seem inappropriate. Does an addict have a choice? Yes. Sometimes we steer our lives with a critical choice of more or no more, having to choose between an unbearable more and a no more that contains an equally unbearable number of unknowns.

We might leave a job with only the hope that we can find another one soon. We may cast a no more vote, rejecting an incumbent for an unknown candidate. People living in the path of a hurricane or forest fire must make the difficult choice of evacuating the area or staying in their home and hoping they will be safe. Making a no more choice with family relationships can twist a person’s mind and soul in knots. A battered women may endure more until they reach the point of no more and leave their situation.  

As the Delta variant of Covid-19 sweeps through the population, many people are making difficult life choices about their jobs. In March 2020, the number of job openings plunged more than a third from 7 million to 4.6 million. In January this year, openings regained their pre-Covid levels and have risen quickly since then. The July report indicated almost 11 million openings, a series record.

After adjusting to online work, some workers have made that a critical preference. They have said no more to long commutes. Some have moved from dense urban areas to less populated states like Montana where rents or house prices will not consume half a paycheck. They have said no more. The sudden job loss last year caused some workers to rethink their priorities and career choice. The lack of affordable childcare has been a deciding factor for some workers.  

In economics, utility theory explores a choice between quantities of two goods. For example, will I have more pizza or more ice cream? These simple unrealistic examples help a student practice the concepts but are not suitable for no more life choices. Because these decisions act like switches, their calculations are hard to model. We may be able to bargain with our company who wants workers back in the office. Many times, we have to make a hard choice, one that can’t be undone.

We may revisit difficult choices, trying to understand and refine our decision making process. Many younger workers will look back and see this as a defining moment in their life. Some will wonder what if, replaying their choice. In a period of five years, our grandparents and great-grandparents endured rationing during WW1, followed by the Spanish flu that killed thousands, then the severe recession of 1921. Life narrowed their choices and they endured. By the time a person reaches their 80s, they have decided on more about 30,000 days. We remember the no more decisions more than we remember the many decisions of more. Each day is a crossroad.

/////////////

Photo by Einar Storsul on Unsplash

Competition

July 11, 2021

by Steve Stofka

This week President Biden issued an executive order (White House, 2021) to counter the trend toward corporate consolidation and oligarchy that has arisen during the past decades. I appreciated that the report contained links to the outside data sources they are using. After almost six months in office, Mr. Biden has signed 51 orders, almost half of them rescinding the orders of former President Trump (National Archives, 2021). In 2017, Mr. Trump signed 55 orders total but only eight of those were rescinding orders. The pace of orders slows after the first several months in office. I’ll review some highlights from this order.

For the past decade inflation has been below the Fed’s 2% target but the trend toward consolidation in some key industries gives those few companies that dominate an industry greater pricing power. Modern Farmer reported that 80% of the meatpacking industry is controlled by just four companies (Nosowitz, 2020). In 2000, the top 20 home builders controlled 15% of the market. Today it is 30%. Mr. Biden’s order notes that mark-ups, the charges over a company’s cost, have tripled in recent years. Since 2010, Federal Reserve data (2021) shows that after-tax profits have increased almost 50%, substantiating the claim of higher markups. In the past decade, low interest and rising profits have fueled a tripling of the stock market.

For the ten years following 9-11, after-tax profits also tripled, despite the worst financial crisis since the Great Depression in the 1930s. Many financial companies lined up at the corporate soup kitchen in Congress and were bailed out. Homeowners and workers went hungry while Congress paid bonuses to the same speculators that sparked the crisis (Story & Dash, 2009). Sorry, folks, we had to honor the contracts, the politicians in Washington said. It’s the law. Who helped write the laws? The corporations that got bailed out.

The order notes the growing increase of non-compete agreements for new job hires, making it more difficult to move to a more attractive job. It references data from the Economics Innovation Group (EIG, 2021) that the rate of new business formation has sunk by half in the past fifty years. The shift of manufacturing to China has also contributed to the overall decline.

The report notes the upswell in occupational licensing requirements over the past several decades. Licensing appears to be about public safety and some of it is. The states have come to depend on the revenue from the licensing fees and it avoids having to raise some taxes on voters. Trade schools that certify beauticians and other occupations like the tuition revenue they receive. Established business like licensing because it keeps out competition. The benefits are widespread and the costs are concentrated to those seeking careers in those occupations, many of them blue collar and little political power.

There are many faults in our federalist system that an executive order cannot remedy because the Constitution gives a lot of power to the states. What it can do is bring more attention to these anti-competitive practices. New Zealand and Singapore top the World Bank’s list of countries with low obstacles to doing business. The U.S. is sixth, just behind S. Korea and a few places ahead of Norway.

Americans believe in American exceptionalism but the Nordic countries keep beating us in various international categories. People say “You Americans. You should be more like the Nordic countries!” Suck on it, Norway, Finland and Sweden. We are ahead of you in ease of doing business. Next year we’re going to take on S. Korea and after that, tiny Denmark. There is nobody more capitalism loving than America and we’re going to prove it by stopping some of these anti-competitive practices!

/////////////////

Photo by Pietro Mattia on Unsplash

EIG. (2020, June 29). Dynamism in retreat. Retrieved July 11, 2021, from https://eig.org/dynamism

Federal Reserve. (2021, June 24). Corporate profits after TAX (without IVA And ccadj). Retrieved July 11, 2021, from https://fred.stlouisfed.org/series/CP.

National Archives. (2021). Federal Register: Executive orders. Retrieved July 11, 2021, from https://www.federalregister.gov/presidential-documents/executive-orders/joe-biden/2021

Nosowitz, D. (2020, June 09). DOJ reportedly Subpoenas ‘Big Four’ Meatpackers. Retrieved July 11, 2021, from https://modernfarmer.com/2020/06/doj-reportedly-subpoenas-big-four-meatpackers/

Story, L., & Dash, E. (2009, July 30). Bankers reaped lavish bonuses during bailouts. Retrieved July 11, 2021, from https://www.nytimes.com/2009/07/31/business/31pay.html

Van Dam, A. (2019, October 19). Increasingly, economists find, homebuilding in fewer hands. Retrieved July 11, 2021, from https://www.providencejournal.com/news/20191019/increasingly-economists-find-homebuilding-in-fewer-hands

White House. (2021, July 09). FACT sheet: Executive order on promoting competition in the American economy. Retrieved July 11, 2021, from https://www.whitehouse.gov/briefing-room/statements-releases/2021/07/09/fact-sheet-executive-order-on-promoting-competition-in-the-american-economy/

When Data Disappoints

May 9, 2021

by Steve Stofka

The April labor report released this week was far below expectations. Economists expected an addition of one million jobs; the reported job increase was 266,000. Some analysts and politicians attributed the lower-than-expected job gains to generous unemployment benefits that dissuade job applicants from seeking employment. For centuries, the upper class have believed that the working class is inherently lazy, that people only work out of necessity. It is an implicit assumption of mainstream economics which is founded on the disutility of labor.

When asked to comment on the influence of “plussed up” unemployment benefits at a press conference on Friday, Treasury Secretary Janet Yellen raised a data point that contradicted that concern. States with the most generous unemployment benefits have the highest job-finding rates (White House, 2021). We would expect the opposite.

Ms. Yellen cited other factors with far greater importance. Topmost was the lack of childcare. 4.2 million women dropped out of the workforce in April 2020. Two million still have not returned. The two childcare facilities near my home in Denver are still closed.

A second factor was a mismatch of skills. Many entertainment venues are still closed. These typically employ younger workers under 25 with a modest skill set. They man ticket booths and concession stands at movie theaters. They take orders at restaurants cook food and bus tables. They stock and sort food items on our grocery shelves. Many have childcare needs, which are not being met. For these younger workers and their families, a modest wage that barely covers childcare expenses is not an attractive option.

The crunch in the construction industry has been an ongoing development for more than a decade. I spoke to a dental assistant this week, a man in his 20s. During the financial crisis, many parents with blue collar skills lost their jobs. Parents with some college education or a degree didn’t. Many kids compared their circumstances with others at school and were attracted to white collar jobs as being more permanent, even if they didn’t pay as much. This younger generation, dubbed Gen Z, experienced the disruptions to their homelife brought on by the financial crisis. Now they are experiencing another severe crisis as adults. Will they spend most of their lives seeking stability?

Economists and policymakers argue: are employers not offering a high enough wage? Are the unemployed unwilling to lower their wage expectations? The economic euphemism is “sticky prices” – that prices are slow to change to evolving circumstances. A more accurate term would be sticky contracts. Both employers and job applicants have existing arrangements – leases, childcare needs, school district preferences, mortgages, rents – at prices that are resistant to change.

The heartening aspect of this debate is that we are discussing these issues. The prior administration would call a disappointing labor report “fake news.” They would have cast doubt on the intentions of government officials who compiled the data as a conspiracy against the former President. A smart 8-year-old could tell a more convincing lie. After four years, it’s refreshing to have an adult public conversation.

/////////////////

Photo by Christina @ wocintechchat.com on Unsplash

White House. (2021, May 08). Press briefing by press SECRETARY Jen Psaki and Secretary of the Treasury Janet Yellen, May 7, 2021. Retrieved May 09, 2021, from https://www.whitehouse.gov/briefing-room/press-briefings/2021/05/07/press-briefing-by-press-secretary-jen-psaki-and-secretary-of-the-treasury-janet-yellen-may-7-2021/

An Explosion of Events

October 4, 2020

by Steve Stofka

This has been a week of surprises. Sunday night, the NY Times released the details of President Trump’s tax documents which he has sought to keep hidden under the pretense that an IRS audit prevents him from doing so. We learned that Mr. Trump’s wealth is a ruse, like that of Bernie Madoff. We discovered the reason for the IRS audit: a $72 million refund that Mr. Trump was paid in 2009 under a dubious interpretation of rules in the Recovery Act following the 2008 financial crisis.

The report contains many instances of rule bending if not outright fraud. It serves as an example of why Republicans have repeatedly cut funding for the IRS. With fewer people, the IRS is unable to monitor the shenanigans of Mr. Trump and his accountants.

The last two decades have seen the largest accounting scandals, and most of them happened while Republicans controlled the majority if not all of the federal government. Enron, Tyco and Health South in the early 2000s were just the prelude to the 2008 financial crisis. The Enron scandal exposed the misdeeds of one of the largest accounting firms in the world, Arthur Anderson, who was forced to surrender their license in 2002. During these past twenty years, Republicans have consistently fought to undermine the mission of all government monitoring, to bend the rules in favor of large industry. Mr. Trump called us working stiffs suckers for paying taxes.

On Tuesday’s debate between both Presidential candidates, Mr. Trump’s interruptions broke debate protocol and the rules he had agreed to. That’s not a surprise. He is a notorious cheater at golf and has a motor mouth. He is an entertainer, not a statesman or a gentleman. The surprise was that Mr. Biden met the verbal assault without fluster. Afflicted with stuttering since he was a child, Mr. Biden has learned to speak with deliberation, a common strategy taught to stutterers. Kids around the country, watch Mr. Biden. This is how you stand up to bullies.

The announcement late Thursday night that Mr. Trump had tested positive for Covid surprised those of us who wondered how the disease had not caught up to the President, who has played the tough guy and pooh-poohed caution. Mr. Trump has several comorbidities, his physician said, without being specific. A lack of prudence might be one of them. Several hours later, Mr. Trump was taken to Walter Reed hospital out of “an abundance of caution.” With a month left before the election, Mr. Trump had a busy election schedule, which is up in the air for the next two weeks, at least. More on that at the end of this post.

The surprise in Friday’s monthly hiring report was the weak job recovery. The employment population ratio is 56.6%, significantly down from 61% in February, before Covid. In February, 1.5 people working supported each person not working, including children. Now it is 1.3 people supporting each person not working.

The growing debt of the Federal government has relieved some of the burden on workers, because, in times of crisis, the rest of the world wants to buy U.S. Treasuries. State and local governments are squeezed. Governments laid off 216,000 workers in September. Who will they turn to except the Federal government? Senate Republican Leader Mitch McConnell balks at aid to the states, particularly the “blue” states.

In the past weeks, airlines and other industries have been announcing permanent layoffs. Older people may be taking early retirement. The four industries that have not suffered during this crisis are utilities, consumer staples, technology and health care. The effect of tech on the stock market has been dramatic. The SP500, weighted by market cap, is up 7% since January. An evenly weighted SP500 index is down 17%. That reflects a general economic misery.  

The week was still not done. On Saturday, we learned that the President had known earlier that he had Covid. He met with prominent Republicans and did not tell them he had the disease. Former NJ governor and campaign advisor Chris Christie has now tested positive for the disease. Mr. Christie is younger but is obese, the chief co-morbidity leading to death. Kellyanne Conway, Mr. Trump’s White House advisor, has also tested positive. The White House is doing a trace of all people who came into contact with Mr. Trump. He hates his enemies, but he doesn’t spare his friends either.

//////////////

Photo by Jens Johnsson on Unsplash

Bridge the Gap?

Photo by Ragnar Vorel on Unsplash

September 6, 2020

by Steve Stofka

What issues are your priorities this election? For more than thirty years Pew Research has surveyed people about their priorities. For the first time in 2019 a majority of 765 respondents answered that there is a “great deal” of difference in where each party stands, up from 25% in 1987 (Pew Research, 2020). I’ve included the full list at the end.

In January 2019, soon after the midterm elections Pew surveyed 1500 adults (Jones, 2020). I don’t know why the abortion/free choice debate is not on the issue list since that single issue may decide some voters. I’m particularly interested in the large gaps in those priorities among those who lean Democrat or Republican. I’ll start with gaps of 25%. For instance, terrorism is a concern for 80% of Republicans but only 55% of Democrats. Other Republican priorities are Immigration, the Military and Crime.

As you can see, these are fear issues. Should a person in a town of 2000 be more concerned about terrorism than a resident of NYC? Of course not, but it is what it is. People vote out of fear and hope, but fear probably wins the wrestling match, especially among Republican voters who are not hopey, changey voters, as former VP candidate Sarah Palin noted (Gonyea, 2010).

The issue of crime illustrates the conflicting complexities of these issues. It is a 60% priority for Republicans, who are in suburban and rural areas where there is less crime, and a 40% priority for Democrats, who are in dense urban areas where there is a higher incidence of crime. Because crime is much lower than in past decades, this issue has slipped as a priority for Democrats (FBI, n.d.).  

Two of the highest Democrat priorites – Cimate Change and the Environment – have a huge gap of 50% with Republican voters. Democrat politicians have not been able to make these two fear issues personal for Republicans. If they could, they would draw more voters to their side on this issue. 25% gaps exist on issues of the Poor and Needy, Health Care, Education and Race Relations. Rural Republican voters are more likely to be poor and needy, but this is not a fear issue for them (USDA, n.d.).

What strategy would a politician or political consultant advise? Run toward the base? If so, one would emphasize these issues where there are large gaps between the two primary factions in this country. The President has largely adopted this strategy. Republican voters are more inclined to fall in line and the President is relying on this party loyalty even if they don’t like him personally.

Some issues where there is a smaller gap between factions are the economy, the budget deficit, jobs, global trade, drug addiction, transportation, Social Security and Medicare.

A politician reaching out to voters on the fence in this election would focus on these issues. Joe Biden hits the jobs theme, the budget deficit, and protecting Social Security and Medicare to appeal to voters who have had their fill of the President’s divisiveness.

In the coming two months, candidates may adjust their strategies. In the 2016 election, Hillary Clinton may not have addressed these shared concerns as well and it cost her the election.  Governing comes after winning an election. In politics, winning is packaging the concerns and identities of voters into an appealing, if not attractive, box that will get them to come out and vote.

What are your priorities this election season? Are you a multi-issue voter, a single issue voter, a party voter regardless of the issues? Here’s the Pew survey list of 18 issues: terrorism, immigration, military, crime, climate change, environment, poor and needy, race relations, health care, education, economy, Social Security, Medicare, jobs, drug addiction, transportation, global trade, and the budget deficit.

///////////////

Notes:

FBI. (n.d.). Crime rates in the United States, 2008 – 2018. Retrieved September 05, 2020, from https://crime-data-explorer.fr.cloud.gov/explorer/national/united-states/crime

Gonyea, D. (2010, February 07). ‘How’s That Hopey, Changey Stuff?’ Palin Asks. Retrieved September 05, 2020, from https://www.npr.org/templates/story/story.php?storyId=123462728

Jones, B. (2020, August 26). Republicans and Democrats have grown further apart on what the nation’s top priorities should be. Retrieved September 05, 2020, from https://www.pewresearch.org/fact-tank/2019/02/05/republicans-and-democrats-have-grown-further-apart-on-what-the-nations-top-priorities-should-be/

Pew Research Center. (2020, August 21). Public’s 2019 Priorities: Economy, Health Care, Education and Security All Near Top of List. Retrieved September 05, 2020, from https://www.pewresearch.org/politics/2019/01/24/publics-2019-priorities-economy-health-care-education-and-security-all-near-top-of-list/

U.S.D.A. (n.d.). Rural Poverty & Well-Being. Retrieved September 05, 2020, from https://www.ers.usda.gov/topics/rural-economy-population/rural-poverty-well-being/

Job Trends

July 7th, 2013
A better than expected June labor report released this week prompted some speculation that the Federal Reserve may begin tapering its quantitative easing program as early as this fall.  The employer survey reported a net gain of 195,000 jobs and the gains of earlier months were revised up 70,000.  Government workers continue to decline. We will see that the modest strength in the labor market is part of a mixed employment picture.    The unemployment rate remained steady at 7.6%; the year over year percent change in this headline index continues to chug along in the “good” territory.

70% of workers – about 95 million – are employed in private service jobs, most of which showed strong gains in the past quarter.

14% of workers are government employees; federal, local and state governments continue to shed workers.

As the number of workers declines, the number of people served by each worker continues to rise, approaching levels last seen in the early 1980s and mid-1970s.  The government work force would need to decline a further two million, or 10%, to reach the level of 15 people per government worker.  That level is still far below the comparatively lean government worker levels of the 1960s and earlier.

The major part of the attrition in government jobs seems to be over.  Local governments are adding employees while the federal government continues to shed employees.

Job gains continue to come in lower paying retail and food service jobs.  In 2013, employment finally surpassed early 2008 levels.  The average wage of $14 to $17 per hour in these industries is far below the $24 average of all workers and the $20 average of private production and non-supervisory workers.

Much higher paying jobs in Professional and Business Service industries continued to show strong gains and have also climbed above 2008 levels.  The average wage in this category is 15% higher than that of all workers.

Over seven million people not counted in the labor force or in the headline unemployment rate say they want a job now.  Four years after the official end of the recession, the number of “kind of unemployed” remains high.

The number of involuntary part-time workers increased by 322,000, or about 4%, to 8.2 million, over 5% of the total labor force.  These are workers who are working part time but want full time jobs.  A healthier labor market would have about 3% of these unwilling part timers.

As the number of housing starts increases, the unemployment rate among construction workers continues to decline and dipped below 10% this month.  Lower lows in this unseasonally adjusted index of unemployment is a good sign.

But the year-over-year percent change in construction employment is still not robust enough to reverse the heavy job losses since the onset of the recession.

The core work force aged 25 – 54 dropped by 100,000 and continues its slight upward struggle above the recession depths.

A decline in this prime working age population is partly responsible, but the 1.6 million decline in population is but a third of the 5 million plus decline in employment for this age group.

A 2004 paper by a BLS economist, Jessica Sincavage, provides an interesting historical perspective on multi-decade generational trends in the unemployment rate.  She noted “The characteristics of today’s younger workers differ from those of their baby-boomer counterparts in several ways that may affect the former group’s impact on the labor force and the unemployment rate now and in the future. Among the relevant characteristics affecting both groups are school enrollment patterns, race and Hispanic origin, and women’s labor force participation.”

In 1979, over 42% of the last of the boomer generation aged 20 – 24 were enrolled in school.  In 2002, under 37% of the “echo boomer” generation aged 20 -24 were enrolled.  Easy job availability, the growth of the internet and the sustained rise of the stock market during the 1990s persuaded many younger workers that the opportunity cost of going to college was simply not worth it.

The onset of this recession has divided the prime work force into two groups.  For those with a degree unemployment has remained low.  For those without the higher education, unemployment is almost double.  In a curious correlation, the unemployment rate for three groups is about the same – the general labor force,  workers above 25 years with a high school only education, and Hispanics.

The third factor noted by Ms. Sincavage is the participation rate of women in the labor force. In her 2004 paper she observed “In 1979, the participation rate of women 16 to 34 years was about 63 percent; by 1999, it was 70 percent.” By the mid 2000s, this cultural and demographic bulge began to decline.  The rate for all women has now declined below the levels of the early 1990s.

Although there was a lot to like about this month’s labor report, recent job gains are swimming against an undertow of shifting demographics and labor demands from employers.  A casual reading of the headline numbers might lead one to discount these long term negative trends.

Goldilocks Jobs

June 9th, 2013

In the long running comedy series “Frasier,” Frasier or Niles would often order a latte  in their local neighborhood bar, being careful to note exactly how they wanted the drink made.  Friday’s employment report was made to order – not too strong so as to hasten the end of the Fed’s latest bond buying program and not so weak as to confirm fears of another summer swoon.

Slowly and inexorably the number of employed trudges up the recovery hill.  The unemployment rate ticked up a scosh to 7.6% as more people tried to find work.  The year over year percent change is still in good territory.

On the not so good side, the percent of the total population that is working is still below the 30 year average of almost 44%.

The unemployment rate of those with a college degree is far below that of the general labor force but is still 50% above the average of the early 2000s.

Student aid loans have passed a trillion dollars (source).  To put that figure in perspective,  student loan debt is about 10% of the $11 trillion in outstanding debt of residential mortgages (source)

Changes in the bankruptcy laws in 2005 exempted student loan debt from bankruptcy.  Over the next decade or so, will the investment in education pay off?  Let’s hope so.  100 years, an 8th grade education became a standard used by employers to winnow job applicants in a tough job environment.  70 years ago, the new standard became a high school education.  For the past 30 years, we have moved to a 4 year degree as the new standard.
We now spend more on defense and more on Medicare that the $500 billion total amount spent by the state and the federal government on K-12 education. (source) Community college educators are painfully aware that many students are simply not prepared to take college courses.  Local communities used to fund 70% of K-12 education.  Thirty years ago, homeowners protested ever rising property taxes to fund K-12 education and, since that time, local funding has dropped below 50%.

If we expect our children to develop the skills for a college education, we are going to have to find an alternative model of funding.  The states have relied on an ever increasing share of Federal funding for K-12 education.  Although the percentage of Federal spending on K-12 is small, less than 10%, the aging Boomer generation will command ever more spending of general tax dollars in addition to the Medicare taxes collected.

The core work force aged 25 – 54 struggled upwards

but the participation rate, the percentage of the population in the labor force, is still weak.

The “total” unemployment rate, which includes those working part time for economic reasons, continues to drift down but is still high.

Understand that this represents over 20 million people, a bit more than the entire population of New York State.  Turn on C-Span sometime and tell me how many committee hearings on jobs there are.  Immigration, federal surveillance and the targeting of conservative groups by the IRS are important matters, yes, but why aren’t politicians in Washington talking about jobs?  There are several reasons: no one has a clue; no clear political advantage to be gained; constituents are not writing letters to their representatives and senators about jobs.

Welcome to the “New Abnormal.”

Employment – April 2012

This past friday, the Bureau of Labor Statistics (BLS) released their monthly assessment of labor conditions in this country and the headline figure was a disappointment.  The survey of businesses showed a seasonally adjusted 115,000 net jobs added in April, below the 150,000 expected by economists.  The unemployment rate dropped to 8.1% as almost 350,000 people simply dropped out.  Some of this was due no doubt to early retirees but the Federal Reserve estimates that retirees account for about 25% of the drop out rate.

As I have done in the past, I’ll take a deeper look at some numbers behind the headline numbers.  The core work force of people aged 25 – 54 continues to show gains but the chart below shows the comparative weakness of this segment of the work force.  This age demographic is the “middle”, when people accumulate both earning and buying power and form the primary demand of a consumer economy like the U.S.

The year over year job gains continue to climb upwards.

Late last summer, the larger work force of those aged 25 and older began showing year over year job gains several months before the core work force, revealing an underlying structural weakness of both the workforce and the recovery.

Some of the workforce is graying, moving from the core 25 – 54 age demographic into the older 55+ demographic, where workers are trying to save for retirement or taking jobs because their social security and retirement income is not adequate.  With a natural propensity for saving, older workers do not create the needed demand for the economy to grow strongly.  In the chart below is the year over year job gains for those aged 55+ and this is a key metric for it shows which age group have enjoyed the bulk of job gains in this recovery.

Throughout this recession and the massive loss of jobs, older workers have continued to show gains.  Strengths in the labor force statistics have been in retail, business services and health care.  Experienced older workers can be attractive to employers offering business services.  In retail and health care, it may be that older workers have less family responsibility, show a greater reliability and are thus more attractive to employers who enjoy a “buyers” market.  This past month was the first month that gains slowed while the gains of the core work force continued to climb.

As I have noted before, the demographic bell curve of the past three decades is coming to a close.  The participation rate, the number of workers as a percent of the working age population, has declined to 1981 levels, nearing the closing of an upswell brought on as the post WW2 boomer generation entered their prime working years.

The 1980 Census shows that, there were 25.5 million people 65 and older in 1980 (11.3% of the total population), an increase of 5 million from the 20.0 million count (12.3% of total) in 1970.  While the numbers climbed, the percentage stayed stable in that 10 year period.  Those aged 50 – 64 numbered 33.4 million, or 14.7% of the population.  In 1970, it was 29.7 million or 14.6%.  Again, the numbers were stable.  The median age of the U.S. population was 30.

Fast forward to the 2010 census and the percentage of those aged 65+ is still relatively stable at 40.3 million or 13.0% of the population.  Despite all the medical advances of the past 30 years and the trillions of Medicare dollars spent on the elderly, the percentage of older people is still about the same as it was in 1970 and 1980.

But the juggernaut of Boomers is waiting in the wings.  The 2010 Census shows that those aged 50 – 64, the “meat” of the Boomer generation, numbered 58.8 million, or 19% of the total population.  In thirty years, they have increased from 15% to 19% of the population.  The median age of the population is now 37 years, an increase of seven years.

The 25 – 54 age group funds the social contract that provides health insurance and retirement income for older Americans.   For this core work force, the increasing job gains of the past four months have been a welcome sign but, as the chart above shows, this core has suffered huge job losses in the past 3+ years and are climbing out of a deep hole.  I hope that April is the beginning of new trend, where the job gains increasingly go to the core younger segment of the work force and not to older Americans.  Only then will we see sustainable economic growth.

Tidbits

It’s the beginning of the year and I am cleaning up – not the house, but my notes – scribbles of factoids which I, and maybe you will as well, find interesting.  Those of you who like graphs will be disappointed this week.  😦

In 2009, 55% of income in the S&P500 companies was generated overseas.

The Eurozone is set up very similar to the Senate in the U.S.  Despite being 30% of the Euro economy, Germany only has one vote. 

It will cost an estimated $175B for the payroll tax cut in 2012.

A rule of thumb that the Congressional Budget Office (CBO) uses – 1/10% of GDP growth over 10 years = $300B in revenues over 10 years to the Federal Government.

One of the problems with the federal mortgage agencies FHA, Freddie Mac and Fannie Mae is that they buy mortgages which originate in states where there is little or no regulation.  If people want a government agency buying mortgages, why don’t the various states institute such agencies?

A CNN article about doctors going broke:
http://money.cnn.com/2012/01/05/smallbusiness/doctors_broke/index.htm?iid=Popular

This year, 2011, the USDA estimates that for the first time, this country will produce more corn for fuel than for food.

In 2009, total lending by U.S. banks fell 7.4%, the steepest drop since 1942. As of March 15, 2010, approximately half of Obama’s $787 billion stimulus program had been distributed but the flow of federal money into the economy could not keep up with the $700 billion that banks pulled out of the economy in the 6 months from mid-September 2008 to mid-March 2009.

Small companies, those with fewer than 100 employees, accounted for 45% of net jobs created from 1992 through the end of 2007, according to Labor Dept data.

In the U.S., diabetes costs about $174 billion annually in medical costs and lost production In the U.S., according to the American Heart Association.  That is a little more than a 1% impact in a $15 trillion economy, or about 25% of the defense budget.

This past week, Standard and Poors downgraded the credit ratings of nine countries in the Eurozone.  In assessing sovereign credit, Moody’s, another leading credit ratings firm, uses a metric called “debt reversibility margin.”  This measures a government’s ability and willingness to get their debt level under control over the next five to seven years.  Generally, it is the ratio of interest payments on a country’s debt to their revenues with a “benefit of the doubt” margin of 1 – 4% based on the resilience of the country’s economy, its politics and tax policies  When this metric rises above 10%, Moody’s considers a downgrade to the country’s credit rating. 

In 2008 New York spent $16K per student, top in the nation.  It’s student-teacher ratio of 13.1 was the eighth lowest among the 50 states.  From 2000 to 2009, the state added 15,000 teachers as student enrollment fell by 121,000 students.

Global warming is the latest in a series of hoaxes on the American people.  Earlier scams include: smoking can kill you, lead in gasoline and paint is bad for children’s brains, chemical discharges in rivers and lakes are bad for your health, cholesterol is bad for your heart, smog is bad for your lungs, and acid rain is bad for trees and plants. In my lifetime, all of the above have been dismissed by critics at some point as scams on the American public.

In 2010, a USA Today analysis of data from the federal Office of Personnel Management showed that a federal worker makes 77% more than a private sector worker when benefits are included.

In 2010, the Boston Consulting Group issued its Global Wealth Report which found that the top 0.5% of households (those with $5 million or more) owned 21%, or $23 trillion, of global wealth, up from 19%.

A Goldman Sachs analysis of mortgage refinancing found that homeowners took out $358 billion in home equity loans in 2005, the most of any year.

J.P. Morgan Chase and two other banks now hold more than 33% of all U.S. deposits.

Based on 2007 data, the Energy Information Administration reported the various U.S. government subsidies per megawatt hour for the different sources for generating electric power.  Coal got $.44, natural gas received $.25, nuclear enery $1.59 and the whoppers were solar at $24.34 and wind at $23.37 per MWH.  Over the course of a year, at an average consumption of 10,000 KWH per year, a 100 homes will consume a MWH.  In 2010, Google used the equivalent of 260 million homes of electricity.

When enacted in 1916, the income tax affected only the top 2% of incomes.  With the popularity of beards and other creative facial hair statements among younger men, it might be time to resurrect an old Russian revenue raiser – a beard tax.

New York bills Medicaid about $2 million per year for each mentally disabled patient.  The governor is reviewing the state’s billing procedures.

How much do all the tax breaks – or tax expenditures – cost the federal government?  Health Insurance premiums not taxed – $659 billion, mortgage interest deduction – $484 billion, capital gains and dividends taxed at lower rates – $403 billion, pensions – $303 billion, earned income tax credit – $269 billion, charitable donations – $241 billion, state tax deductions – $237 billion, 401K plans – $212 billion, capital gains basis adjustment at death – $194 billion, social security benefits not taxed – $173 billion.  The total is over $3 trillion, or almost the entire federal budget.  If tax breaks were eliminated, the federal debt would be gone in 5 years.