The market is a reflection of hope and fear, of world events that affect each of us, our jobs, our families, our schools, churches and neighborhoods. The 200 day moving average moves through the minute gyrations of the daily market like a great leviathan, changing its course only gradually. If you are a Star Wars fan, think of the 200 day as The Force.
For the long term investor, it is wise to buy or sell as this average changes direction. When we compare a month’s (21 trading days) average of the 200 day to the previous month’s average, we can see these changes in direction. At the onset of the recession in 1990, the S&P 500 index dropped about 17%. The recession was fairly short but it was a jobless recovery. From the October 1990 trough to the end of 1993, the index climbed 60%, then paused and stumbled.

Almost 3 years after the recession had officially ended in March 1991, the unemployment rate was still a lofty 6.5%.

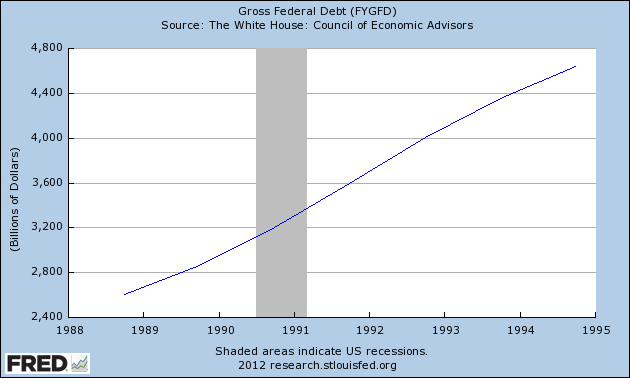
Due in part to the jobless recovery, the federal debt had risen 50% in the four years of 1990 through the end of 1993 and would continue it’s relentless march upwards for several more years.
In 1994, the 200 day average waggled in indecision, barely moving during that summer before nudging upwards in August, then falling again in November, before making its decisive move upwards in 1995. In six years, the index would more than double. When the 200 day began to roll over in the fall of 2000, the wise long term investor listened to that slow heartbeat and headed for the exits. In the middle of May 2003, the 200 day began another 4-1/2 year climb up before rolling over in Jan. 2008. 18 months later, the 200 day began yet another climb after the steep descent of the financial crisis of 2008. Just this past September, the 200 day signaled exit after a tumultuous summer and before continuing unrest in the fall.

A person investing in the S&P500 index who turned when the 200 day average turned would have made 460%, including dividends, on their money since 1994, 81% in the past ten years and that doesn’t include money that could be made in interest while their money sat safely outside of the market mayhem.
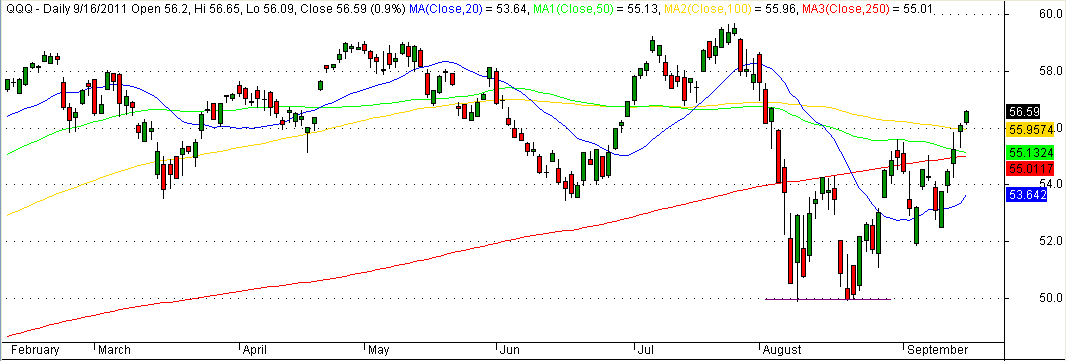
In the last quarter of 2011, the 200 day moving average had been slightly declining but largely flatlining – unchanged – since the beginning of August. A week ago, it nudged higher. Will this be like the nudge higher in August 1994 that may reverse in a month or two? Could be. Although the signals of the 200 day average are relatively few, a prudent investor would monitor the situation every week in case this is a “waggle” and not the beginning of a move up.