On July 4th, I cautioned about dramatic weekly moves in the market. This past week we again had a dramatic surge upward, fueled in part by the Federal Reserve’s commitment to backstop European banks with dollars for the rest of the year. On July 4th, I wrote “If there are some positive surprises this week, then this could be the start of the third leg up in stock prices. If there are negative surprises, watch out below…”
We indeed had a big surprise that following Friday when the Labor Dept (BLS) reported a mere 18,000 jobs created in June. In August, BLS reported 117,000 jobs created in July but the Household Survey showed little change in employment levels or what is called the EMRATIO, the ratio of working people to the entire population. In September, the BLS reported a historic zero jobs created in August.
In a June 20th blog I wrote about the convergence of several moving averages (MA). This week I will highlight the crossing of two averages, the 50 day and the 250 day. 10 days ago, the 50 day average of SPY, an ETF that tracks the S&P500, crossed below its 250 day MA, a sell signal for longer term investors. For the past 17 years, if you had bought this index when the 50 day MA crossed above the 250 day MA and sold when it crossed below, you would have made 455%, buying and selling only 5 times in those 17 years. Buy and hold would have resulted in a 356% return over those years. (Click to enlarge in a separate tab)

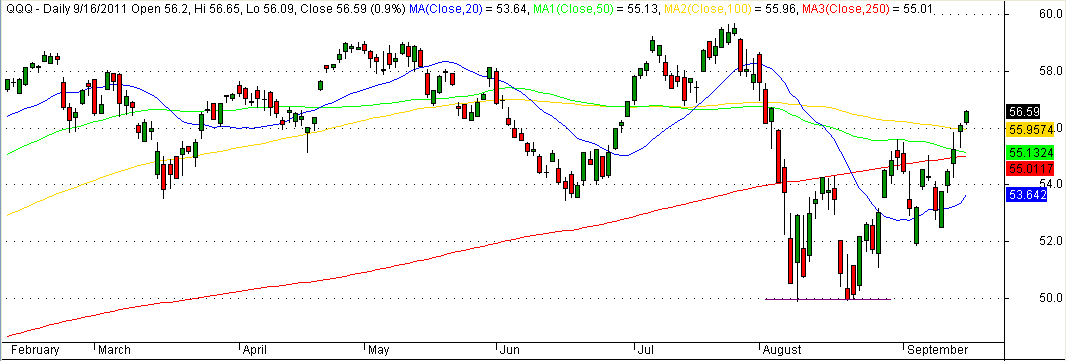
QQQ is an index that tracks the top Nasdaq stocks. Using this same formula, you would have made a 74% profit since January 2000. During that period, the index has lost 38% of its value from the heyday of the tech stock boom. The 50 day MA is about to cross the 250 day MA.