The Long Run

Now the really big picture.  Reflecting the severity of the market downturn that began in late 2007, the 4 year average (50 month) of the S&P500 index is getting close to crossing below the 17 year (200 month) average.  Remember, this is years.  In the normal course of affairs, inflation tends to keep the shorter average above the longer average.  The crossing or “nearing” of these two averages reveals just how sick the past decade has been.  The last time the market showed this indicator of prolonged market weakness was in the first half of 1978, after a 43% market drop in the bear market of 1973-74 and a 19% drop in 1977.

In the last 60 years, was the October 2008 market drop of 17% the deepest monthly plunge in equity prices?  No, that honor goes to the almost 22% dive in October 1987.  For a consecutive 3 month drop, 2008 does barely nudge out 1987, both falling 30%.

Although headlines will speak of the downturn in the Fall of 2008 as the worst since the depression, it is important for Boomers to remember that our parents’ generation suffered through some pretty severe market declines as well.  In 1987, most Boomers were in their thirties and probably had relatively few dollars in the stock market.  We may remember “Black Monday”, October 19, 1987, for the headlines but it was not as personal as the 2008 decline because we were decades before retirement and had less at stake.  What particularly distinguishes the two years is that the unemployment rate continued to fall during the 1987 decline.

Young people don’t remember market crashes the way that older people do.  When we are young, we have – like forever – before we are going to be old.  For the echo boomer generation born in the eighties and nineties, also known as the  “millennials”, or Generation Y, the crash of 2008 will be a faint or non-existent memory when they reach their fifties decades from now.  They will probably get to have their own crash – one that they will remember because they will have more at stake.

When we are in our twenties, someone should prepare us.  We are going to work hard and save money.  We are probably going to put some of that hard earned money in the stock market.  Then, when we are in our fifties, sixties or seventies, we are going to flip out when our stock portfolio drops by 40%.  Would we listen to or remember that sage advice?  Probably not.

Recession and the Presidency

On Tuesday, President Obama will give his annual State of the Union address to Congress and the nation.  This past Saturday, South Carolina chose Newt Gingrich, the former Speaker of the House, as the front runner in their Republican primary.  In three grassroots states, Iowa, New Hampshire and South Carolina, primary voters have chosen three different Republican contenders who are vying for the Chief Executive Office.

For the past 150 years, every President except Lyndon Johnson, Jack Kennedy and Bill Clinton has had to contend with recession during their tenure. (NBER Source)  Every Presidential contender promises that they are going to stop the vicious business cycle that inevitably leads to recession.  With the advent of “JIT” – Just In Time Inventory – increasingly adopted by businesses and their suppliers in the mid to late 90s, recessions were pronounced a thing of the past.  No more would there be an excess build of supply by the nation’s businesses, leading to a sagging economy when product demand inevitably fell.  Advances and investments in technology enabled businesses to respond quickly to fluctuations in demand.  As the milennium approached, it was truly the dawning of a new age.

What was dawning was the advent of a secular bear market, a long period of time when the market falls for a few years, struggles up again, then falls, then rises again as fear and hope compete against one another.

A few weeks ago, I noted that in the middle of 2011, we had finally come out of an almost four year  recession.  This was not the official National Bureau of Economic Research end of the recession.  That happened in the middle of 2009.  This mid-2011 recession end was the “How It Feels” variety as real GDP finally gets back and surpasses the level it was at before GDP started its decline.

Below is a graph comparing the official lengths of recession and the “how it feels” recession length and a comparison of the two during each President’s tenure in the past sixty years.  This comparison helps explain the mood of the country when Presidents Ford, Carter and HW Bush lost re-election bids (Ford was actually not up for re-election since he had taken over the Presidency when Nixon resigned in August 1974).  The chart also gives an insight into the success of re-election bids by Eisenhower, Nixon, Reagan, and GW Bush. The economic pain was either less than or about equal to the official figures of economic distress during their presidencies.

As he prepares for his third State of the Union address, the lesson for President Obama is stark.  History unfortunately repeats itself.  It is also a lesson for any Republican Presidential hopeful; the odds are that he will have to contend with a recession during his tenure if he wins election.  On the campaign trail, how many Presidential hopefuls of either party ever broach the subject of what their administration will do during the eventual recession while they are in office?  Better to promise that it won’t happen on their watch.  It will.

Year in Review

Jerry and Steve passed on some links to some interesting charts. At the Atlantic is an assortment of graphs of both the European and U.S. economies from a group of economists surveyed by the BBC. Featured on WonkBlog and in the Washington Post is a compendium of graphs more focused on the U.S. economy.

But the most telling chart of all is the end of the recession! After 4 painful years, Real (or inflation adjusted) GDP has finally reached and surpassed the level it was in 2007, before the recession. The official end of the recession was – cue the laugh track – in July 2009.

While this is not the “official” end of the recession marked by the Bureau of Economic Analysis, it is a more pragmatic one used by many traders, investors and market watchers, including Warren Buffett.

Unemployment still sucks (a technical economic term). The real unemployment rate is about 17% and that picture does not look bright.

Residential housing starts still suck. The market for multi-unit housing has been strong because so many people can not afford or qualify to buy a home despite the fact that there are hundreds of thousands of vacant homes littering the country.

The Euro Zone may implode in 2012 and the political indecision both in the U.S. and Europe have caused many companies to be cautious in their investments and capital spending. The Coincident Economic Activity index sucks but is getting better.

The U.S. consumer is still not back. Below is a graph of real retail sales.

This is going to be a long slog. Keep your head down and move forward.  If you have a job and are not upside down on your mortgage and you broke even in the market this year, you should have a Merry Christmas.  Give to those who may have lost their merry along the way.

Unemployment Initial Claims

Every Thursday the Bureau of Labor Statistics (BLS) compiles the initial claims for unemployment in each state.  It publishes both the raw figures and a “seasonally adjusted” (SA) number which accounts for anomalies like higher initial claims after the Christmas season is over and department stores lay off employees.  To smooth out the weekly numbers, it uses a 4 week moving average to get a truer trend of the number of people filing initial claims for UI.

Below is a 5 year history of these initial claims.  In the past few months, the number of initial claims has resumed its decline but a signal that the labor market is on a solid recovery path occurs when the 4 week average drops below 400,000.  As you can see in the graph, initial claims hovered around the 300,000 mark during the mid decade when the economy was more robust. (Click to enlarge in separate tab)

We often hear and read of comparisons of current unemployment with that of the 1982 – 83 recession.  A picture is a worth a 1000 words so I took a 3 year slice of the graph above and overlaid it on a graph of initial claims during the early 80s.

They look similar except that the current recession lasted longer than the 1982-83 recession.  In the past few years and in  the early 80s, intial claims climbed dramatically, then fell.  The comparison graph shows the important difference.  Unlike the early 80s, when initial claims continued to fall as the economy recovered, we have been “stuck” this year in a very slow decline of initial claims.

To understand the true severity of this downturn, however, we must really “zoom out” and look at total civilian employment, which includes government civilian workers as well. 

Unlike the recession of the early 1980s, the current downturn has seen a drastic decrease in total employment.  Although not technically a depression, we can say that this “past” recession was (and is) the mother of all recessions so far.

The graphs above are courtesy of the research division at the St. Louis branch of the Federal Reserve and are available quite easily to the general public.

Unemployment Rollercoaster

At the end of September, the Congressional Budget Office (CBO) appeared before the Senate Budget Committee and presented their outlook on the economy, the deficit, and unemployment. (Click to enlarge in separate tab)

Source:  Congressional Budget Office (Click on Director’s Slide Show)

The recessions of 1980 – 81 and 1982 – 83 were really one long recession.  A several month uptick between the two recessions is the only thing that separates them.  It took several years before the National Bureau of Economic Research had enough firm data to call it two separate recessions.  I will call it a “recessionary period.”

Although this recession officially ended in June 2009, the persistently high unemployment, similar to the levels of 1980 – 1983, makes the present period an equally severe period.  But what makes the current malaise truly stand out is the rate of the long term unemployed, as shown in the graph below.

What surprised me is that men consistently suffer much higher levels of unemployment in tough times even though they are only slightly more than half of the workforce.  According to the Dept of Labor, women made up 46.8% of the workforce in 2009.  This is probably due to the greater number of men workers in the construction field, which generally suffers heavily during recessions.

For many men younger than 50 in the construction trades, these past two years may be the wake up call – that they need to build a more versatile skill set; that they can’t rely on a high school education and a learned trade skill to get them by; and in good times, it is wise to put some of the beer, boat and truck money in a savings account.

Recession Procession

Recently, the National Bureau of Economic Research (NBER) made their official pronouncement that the recession that began in Dec. 2007 ended in June 2009. In July 2009, the Federal Reserve had issued its unofficial estimation that the recession had just ended. This latest announcement by the NBER is a statistical confirmation of what the Federal Reserve had announced over a year ago. To many individuals and businesses, however, the recession is not over. In a CNBC interview, the renowned investor and billionaire Warren Buffett stated his more common sense definition that the recession is not over until production and income get back to the levels they were before the recession started. Most would agree.

There is no clear definition of the beginning and end of a recession but the NBER’s Business Cycle Dating Committee states that a recession is “a significant decline in economic activity spreads across the economy and can last from a few months to more than a year.” The rule of thumb is two consecutive quarters of negative GDP growth. But neither the NBER definition or the rule of thumb adequately captures the effect – how it feels – of a downturn in the economy. That is because the rule of thumb is based on quarter to quarter growth or decline in GDP. If GDP were a $1 and, over a year, fell to 80¢, then rose to 85¢ in the following quarter, the economy would still be terrible but the growth in GDP would be an annualized 25%. For this reason, Buffett’s rule of thumb gives a more accurate picture.

Below is a NBER chart of real, or inflation-adjusted GDP, with Dec 2007 being the benchmark of a 100. As you can see, our economy is still below the level of December 2007. (Click to view larger image in a new tab)

The severe downturn in manufacturing and retail sales tells a more complete picture, not only of the national economy, but the state and local economies which depend heavily on sales taxes for their revenue. Total unemployment is about 16% of the workforce and, until that situation improves, there will be only sluggish growth in sales, which in turn will keep on damper on GDP growth.

Romer Regrets

Jerry referred me to an article by Dana Milbank at the Washington Post, relating comments by the departing Christina Romer, Chairman of Obama’s Council of Economic Advisors.  According to Mr. Milbank, Ms. Romer said “she still doesn’t understand exactly why [the economic collapse] was so bad.”   Ms. Romer, well respected in her field, will probably share some of the blame for underestimating the deep structural weakness of an economy in which all the players had become over leveraged. In Ms. Romer’s defense, the cautious Federal Reserve, including the former chairman, Alan Greenspan, and the stock market underestimated the problem as well.  The Fed called for a recovery in the latter part of 2009.  The market’s rise from the March 2009 lows signalled the same outlook.  The stock and bond markets reflected the opinions of a majority of economists at investment houses, mutual funds, hedge funds.  How could so many educated people be wrong?

Ms. Romer is a proponent of Keynesian economics, a theory that government spending can offset the lack of demand in the private sector during recessions.  When John Maynard Keynes proposed his theory in 1930, his remedy of government spending was an antidote to smooth the regular ups and downs of business and economic cycles. In his theory, Keynes proposed that governments then run surpluses during good times to counteract the overly heated demand of the private sector.  As such, Keynes could not have imagined that governments would run up the large amounts of debt that they have in the past decades.  His theory was never designed for a recession or depression resulting from such a massive over-leveraging of both public and private debt.

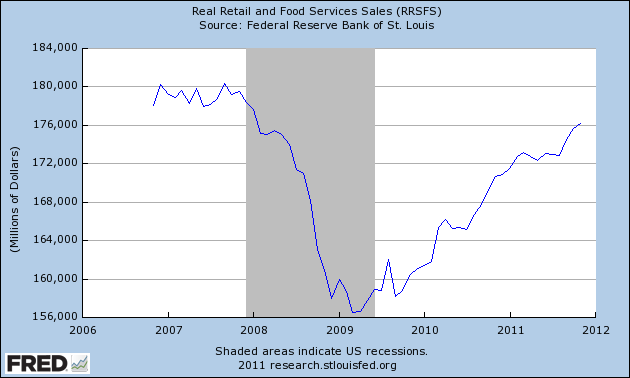
Misjudging the scope and severity of the collapse of this asset and debt bubble led economists like Ms. Romer to think that Keynesian solutions like the stimulus bill passed in early 2009 would provide a substantial “kick” to the economy.  The stimulus bill has helped stopped the bleeding but the wound is deep.  Government tax credits for house and car purchases did little more than shift those purchases forward in time. Stimulus payments to states helped avoid state and local government employee layoffs – for a while.  They did nothing to fix the central problem:  businesses and consumers are paying down debt that they have spent almost a decade accumulating.  That de-leveraging is going to take time.

Economists who have a more classical view of the mechanics of commerce predicted that we might tip into a double dip recession, at worst, or a very slow “U” shaped recovery starting in 2010.  As a number of economic indicators turned positive in the early part of 2010, these same economists thought they might be wrong.  Some Keynesians felt vindicated as this economic data seemed to show that their model of government spending could shorten even a severe recession.

In February,  government deficits in Greece and several other European nations revealed the structural weakness of their economies and caused the stock and bond markets to question whether these smaller economies could withstand the relatively high ratio of government spending and debt as a percentage of each country’s GDP.  Germany, a paradigm of conservative fiscal policy, was forced to step in to help support these less fiscally responsible nations.  The European Central Bank, supported by the Federal Reserve, professed a firm support for the bonds of these weaker European nations.  With the magic that only central banks possess, the Federal Reserve pumped $1.2 trillion into U.S. government backed mortgage securities, signalling that it would not allow the newly recovering economy to fall back. In the spring of 2010, the market once again turned to the recovering economy.

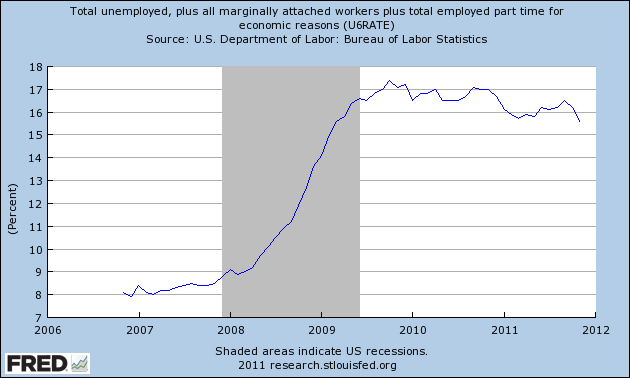
Employment usually lags in any recovery and so many expected the unemployment rate to stay high going into the early part of 2010.  In April, after 8 or 9 months of expansion in the manufacturing sector and a recovering service sector, economists were expecting at least some reduction in the unemployment rate.  By late June and early July there appeared to be little increase in hiring.  Those who believed in a more traditional “V” shaped recovery began to have doubts and the market dropped to reflect these lowering expectations.

Week after week come conflicting economic reports, the Federal Reserve is running out of tools other than the rampant printing of money and the unemployment rate stubbornly hangs from the cliff of 10%.  Classical economic models seem to more accurately reflect the slow, tortuous climb out of the debt pit.

Decades from now, regardless of what happens, Keynesian economists will still profess that Keynes’ economic model was right – with perhaps a few modifications to their theory.  Classical economists who agree with the models of Hayek and Friedman will maintain that they are right – with a few modifications.  Fifty or a hundred years from now, our kids’ grandkids will get to do it all over again because too many policymakers would rather cling to their theories than learn from experience.

Economic Weather

Understanding and predicting the economic weather is less precise than, well, predicting the weather.  The stock market is a composite “vote” of the direction and strength of corporate profits in the coming six months to a year.  It is not a barometer of what the economy will do, but an indicator of people’s predictions, their fears, their hopes. Predicting the economic weather involves a complex interplay of many factors, which, by themselves, are not that complicated.  It is the interplay and the weight, or importance, given to each factor that accounts for the range of prediction.

Henry Blodget is a former Wall St. analyst who was indicted by the Securities and Exchange commission for ethics violations during the “dot com” boom at the end of the nineties.  Blodget subsequently founded the Business Insider, a blog about trends in business and the economy.  Here  is a compilation of charts on the labor market, housing, and manufacturing output for several decades.  You may or may not agree with Blodget’s dire prognostications but the overall picture of data that he has pulled together is worth a look.

Job Loss

Since the start of the current recession, the cumulative job loss is 8 million, a staggering figure when compared to past recessions. The 1981 – 82 recession was severe and has often served as a benchmark during the progress of this recession but the total job loss was less than 3 million.

In a 10/17/09 WSJ article, Sara Murray focuses both on the job loss of recessions in the past forty years and the recovery periods, the time it took to regain those lost jobs after the recession ended. The 2001 recession lost almost as many jobs as the 1981 – 82 recession but took a painfully long 47 months to regain the lost jobs. This recession has lost three times as many jobs as the 2001 recession and we are still counting job loss every month.

Consumer spending accounts for more than two-thirds of GDP in this country. Unemployment affects not only the unemployed but those with jobs who become more cautious in their purchases, fearing that they might be next. Those who have been betting on a swift recovery are likely to be disappointed.