Things That Spring

April 14th, 2013

Across the land, springtime wakens the trees and flowers, birds chirp and squirrels chatter.  From the buildings where the humans live comes the wailing and gnashing of teeth as many procrastinators spend this last weekend before the tax deadline in a spring ritual of angst.  The lost W-2 form is finally found beneath the Netflix DVD that has lain casually on the bookcase, waiting to be watched.  The 1099DIV form is found beneath a birthday card that was never sent.

Lay aside your problems; let’s climb inside the hot air balloon and look at the big picture.  A few weeks ago, economic growth for the fourth quarter of 2012 was revised marginally higher into positive territory, but dropping from the annualized growth rate of 3.1% in the 3rd quarter of 2012.  Let’s look at GDP from a per person basis since WW2.  Until the recession hit in late 2007, economic growth had consistently outpaced population growth.  Then POOF! went the economy and blew away a big gap in GDP.

Let’s zoom in on the past ten years to see the effect.  On a per person basis, the gap is $5,000 of spending that simply didn’t get spent.

Call it the GDP dust bowl of the 2000s, similar to the dust bowl of the 1930s when the wind blew the top soil from the prairie of the Oklahoma panhandle and forced many families from their farms.  In this case, the wind blew away a lot of jobs and chunks of home equity.

Policy makers in Washington want to close that $5000 per person gap.  If they could write a law forcing everyone to spend that $5000, they would.  Instead, they keep giving away money in unemployment benefits, food stamps, disability benefits, crop subsidies – all to keep people from not spending even less and making the problem worse.

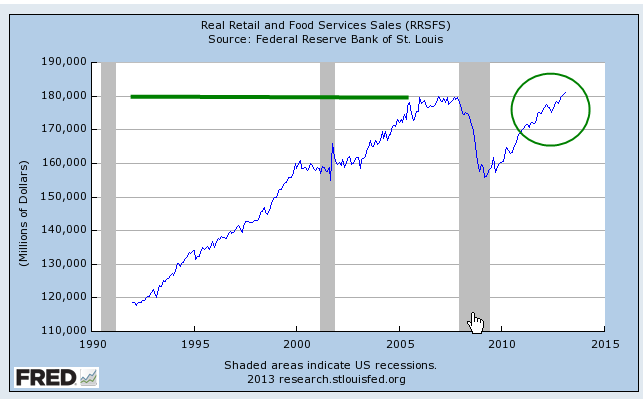
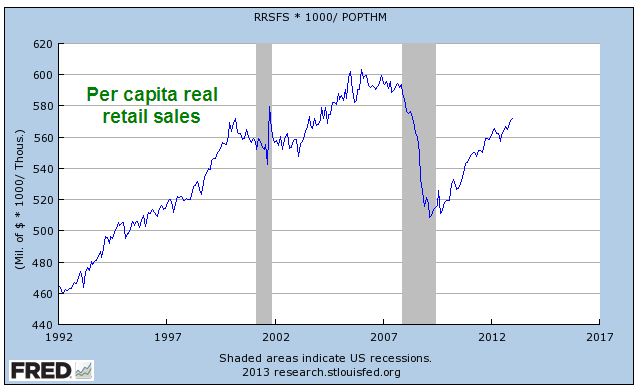
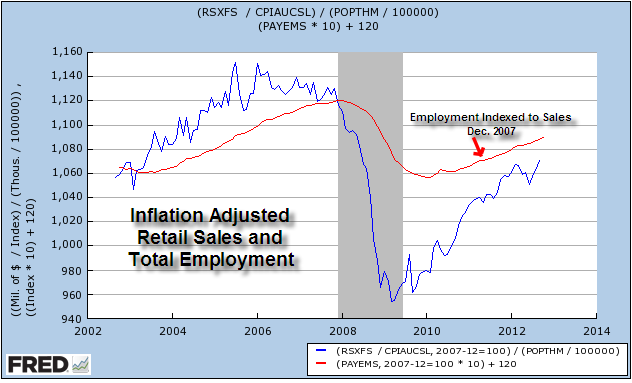
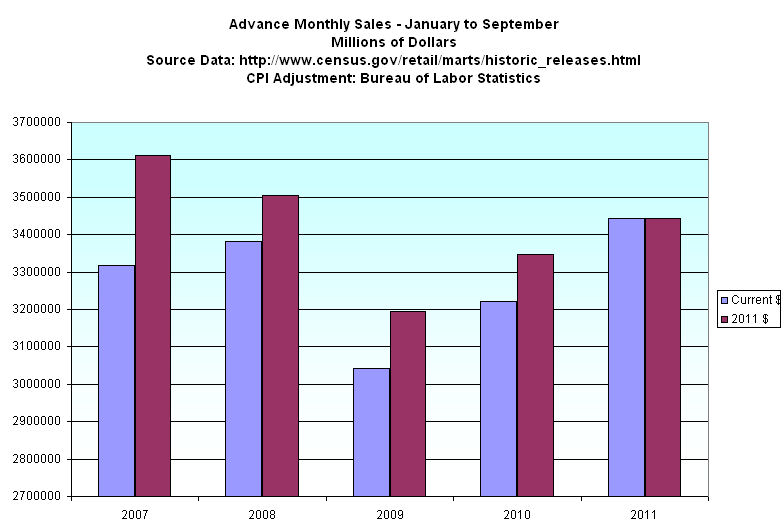
Retail sales account for about 1/3rd of the total economy.  Including automobile sales and parts, consumers are still below twenty year averages.

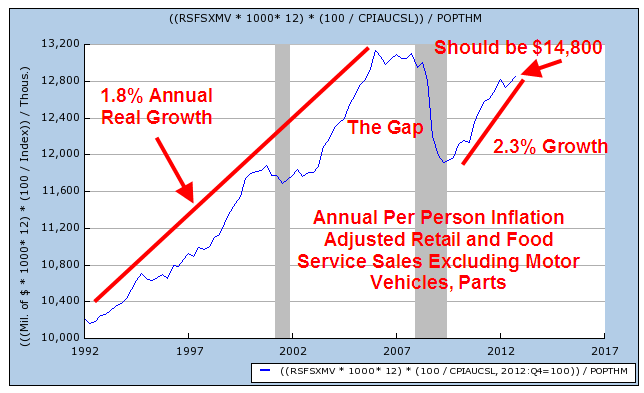
This past Friday, the monthly report on retail sales showed little change from the past month.  When we look at per person real retail and food sales and take out automotive sales we get a feel for core sales, those that we make on a frequent basis.  Once again, we see the same gap that we saw in GDP.  Since mid-2009, this core consumer spending has grown 2.3% annually, above the 1.8% annual growth trend from 1992 through 2006, but it still down $2000 a year from what we would have spent if we had stayed on the same trend line before this past recession hit.

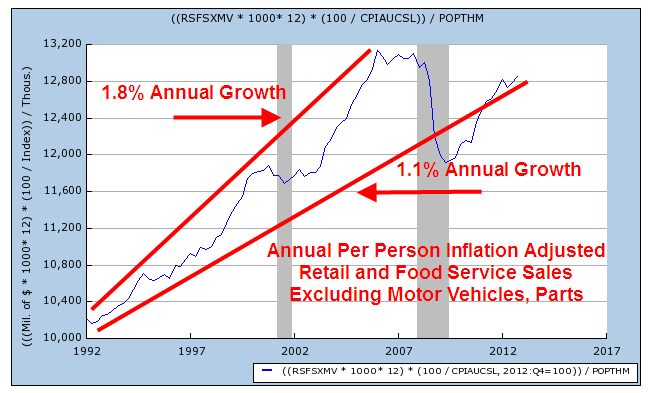
To make it a bit clearer, let’s look again at that chart and compare the 15 year annual growth rate from 1992 to the longer 21 year growth rate.  It has fallen from 1.8% to 1.1% annual growth.

GDP measures spending; let’s look at Gross Domestic Income, or GDI.  A fundamental principles of economics is that it takes money to spend money.  A six year old asks a parent “Why can’t we just go out and get more money?” to which the parent replies “Whaddya think money grows on trees?!”  End of Chapter One in the Parent’s Guide to Economics.

When we compare the country’s income to spending, we find that a dip in income below production precedes recessions.

After the 2008 – 2009 crash and recovery in national income and spending, both are limping along.

A few weeks ago came the monthly New Orders, an indication of business confidence.  As regular readers know, I have been watching this declining trend since September of last year, when the percent change in New Orders was negative.  The recent rise has been a welcome sign of growing confidence but new orders fell 2.7% in February and now hover around the zero growth line. 

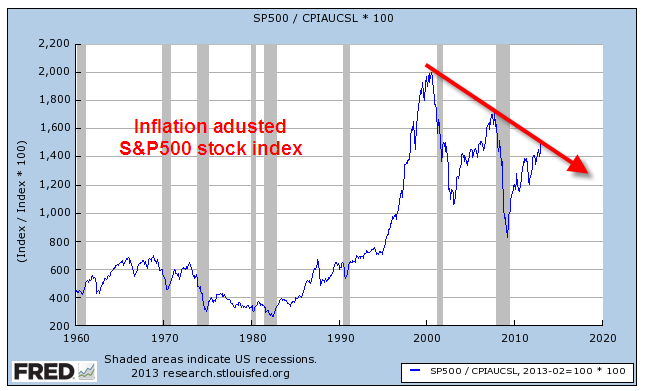
On a quarterly basis, the year over year (y-o-y) percent change is still firmly in negative territory, meaning that businesses are not putting up more money to invest in new equipment.  Why?  Because they are still not sure about consumer spending. The six month run up in the SP500 stock index might lead a casual observer to think that the economy and companies are gearing up.  New Orders indicates that there is much more caution out there than the stock index would indicate.

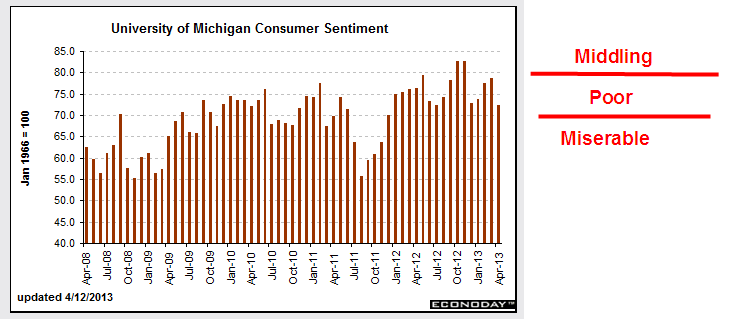
This past Friday, business’ caution to commit to new investment was only reinforced when the latest Consumer Sentiment index was released.  After climbing the past few months, confidence is sinking again.  Maybe it’s the extra 2% coming out of paychecks since January 1st.  Whatever it is, it doesn’t inspire many business owners to put a lot of money into expanding their production.

When the stock market is trading on hope, it looks six months ahead.  The recent run up is hoping for double digit profit growth in the second half of this year.  When the market trades on fear, it looks ahead about 2 seconds, faster than the normal investor can or should react.  Let me get out my broken record for another spin, cue the needle and play that same old song “Diversify.”

P.S. For those of you who are more active investors, check the latest post from Economic Pic in my blog link list on the right.  It shows the past 40 year returns for a strategy of selling the SP500 index in May and buying the long term government / credit index.  The iShares ETF that tracks this index is ITLB.  A comparable ETF from Vanguard is BLV.

Blossoms and Blight

March 24th, 2013

The Blossoms

There have been a number of encouraging reports these past several months, helping to fuel new highs in the popular SP500 stock index.  After falling off dramatically five years ago, real (inflation adjusted) retail sales finally surpassed 2007 levels.

Housing prices around the country are on the mend.  Although the purchase only home price index is still below the vaulted levels of the bubble years, it is exactly where it would have been if there had been no bubble and housing prices had grown at their customary 3 – 4% per year.

In recent months, the manufacturing sector of the economy has surged upward, rebounding from weakness in the latter part of 2012.  For the past year, the Eurozone has been in or near recession, yet some are hopeful that increased demand in this country and some emerging markets are helping to balance the contractionary influence of decreased demand in the Eurozone.  Let’s hope that this surge in the first part of the year does not fade as it did in 2012.

New claims for unemployment continue to decline. 

The Blight

But a 7.7% unemployment rate and a record 14 million disabled (SSA Source) show that the labor market is still sick.  The percent of working age people who are working, or the participation rate, continues to drift downward.

While the steadily improving retail sales indicate growing consumer confidence, per capita purchases are about where they were in the late 1990s, 15 years ago.

While consumers have been shedding debt, state and local governments continue to hold large levels of debt which does not include promised pension and health care benefits to retirees.

Federal Spending continues to outpace receipts, adding to the debt at a rate of more than 4% per year. At that rate the debt will double in about 18 years, reaching $30 trillion in 2030.  As a percent of the entire economy of the country, the deficit or annual shortfall between spending and revenues is still about 7%.
 

As housing prices recover and households either pay down or shed debt in foreclosure or bankruptcy, household balance sheets are looking better. What has happened in the past five years is a massive shift of household debt to the balance sheets of local, state and federal governments.

The blossoms catch our eye, inspiring hope, causing some to not notice the blight.  But the stock market, the barometer of millions of watching eyes, tells a more complete story.  While the stock market has shown renewed optimism in the past several months, its inflation adjusted value indicates a more tempered enthusiasm for the long term future of the economy and corporate profits.

Power To The People

A moment to acknowledge the personal caring and effort of ordinary people, the courage and doggedness of first responders during the superstorm “Sandy” and a heartfelt sympathy for those who lost loved ones during the storm.  Mile long lines of cars waiting for gas brought back vivid and unpleasant memories of the 1970s when many of us who lived in NYC would get up at 4 AM just to wait in line for a few hours to buy gas so we could get to work.  Resilience and persistence are bred into many New Yawkers (that includes you guys and gals in Jersey, too).  The clean up and repair will test every ounce of both during the next year.  Some losses, of course, are not the kind that can be repaired, only endured with the support of family and friends.

                                                                  _________________

The October employment figures released two days ago showed an increase of 171,000 jobs this past month, about 50,000 more than expected and a welcome relief to the Obama campaign.  Retail and restaurant jobs posted strong gains and health care jobs continued their strong growth. 

More people started looking for jobs, bringing the unemployment rate up a smidge to 7.9%. The year over year percent change in unemployment is relatively healthy, as shown on the 60 year chart below.

This past week came a series of positive reports.  Consumer spending rose .8% in September and home prices continue to improve, showing a .5% monthly gain in the Case Shiller index of 20 leading cities.  Both of these indicators have shown recent strength but the year-over-year gains for both consumer spending and home prices is a plodding 2%.

Consumer confidence has shown strong improvement the past four months and is expected to have about the same positive sentiment level as last month’s survey. As I noted last week, the consumer has lately shown more confidence than the business community.  The Chicago manufacturing index dropped last month and is now at a stall speed.  Tomorrow the national manufacturing report will be released.  The manufacturing sector is certainly responding to the weakness in Europe and slowing growth in China and southeast Asia.

While the employment gains were welcome, there are too many negatives that continue to show.  We are barely keeping ahead of population growth.  Below is a chart showing an index of employment and population growth.  We are still down about 7% from the peak in late 2007, which was more of a bubble level of employment.  We could reasonably target mid-2004 levels.

The core work force of those aged 25 – 54 is showing a little upward movement over the past two years but is still anemic.

Most of the job gains are going to older workers above 55. “Get out of the way, pops!” may become the mantra of younger generations. 

The loss in production jobs leads to a continual increase in the proportion of management and professional jobs.

Hourly Earnings gains are flat out terrible, hitting an all time low.

There are still too many people working part time because they can’t find a full time job.

The number of discouraged workers is declining but is not healthy.

Retail sales, particularly auto sales, are an indication of rising consumer demand.

But after adjusting for population growth in the past decade, we have finally climbed back up to where we were 8 years ago.

To show the correlation between retail spending and employment, I’ve overlaid an index of one over the other.

As you can see, retail sales lead employment gains and losses.  I sincerely hope that retail sales will continue to improve and turn around the recent business pessimism.  My chief concern is the lack of competence and character in Congress on both sides of the aisle.  This coming election will do little to alleviate those concerns.

Savings Crisis

Last week the Commerce Dept reported that consumer credit had grown in November at an annualized rate of 10%. 

The growth consisted mostly of car and truck sales, which shows increasing confidence and pent up demand.

Below is a chart of revolving credit outstanding which excludes auto sales.  As we can see, the American consumer is still struggling.

Taking a longer perspective, let’s look at the personal savings rate for the past 50 years.  The savings rate is calculated by subtracting all personal consumption expenses, including interest, from disposable personal income (gross income less taxes).

The savings rate shows the underlying resilience – or lack of it – of the average American household.  Savings helps fuel investment in companies, investment in local, state and federal government bonds.  As our savings fall, we become ever more reliant on foreign money to fuel this country’s debt and growth.

Retail Sales

A week ago the Census Bureau released the Advance Monthly Retail Sales report for September.  When adjusted for seasonal factors and holidays in the reporting period, September sales showed a slight 1.1% increase from August and an almost 8% increase over September 2010 sales.  A tepid – but better than expected – employment report the previous week and growing consumer sales has countered fears that the U.S. might be entering a double dip recession. Hopes that Europe will reach some resolution to their debt crisis and the reduced fears of another recession have helped power the stock market almost 15% higher from its October 4th lows.

Has the U.S. consumer come back?  Below is a 20 year chart of seasonally adjusted retail sales in inflation adjusted dollars.  As you can see, we are still struggling to reach the levels of 2007.

The Christmas season can account for 40% of many retailers annual sales.  The other nine months of the year, from January to September, show the underlying resilience of the consumer economy. I pulled up the September Advance Monthly reports from the Census Bureau for recent years to get a comparison. I used Bureau of Labor Statistics CPI data to show sales in real dollars.

Although we have finally surpassed the nine month total of 2008 in current dollars (violet bars), the inflation adjusted sales figures show that we are still below the levels of 2007 and 2008.  State and local governments rely on sales taxes for about a third of their tax revenue.  The Census Bureau reported that sales tax revenue for state and local government in 2010 was $17 billion less than 2007, a 4% decrease.  In inflation adjusted dollars, the decrease in sales tax revenues is almost 12%.

How have state and local governments made up the shortfall in sales tax revenues?  Corporate income taxes increased 50% from 2007 to 2010, more than making up for the decline in sales tax revenues.

Property taxes make up 30% of tax revenues for state and local governments.  Given the sharp decrease in house prices, I would have expected that property tax revenues would have declined but changes in property taxes lag changes in the market price of houses.  In 2010, property tax revenues were 10% above 2007 levels, double the 5% inflation rate for that period.  Although 2011 figures are not available yet, I would expect that property taxes declined this past year.  State and local governments are praying that there is a pickup in retail sales to compensate for reduced property tax revenues.

The bottom line?  The pressure points may shift but the pressures on the economy as a whole remain constant.  Private industry continues to add enough jobs to compensate for population growth and reductions in the workforce of state and local governments but not enough to bring down the unemployment rate.  Revenues to state and local governments may show slight improvement but not enough to keep up with inflation, and certainly not enough to rehire these lost government jobs in the near future.