The week’s letter is about the relationship between savings and inflation. On Tuesday, Jay Powell, the Chairman of the Fed, announced that they would continue raising rates to get inflation under control. The market dived a few percentage points. There are no shortage of explanations for persistent inflation. Despite an inflation rate above 5% for the past year, the employment market remains strong, a puzzle to economists. I will take a look at how changes in savings affect inflation.
There are times when we coordinate our behavior for apparent reasons. The weather and seasons synchronize the activities of farmers. The harvest comes at a particular time and farmers need to rent more harvesting equipment, storage capacity, rail cars and trucks for transporting their crops. Suppliers are on a different time schedule than their customers. Supplying anything takes planning, investment and time.
Suppliers rely on the fact that buyers coordinate their buying decisions according to the seasons. Clothes, gardening and Christmas gifts are easy examples. Forty percent of homes are sold during the spring months. Except for big purchases, a buying decision takes less planning and this can create anomalies that suppliers are not prepared for. Sometimes it is a popular toy at Christmas or a clothes style made popular by a celebrity.
What causes asset buyers to coordinate their behavior? The economist John Maynard Keynes was particularly interested in that question. He attributed the phenomenon to “animal spirits,” an infectious rush of pessimism or optimism that affects the prices of assets first, then spreads to the purchases of goods. Normally, some of us are saving more than usual for something, while some of us are spending that savings, or borrowing to buy things. There is a balance of savers and borrowers. However, sometimes a general prudence causes everyone to save more than average and what emerges is a paradox, the Paradox of Saving. If everyone saves, then economic activity declines, unemployment rises, people spend down their savings and the economy finds a new equilibrium at a much lower growth rate.
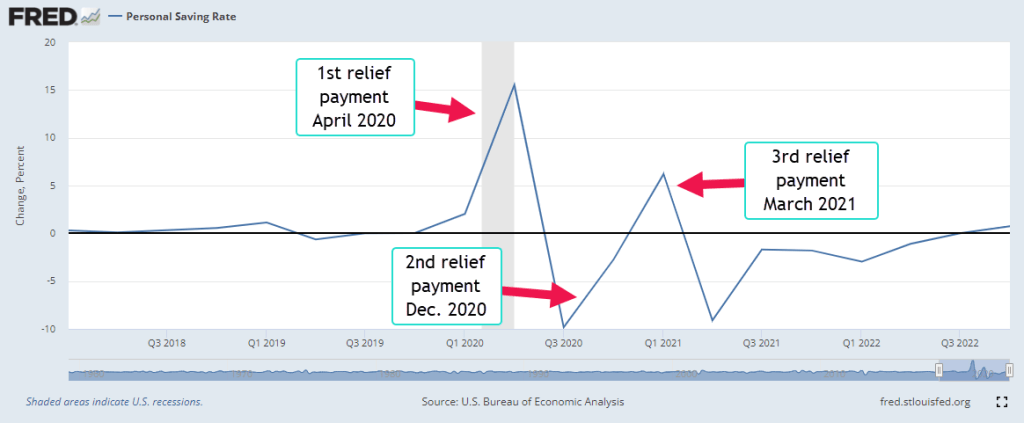
In the spring of 2020, a surge of Covid deaths in Italy and New York City prompted the closing of many businesses. City morgues were overwhelmed, forcing hospitals to rent refrigerated trucks to store the bodies. The NY health department supervised several mass burials. Residents in rural areas who were unable to catch their breath were flown to distant hospitals with the equipment and personnel capable of bringing the patients some relief. Because many workers had abruptly lost their income, the government issued relief payments to households throughout the country. With many entertainment venues closed, many of us increased our rate of savings. Below is a graph of the quarterly change in the personal savings rate.
The savings rate shot up 15%, a historic rise. Even during the high inflation of the 1970s, the savings rate rose by only 2.5% in 1975. Such an abrupt change in savings did have an effect on prices. When the change in the savings rate is negative, people are buying stuff with their savings. Companies could take advantage of supply chain bottlenecks and raise prices. This helped make back what they had lost in profits in 2020. The quarterly change in prices began to rise, as the red line in the chart below indicates. Note that inflation is the annual, not quarterly, change in prices.
Look on the right side of that chart and you will see the blue savings line turning positive. A steadily higher savings rate should exert some calming effect on prices. I then ran a statistical regression on the annual change in both prices, i.e. inflation, and the savings rate for the past 35 years. The effect of a 1% rise in the savings rate is about a 1% decrease in the inflation rate and explains 21% of the movement in inflation.
What can you do with this information? Quick erratic changes in savings have an effect on prices. Immediately after 9-11 there was an abrupt rise and fall in savings but the change was much less than the pandemic shock, which was truly historic. In 2008 came another shock, an abrupt shift in savings and an accompanying rise in prices in the summer of 2008 before the Lehman meltdown in September and the economy tanked in the 4th quarter of 2008. These changes in savings rates don’t occur very often, but when they do we should pay attention.
This week’s letter is about household savings and corporate profits. As a share of GDP, savings are near an all-time low while profits are at an all-time high. Elon Musk, the CEO of Tesla, appeared in court this week. No, this wasn’t about his acquisition of Twitter. It concerned a shareholder lawsuit against Tesla regarding the $50B stock option package the company awarded him in 2018. In 2019 the company’s total revenue – not profit – was less than $25B. In 2022, annual revenue was $75B. At a 15% profit margin, the company must continue growing its revenue at a blistering pace to afford Mr. Musk’s incentive pay package. Large compensation packages like this are only a few decades old. Let’s get in our time machine.
In 1994, Kurt Cobain, the 27 year old leader of the rock group Nirvana, died from an overdose of heroin. Something else was dying that year – corporations were breaking free of national boundaries and moving production to countries other than their home nation. This was the last stage in the evolution of multinational corporations, or MNCs. In earlier decades, companies had licensed or franchised their brand. Perhaps they had set up a sales office in a foreign country. Now they were becoming truly global. Fueling that expansion was an increase in equity ownership by large institutional investors. To accommodate these changes, their governance structures changed. Executives capable of leading this global growth were rewarded on a parallel with superstar sports talent. That was the conclusion of Hall and Liebman (2000, 3), two researchers at the National Bureau of Economic Research.
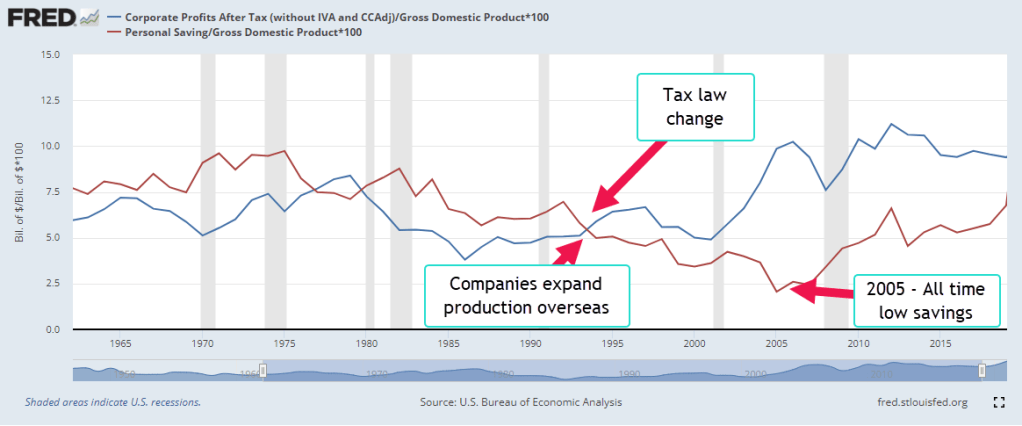
Let’s look at two series over the past sixty years – personal savings and corporate profits. If we think of a household as a small enterprise, personal savings is the residual left over from the household’s labor. Likewise, corporate profits are the residual left over from current production. In 1994, the two series diverged. Corporate profits (the blue line in the graph below) kept rising while personal savings plateaued for a decade. Each series is a percent of GDP to demonstrate the trend more easily.
Executive Compensation
In the mid-1990s, corporations began to issue a lot more stock options to their executives. Some think that a change in the tax code might have precipitated this shift in compensation. In 1994, Section 162m of the IRS code limited the corporate deductibility of executive pay to $1 million (McLoughlin & Aizen, 2018). By awarding non-qualified stock options to their executives, companies could preserve the corporate tax deduction. However, the slight tax advantage did not account for the rapid increase in options awards. Hall and Liebman found that the median executive received no stock option package in 1985. By 1994, most did. The tax change was secondary – a distraction. Institutional investors wanted more growth and more profits and companies were willing to reward executives with compensation packages similar to sports stars (Hall & Liebman, 2000, 5). Some of these superstars included Jack Welch of General Electric, Bill Gates of Microsoft, Michael Armstrong of AT&T.
Income Taxes – Less Savings
In 1993, Congress passed the Deficit Reduction Act that raised the top tax rate from 31% to almost 40%. Personal income tax receipts almost doubled from $545 billion in 1994 to almost $1 trillion in 2001. The booming stock market in the late 1990s produced big capital gains and taxes on those gains. For the first time in decades the federal government had a budget surplus. However, more taxes equals less personal savings so this contributed to the flatlining of personal savings during that period.
Household Debt Supports More Spending
During the 2000s, personal savings remained flat. On an inflation adjusted basis, they were falling. Too many people were tapping the rising equity in their home to pay expenses and economists warned that household debt to income ratios were too high. Savings as a percent of GDP fell to a post-WW2 low. As home prices faltered and job losses mounted in late 2007, people began to save more but their debt left them with little protection against the economic downturn. During 2008, personal savings began to increase for the first time in fifteen years. More savings meant less spending, furthering the economic malaise that began in late 2007.
Multi-National Corporate Profits
During those 15 years corporate profits rose steadily as companies increased their global presence. Beginning in 1994 U.S. companies began shifting production to Mexico where labor was cheaper. In 2001, China was admitted to the World Trade Organization (WTO) and production outsourcing continued to Asia. Despite the profit gains, companies kept their income taxes in check. In 2021, corporate income taxes were at about the same level as in 2004. That contributed to the rising budget deficit during the first two decades of this century.
Federal Deficit
The prolonged downturn in 2001-2003 and the financial crisis and recession of 2007-2009 put a lot of people out of work. This triggered what are called “automatic stabilizers,” unemployment insurance and social benefits like Medicaid, housing and food assistance. The federal government went into debt to pay for the Iraq War, pay benefits to people and help fill the budget gaps in state and local budgets. The tax cuts of 2003 enacted under a Republican trifecta* of government control reduced tax revenues, further increasing the deficit. During George Bush’s two terms, the debt almost doubled from $5.7 trillion to $11.1 trillion.
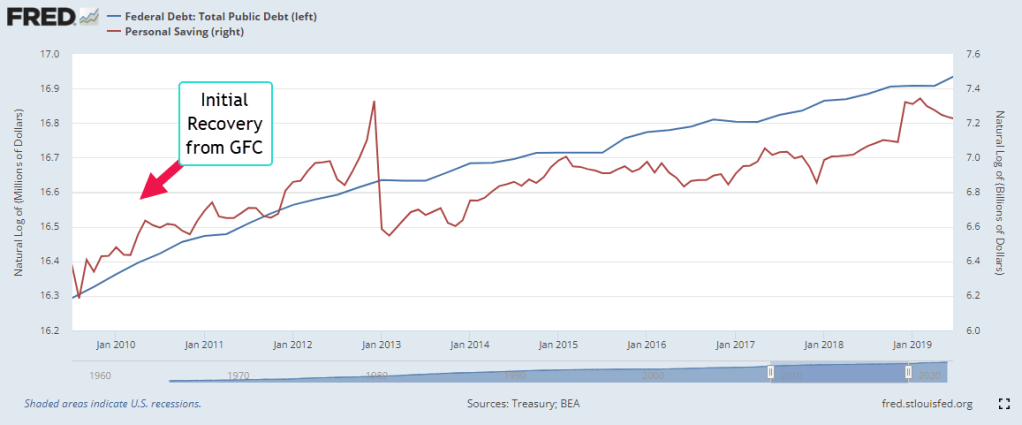
In coping with the recovery from the financial crisis, the government added another $8.7 trillion to the debt. That negative saving by the government helped add to the personal savings of households but too much was spent on just getting by. Following the Great Financial Crisis (GFC), the trend of the government’s rising debt (blue line below) matched the trend in personal savings (red). Sluggish growth and lower tax revenues caused the two to diverge. While the debt grew, personal savings lagged.
Before and During the Pandemic
Following the 2017 tax cuts enacted under another Republican trifecta, personal saving rose, then spiked when the economy shut down during the pandemic and the federal government sent stimulus checks under the 2020 Cares Act. In the chart below, notice the spike in debt and savings. By the last quarter of 2020, personal savings had risen by $600 billion from their pre-pandemic level of $1.8 trillion. In late December, President Trump signed the $900 billion Consolidated Appropriations Act (Alpert, 2022) but that stimulus did not show up in personal savings until the first quarter of 2021. In March 2021 President Biden signed the $1.7 trillion American Rescue Plan. Personal savings rose $1.6 trillion in that first quarter, the result of both programs.
After the Pandemic
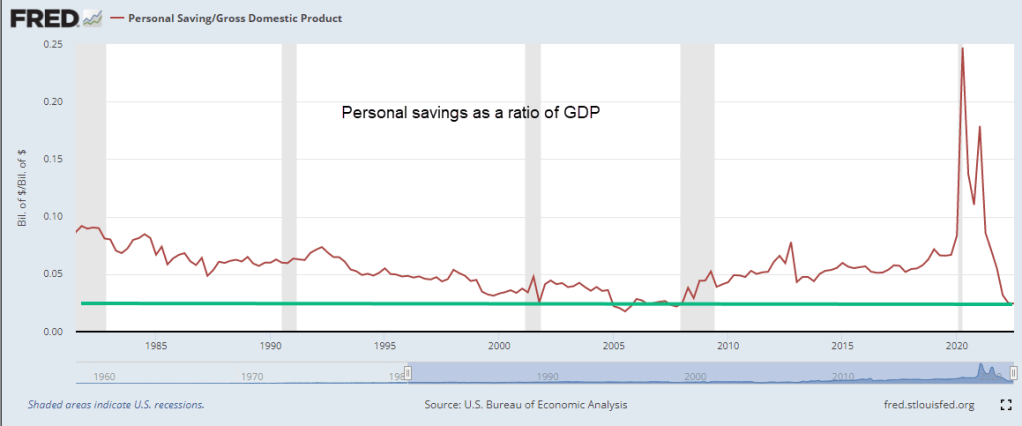
Some economists have said that the American Rescue Plan was too much. In hindsight, it may have been but we don’t make decisions in hindsight. As more schools and businesses opened up, households spent far more than any extra stimulus. They spent $1.2 trillion of savings they had accumulated before the pandemic and savings are now at the same level as the last quarter of 2008 when the financial crisis struck. Thirteen years of cautious savings behavior has vanished in a few years. On an inflation-adjusted basis, personal savings is at a crisis, almost as low as it was in 2005. In the chart below is personal savings as a ratio of GDP.
The Future
In the past year savings (red line) and corporate profits (blue line) have resumed the divergence that began almost three decades ago. Profits were 12% of GDP in the 2nd quarter of 2022. Savings is near that all time low of 2005. Rising profits benefit those of us who own stocks in our mutual funds and retirement plans. However, the divergence between the profit share and the savings share is a sign that the gap between the haves and the have-nots will grow larger.
Hall, B. J., & Liebman, J. B. (2000, January). The Taxation of Executive Compensation – NBER. National Bureau of Economic Research. Retrieved November 19, 2022, from https://www.nber.org/system/files/chapters/c10845/c10845.pdf. Interested readers can see Moylan (2008) below for a short primer on the recording of options in the national accounts. Until 2005, these options were recorded as compensation for tax purposes but not recorded on financial statements so they did not initially affect stated company profits.
July’s employment survey (BLS, 2022) reported a half-million job gains and marked a milestone – the recovery of all the jobs lost during the pandemic. In addition, earlier employment gains were revised higher by 28,000. The BLS survey indicated that only 7.1% of employees worked remotely, a surprising contrast to the amount of attention that the media gives teleworking. Last week, I discussed the dating of recessions. With this report, it is unlikely that the dating committee at the NBER will dub this a recession. Consumption, income, employment and investment are the pillars of this economy and they are doing well, contributing to the current inflationary trends.
Annual gains in private investment topped 18% in the second quarter, besting the 16% gain in 2012:Q1 a decade ago (series notes at end). Businesses invest in people, driving up employment gains. In the graph below, I multiplied the annual gain in employment by 4 to show the correlation between investment and employment.
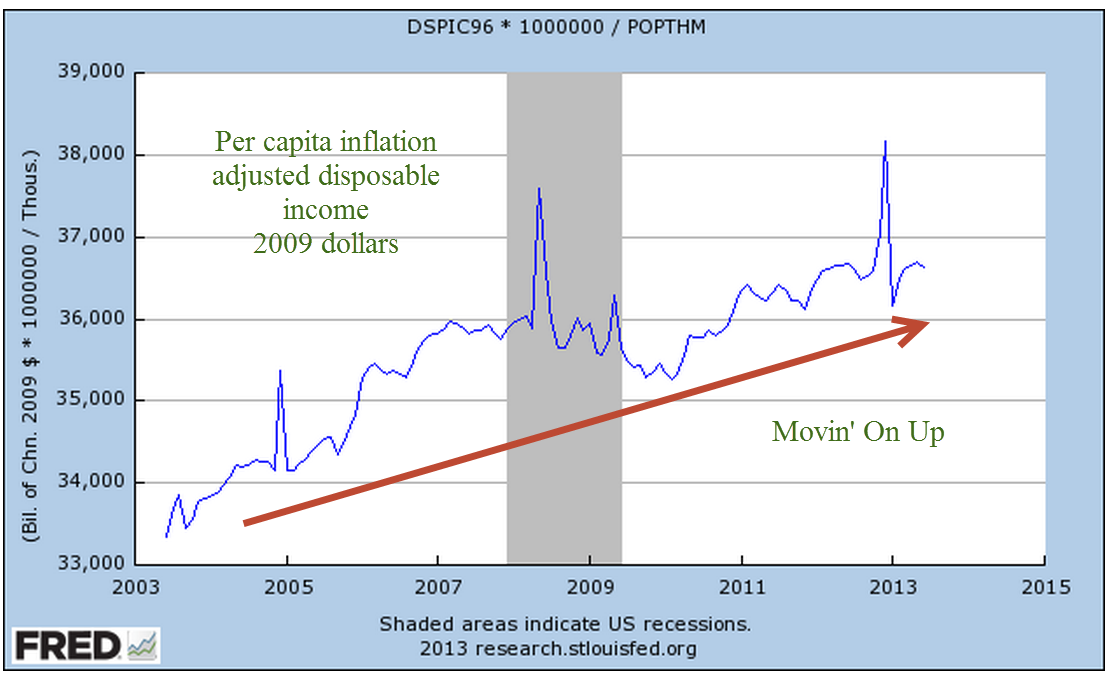
Higher employment leads to higher incomes. Just as employment has returned to pre-pandemic levels, real (inflation-adjusted) disposable incomes are now at pre-pandemic levels. Disposable income includes government transfers like social security and pandemic stimulus checks. The last stimulus checks went out in March/April 2021, more than a year ago. It’s a good bet that these are sustainable income numbers produced by economic growth, not the result of special transfer payments.
Higher incomes lead to higher spending. Real (inflation-adjusted) consumption spending marked an annual gain of 1.57% in June and is now up 4.5% over pre-pandemic levels. Consumers have made an abrupt shift from buying goods to buying services. Real sales at restaurants are now 10% above pre-pandemic levels.
To keep up with high demand for goods and clogged shipping ports during the pandemic, Target and Wal-Mart ordered extra and now have more inventory than they would like. Their loss is the travel and leisure industry’s gain. Marriott Hotels (2022) reported a surge in demand this year. In the U.S. and Canada, their leisure traffic is 15% above pre-pandemic levels and their revenue per room is about the same as in 2019.
Higher incomes usually lead to higher savings. In the decade before the pandemic, households saved 6-7% of disposable income. In 2020 and 2021, the savings rate averaged a whopping 20% and 12%. Most of that higher savings was done by households with higher incomes. Congress could have passed a CARES act that sent stimulus payments only to those with lower incomes, but they chose not to. Those additional savings became investment and that brings us full circle to the higher investment and employment – a virtuous cycle that Adam Smith wrote about more than two hundred years ago.
U.S. Bureau of Economic Analysis, Gross Private Domestic Investment [GPDI], retrieved from FRED, Federal Reserve Bank of St. Louis; https://fred.stlouisfed.org/series/GPDI, August 5, 2022.
U.S. Bureau of Economic Analysis, Real Personal Consumption Expenditures [PCEC96], retrieved from FRED, Federal Reserve Bank of St. Louis; https://fred.stlouisfed.org/series/PCEC96, August 4, 2022.
U.S. Bureau of Economic Analysis, Real Disposable Personal Income [DSPIC96], retrieved from FRED, Federal Reserve Bank of St. Louis; https://fred.stlouisfed.org/series/DSPIC96, August 4, 2022.
U.S. Bureau of Economic Analysis, Personal saving as a percentage of disposable personal income [A072RC1Q156SBEA], retrieved from FRED, Federal Reserve Bank of St. Louis; https://fred.stlouisfed.org/series/A072RC1Q156SBEA, August 4, 2022.
U.S. Census Bureau, Advance Retail Sales: Food Services and Drinking Places [RSFSDP], retrieved from FRED, Federal Reserve Bank of St. Louis; https://fred.stlouisfed.org/series/RSFSDP, August 5, 2022. Note: I adjusted for inflation using the CPI.
U.S. Bureau of Labor Statistics, All Employees, Total Nonfarm [PAYEMS], retrieved from FRED, Federal Reserve Bank of St. Louis; https://fred.stlouisfed.org/series/PAYEMS, August 5, 2022.
Economists study individual and group human behavior as we try to satisfy our needs. Sometimes the sum of the quests for individual satisfaction produces an outcome that is unexpected or contradictory to the aims of each individual’s choices. People may synchronize their behavior to a point that their accumulated actions overload a system, causing it to become dangerously unbalanced and lead to a collapse. Our modern communication systems may introduce more frequent panics, more opportunities for reactionary zeal and anger.
During the Great Depression, the economist John Maynard Keynes proposed a Paradox of Thrift. Saving money is a prudent choice for each person but if too many people decide to save money at the same time, economic activity declines. An extreme example is the 2008 financial crisis and recession when millions of people decided to curtail their current spending, the blue line in the graph below, and increase their savings. This is the power of uncoordinated expectations. We act sometimes as if our actions were being choreographed.
These paradoxes introduce contradictions that challenge our assumptions and ideologies and cause a lot of disagreement among economists and the public. In an EconTalk (2009) podcast, economist Steve Fazzari explained the immediate consequences of the Paradox of Thrift. In an effort to save money for college, a family foregoes their weekly meal out at a nearby restaurant. At the first occurrence, the family saves money which they deposit in a bank savings account. The next day the restaurant owner must withdraw that same amount from the restaurant’s savings to make up for the lost revenue. In that immediate time frame, there is no increase in savings/investment and this violates the ideologies of some listeners. As the pattern continues, the restaurant owner will adjust her expectations for revenue and lay off some workers. The podcast listeners interpreted Fazzari’s analogy in several different ways. They could not agree on what a short time frame is or the scope of the story.
We see and hear words and events differently yet sometimes respond in a seemingly coordinated fashion. Our panicked response may cause or amplify the very thing we fear. In September 2008, banks and investment firms lost trust in the soundness of each other’s assets. The loss of confidence caused the value of those assets to plummet, actualizing the fear. The Fed and central banks around the world struggled to contain the panic as the global financial system seized up like an engine without oil. In March 2020, central banks were better prepared, flooding the markets with liquidity at the onset of the Covid-19 pandemic. Still we swarmed onto the streets, emptying shelves of merchandise ahead of lockdowns.
Every culture has its account of the consequences of humankind’s hubris, a lesson in the perils of our own arrogance. The Bible accounted for the variety of languages with the story of the Tower of Babel. Our phones connect us to the information hive, instantly relaying breaking news in our language of choice. The internet brings us together and drives us apart. As our communications become more rapid and extensive, we increase the likelihood of global panics, an unplanned reaction to some event. Fringe groups become more adept at coordinating their anger and actions like they did at the Capitol on January 6th. Our culture evolves with our technology but our laws are slow to adapt. Our mechanism of lawmaking, adapted to a horse and buggy age of communication, will have to be redesigned before it breaks apart our society, our culture and our union.
Two billionaires, Warren Buffett and Elon Musk, pause before the packaged meat in a grocery store. This past week the price of rib eye steak, their favorite, has gone up a lot. Elon has had a busy week and wants a good rib eye so he picks out a steak and puts it in his basket. Warren would also like a rib eye but can’t bring himself to spend that much on a meal he will cook at home. He decides to buy the top sirloin and marinate it for a few hours. For whatever reason, Warren has reacted to a rise in the price of one good by substituting another good. Economists call this the substitution effect.
The next day Mary is shopping at that same store for a top sirloin steak for dinner. She notices that a few rib eye steaks are on sale for half-price. The expiration date is the next day but she intends to cook it that night so that is not a concern. Just as Warren did the previous day, Mary has responded to a price change by substituting one good for another. What about Elon? His response was to pay the higher price, substituting a different good, his income, for the higher price. Economists call this the income effect, where we substitute money for the higher price. Where does the money come from?
One source is savings, our backup income stream. Savings is the amount of income we have left over after paying taxes and buying stuff. It’s the money we didn’t spend before. After age 40, we become more conscious of the need to save for the later years in life when we stop working. Here’s a chart of per person savings for those over the age of 55. This does not include the equity that people have built up in their homes or investment accounts, but it does show broad trends.
The first of the Boomer generation turned 55 in 2001, a tumultuous year marked by the 9-11 attack, the dot-com bust and the buildup to the Iraq war. During the 2000s, economists and financial advisors warned that the Boomers had not saved enough. The Boomers complained that higher payroll taxes (Tax Policy Center, 2019), used to support earlier generations who had not paid in enough to Social Security, had reduced their ability to save. When the financial crisis reduced the value of both homes and investments, Boomers realized that their savings were too low. During the following decade, many worked past retirement age. Cautious spending by this age group restrained economic growth following the crisis and kept inflation in check during the recovery.
In the spring of 2020, Covid hospitalizations and death shot up in New York City and other urban hotspots. The Trump administration shut down most of the economy for several weeks. Congress and the administration passed emergency measures to provide relief to people who had lost their jobs. Savings shot up and incomes dropped. The pattern for all adults was the same as for older Americans.
As stores reopened and the economy recovered, it was inevitable that some of those savings would be drained away to buy stuff. The abrupt decline in savings has put pressure on prices. Are inflationary pressures temporary or more permanent? Older generations have built up a reserve buying power that they did not have at the onset of the financial crisis twelve years ago.
There are 70 million Boomers who are spending down their accumulated savings. The Millennial generation, now 72 million strong, is the counterbalancing force to that dis-savings. Older Millennials are crossing the age-40 threshold when people start thinking that they had better put something away for the future. This tug of war in spending and savings between these two generations could continue to put upward pressure on prices for several more years.
During this pandemic, the Federal Reserve has been supportive of the asset markets and the government’s stimulus and relief programs. It’s immediate response was to lower interest rates, a boon for home buyers. This week we learned that home sales had rebounded 25% in July and are up 7% over last year at this time. Low interest rates have benefited homebuyers but penalized savers and pension funds who must generate a current income flow from their savings base.
During the 1930s Depression, the economist John Maynard Keynes argued that, because people want to hoard during a downturn, a central bank should maintain an interest level sufficient to induce people to deposit their money in banks (Keynes, 1936). Government-insured savings accounts helped solve that confidence problem. Keynes’ language and sentence construction are laborious, leading some people to think that Keynes argued for a policy of ultra-low rates during economic declines. He did not. Low interest rates are not a Keynesian solution.
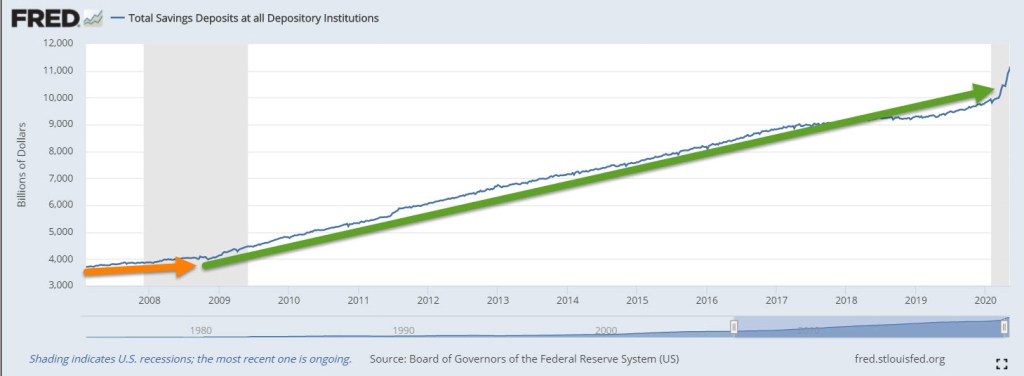
Despite the low rates, the amount of savings has doubled since the financial crisis in September 2008. There is a distinctive change in savings behavior at that important point.
With a savings base of $11 trillion, every 1% decrease in interest rates is a transfer of income of $110 billion from savers to borrowers. Who is the largest borrower? The government. Aren’t low interest rates good for businesses? No, Keynes argued rather unartfully in Chapter 15. Borrowing is a long-term decision, and subject to error. When interest rates are particularly low, like 2%, there is no wiggle room for error in the expectations of businesses who might borrow. For homebuyers, expectations of future business conditions are a small factor.
During an economic decline, people and businesses are guided more by short-term decisions. When interest rates are low like today, banks don’t want to lend because they aren’t confident in the flow of deposits to maintain their liquidity. Banks need that flow of deposits to meet the outflow of money when they make loans (Coppola, 2017). Entrepreneurs are reluctant to borrow for expansion because they are not confident in the accuracy of their long-term expectations. They borrow to pay back more predictable future obligations, particularly current and future stock grants to their key employees. Borrowing money to fund stock grants does not create jobs but helps inflate stock prices.
Keynes badly underestimated the political forces that guide a central bank’s decision making. As it did a decade ago, the Federal Reserve has lowered interest rates to near-zero, the opposite of Keynes’ prescription. Low interest rates do not benefit bank stocks, which have declined by 25% and more. A select group of technology stocks are booming as people consume more digital services at work and play. Borrowing by businesses jumped in response to the CARES act but many businesses kept those borrowed funds liquid to avoid insolvency during this crisis. We can expect slow growth as consumers and businesses continue to make short-term decisions, and asset markets are warped by central bank policy.
A few weeks ago (here) I wrote about trends in income growth and the difficulties of measurement because the growth of employee benefits and insurances are not included. As a follow up, I thought I would show you a chart of per capita income using a natural log scale, which shows a growth trend more clearly. In the graph below, we can see three distinct periods of growth:
1) the late 1960s through the mid-1980s, a period of strong growth following WW2; 2) a more moderate period of growth from the mid-1980s to the mid-2000s; and 3) a much more muted cycle of growth after the financial crisis and recession of 2007-2009.
On the right hand scale is the natural log of the Employment Cost Index, an index of total employee costs calculated quarterly by the BLS. This series is only sixteen years old but it does show the steep growth of these hidden costs.
Our government at all levels chooses to pay for social programs by sliding the costs under the rug. Politicians could tax everyone for the dozens of social support programs but Americans do not like paying taxes. As a rule, Europeans are more willing to make sacrifices for programs that benefit the group, although attitudes are changing as European populations become more diversified. People in general are less willing to pay into the group kitty when a society is less homogenous.
In America, there are fewer protests when politicians add program costs to the total value of a paycheck where employees do not see most of the costs. Workmen’s compensation insurance is a good thing but would voters be willing to pay 5% of their pay for it? Maybe not. The law is written so that the employer pays it and the employee never knows the amount.
The cost for workmen’s comp may be 10-20% or more in service and construction trades but only 1% for an office worker. Some people argue that such a disparity is appropriate; those who work in more dangerous jobs pay more into the insurance system. Employers are incentivized to create a safe environment for their workers in order to reduce costs.
On the other hand, the health of workers is a public cost. If all employees were taxed equally, the danger premium would be spread evenly across all employees.
//////////////////////////
Savings Glut
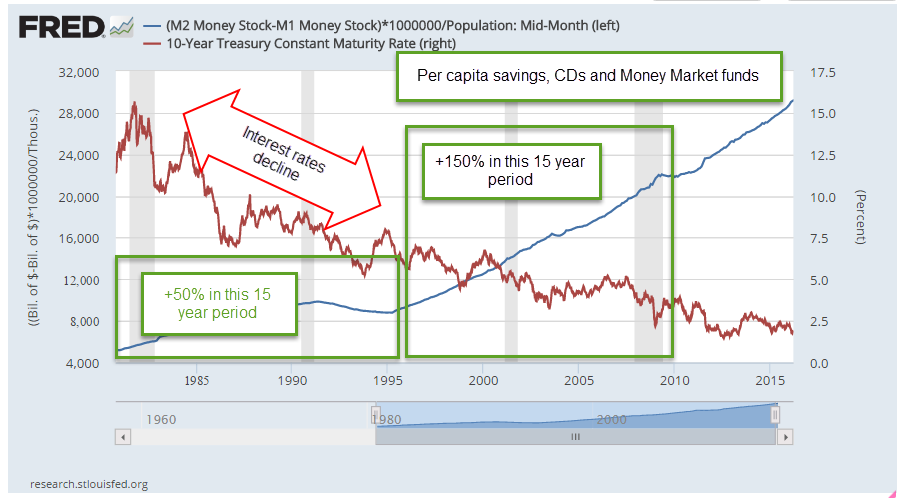
Interest rates are near zero. One year CDs from major banks pay 1% or less. Interest rates have been falling since the early 1980s when savings accounts were earning an astronomical 12% or so. Interest rates are a price of sorts, the price a bank is willing to pay for someone’s savings. Lower interest rates = lower price = less demand for savings. So, people will respond to that lowered demand by putting less money in savings accounts and CDs, right? Wrong.
As interest rates decline, people actually increase the supply of savings they want to give to banks. Why? It seems counterintuitive till we take into account that the population is aging, and older people tend to get more conservative with their savings. Secondly, a larger pool of savings is needed to earn the same interest income.
So we would expect that “safe money” savings would increase somewhat in the past decade. However, the difference in the amount of savings is dramatically higher. In the 15 year period from 1980 to 1995, Money Market, savings accounts, and CDs grew by 50% per person. In the subsequent 15 year period from 1995 to 2010, safe savings grew by 150%, triple the increase of the previous fifteen year period.
By keeping interest rates low, the Federal Reserve is trying to force the public to take more chances with their money. Like the mule who resists going down a steep path in soft dirt, the American public stubbornly refuses to go where the Fed wants. It may take at least another ten years before Americans forget the financial crisis and are willing to take on more risk. The slow growth of this seven year recovery will persist until Americans lose their aversion to risk.
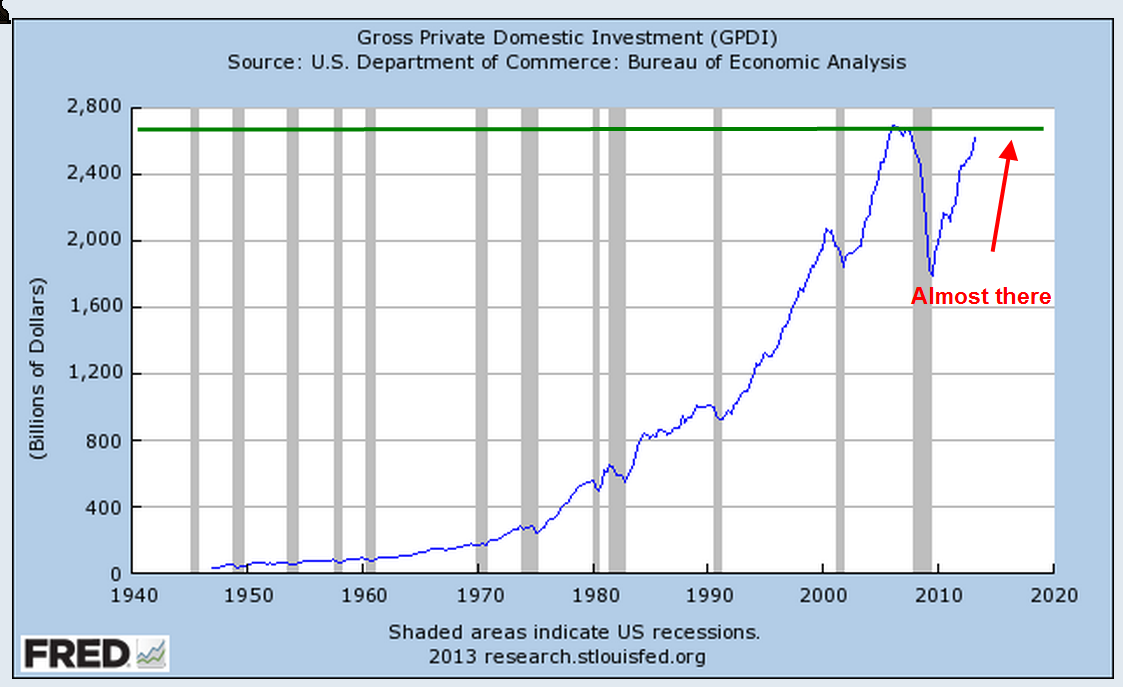
Gross Private Domestic Investment (GPDI) consists of capital spending on factories and equipment, improvements in rental properties, and changes in inventory. Changes in GPDI reflect expectations by the business community. Companies and landlords continue to increase investment after the precipitous fall of 2008. Below is the long term view.
Let’s zoom in on the past five years to show some comparisons. In 2010 there was a slight decline in investment. In 2011 and 2012 came short periods of a levelling off of investment. So far this year, the trend is upward.
l
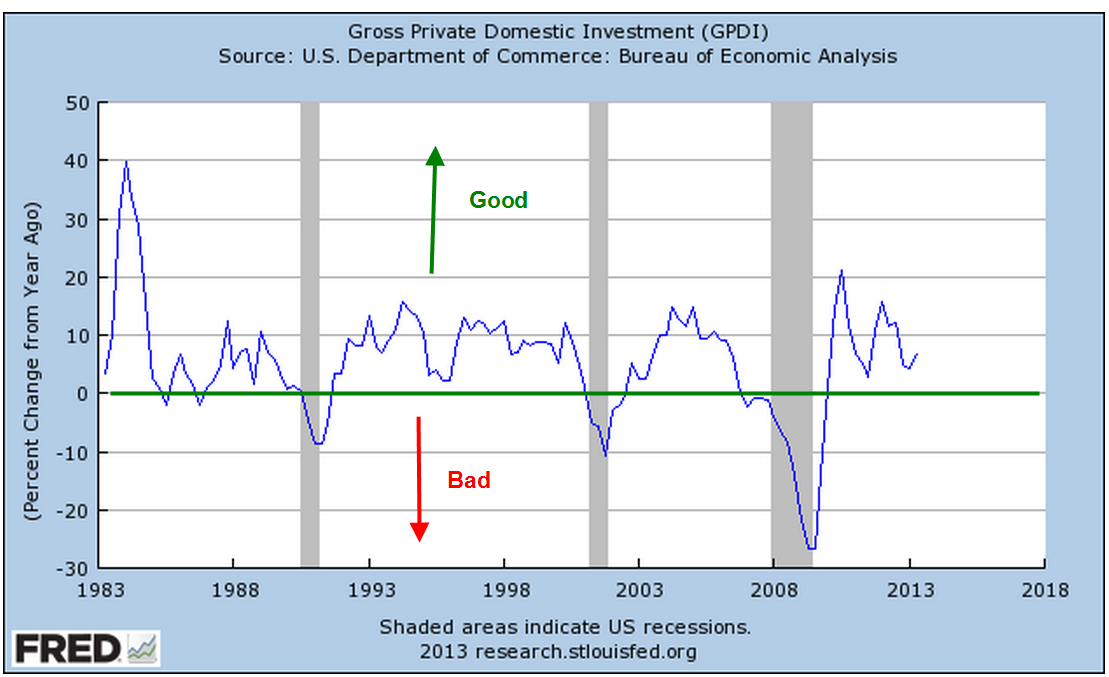
Declines in investment accompany recessions but do not consistently precede recessions. However, declines in the year over year (y-o-y) percent change do signal an aggregate caution among businesses. The attentive investor would do well to notice these signals. Investment growth remains positive.
Percentage changes in investment and the market loosely track each other, as we can see below. Both investment and the market ride on anticipation of future business conditions but the market reacts and overreacts much more than investment. I dampened the percent change of the market to show a bit more clearly both the correlation and the divergences.
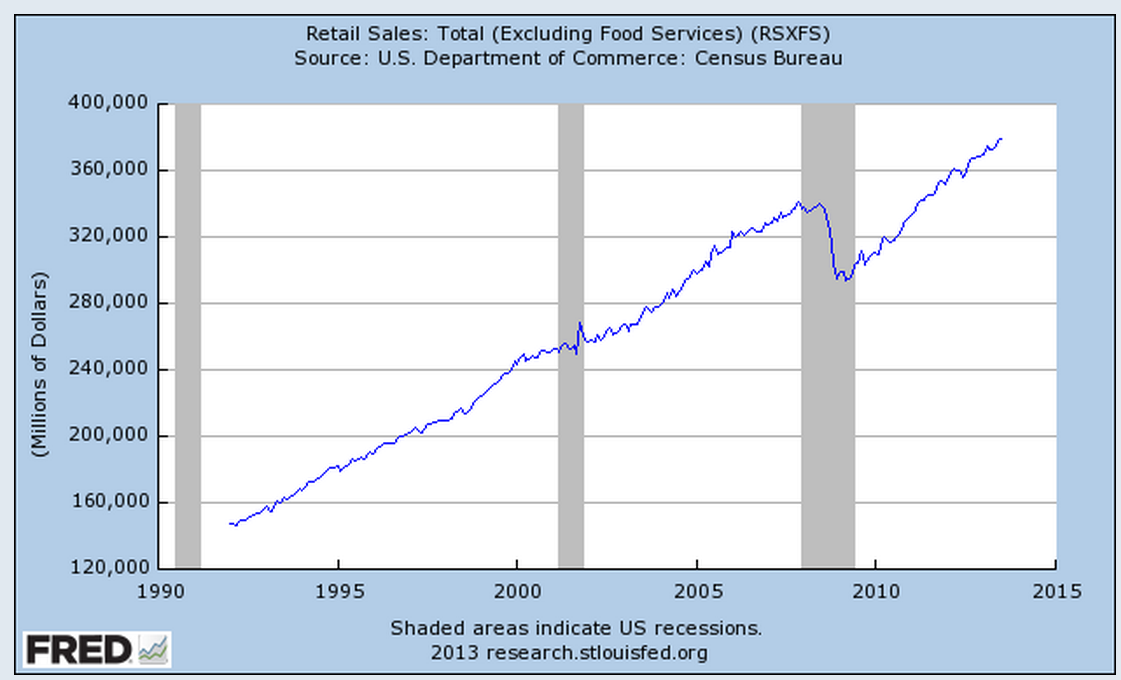
The y-o-y gain in investment has been positive since the latter part of 2009, indicating that business owners and managers have enough confidence in future business to increase their investment. A key component of the business landscape is the willingness of consumers to buy. This past Tuesday came the monthly report on Retail Sales showing a .2% monthly gain for total retail sales, including food services. At an annualized growth rate of 2.4%, sales are positive but annualized gains of 3% or more would indicate strong consumer demand. So far this year, earlier forecasts of negative real retail sales growth in response to sequestration policies have proved unfounded. Below I’ve excluded the food services component which accounts for approximately 10% of retail sales.
When we look at retail sales as a percent of GDP, the total economic activity of the country, retail sales excluding food is still below 20 year averages.
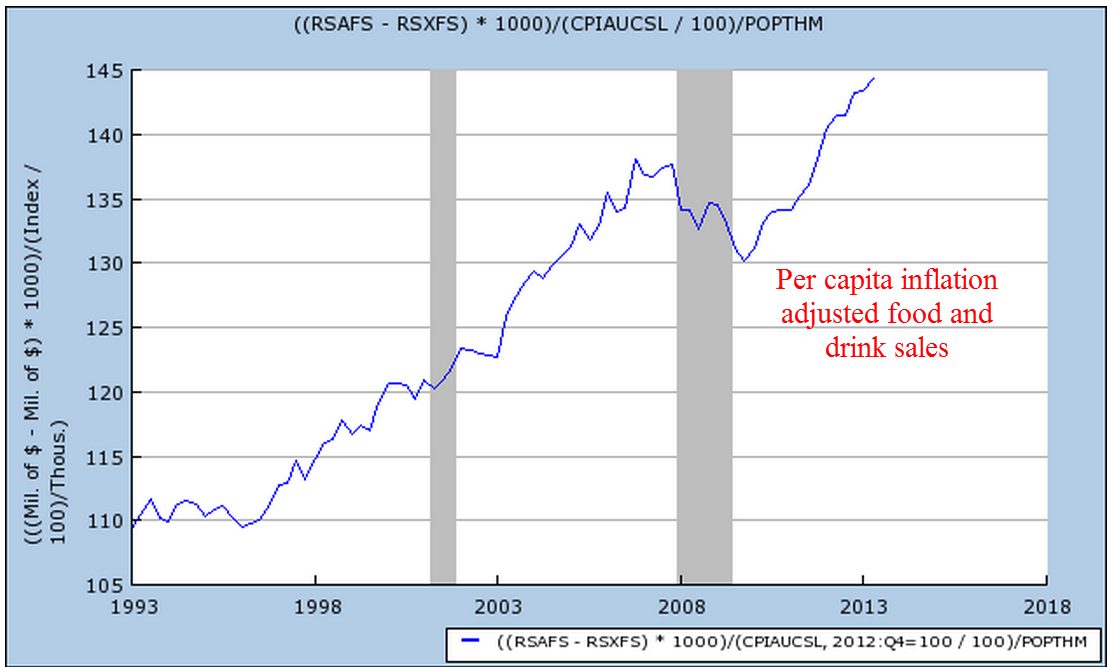
Adjusting for inflation and population, we can see that it is food services that continues to show strong growth over a two decade period. While the recession put a dent in that growth, it is more than 25% higher than it was two decades ago.
Each month the U. Of Michigan releases a consumer sentiment survey. This past Friday’s report showed a surprising fall in sentiment from 85 to 80.
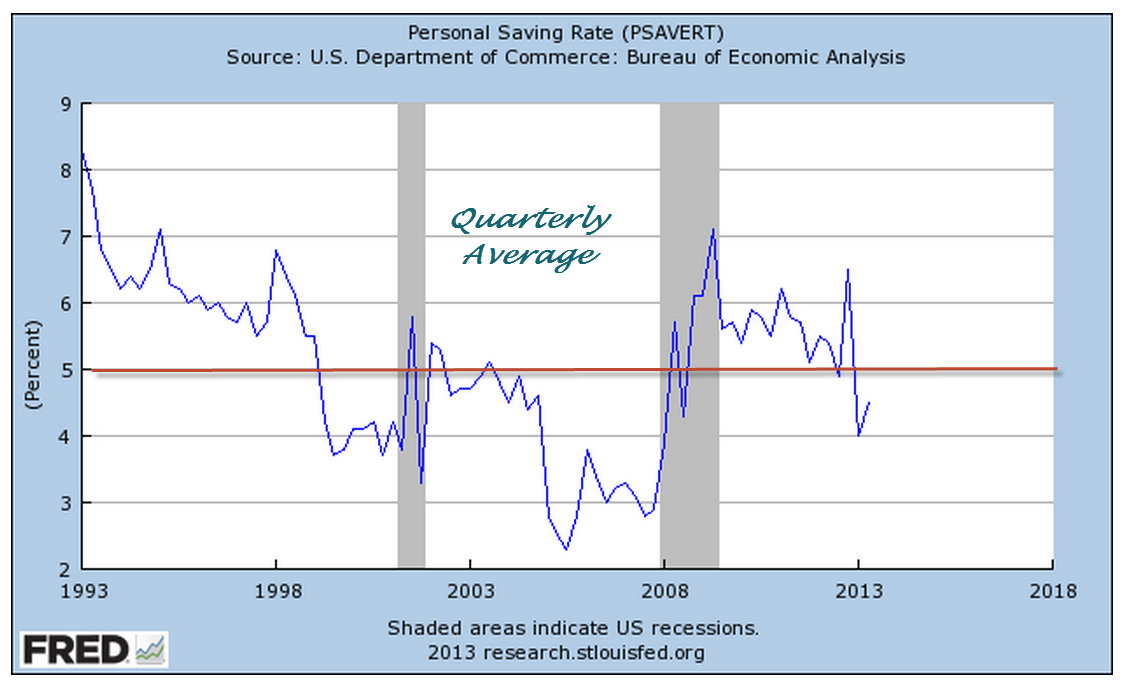
In the U.S. we can take a rough reading of the willingness of consumers to spend by looking at savings patterns – we don’t save as much.
We are down below a 5% savings rate again, indicating that people are confident enough to spend most of their income. That is one reading. Another is that many households have responded to the increase in the Social Security tax this year by reducing their savings. The lack of savings by Americans has a long history. Before the Social Security Act was passed in the 1930s, George Washington Carver wrote: “We have become ninety-nine percent money mad. The method of living at home modestly and within our income, laying a little by systematically for the proverbial rainy day which is due to come, can almost be listed among the lost arts. ” Perhaps that is why some felt that Americans had to be put on a mandatory retirement program called Social Security.
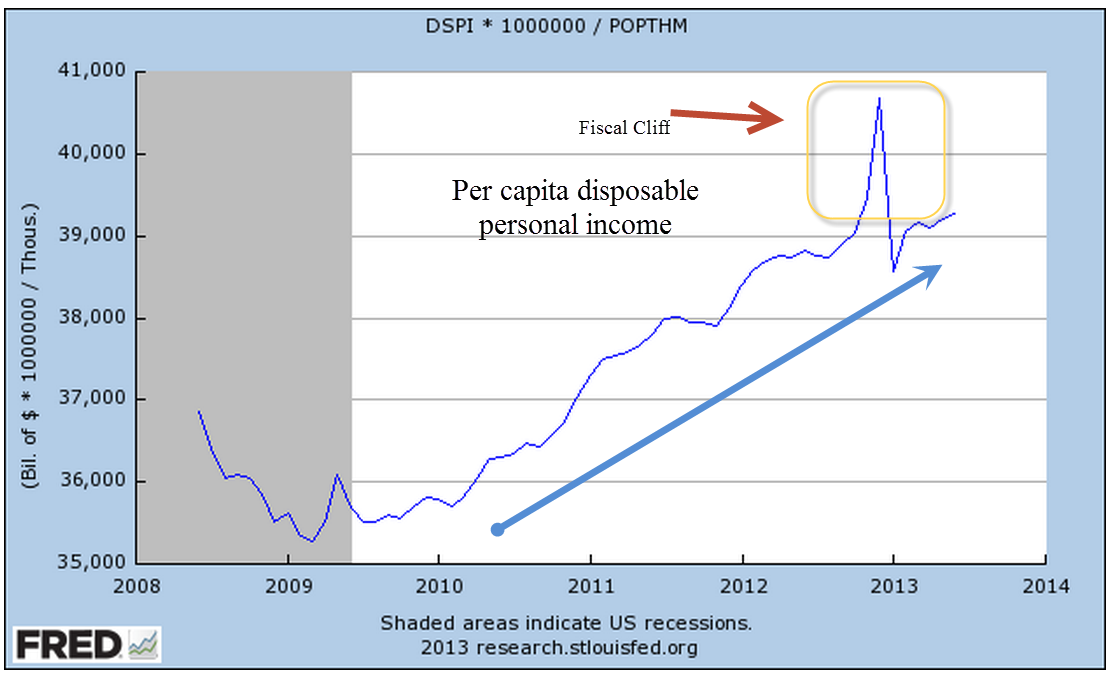
The upward spike in savings at the end of 2012 has been attributed to higher dividend payouts and bonuses in anticipation of the “Fiscal Cliff” in 2013. Per capita Disposable Personal Income continues its subdued but steady march upward, also rising dramatically in the last part of 2012 as a one time anomaly before the onset of higher taxes and sequestration.
On an inflation-adjusted basis, we are 10% higher than we were ten years ago.
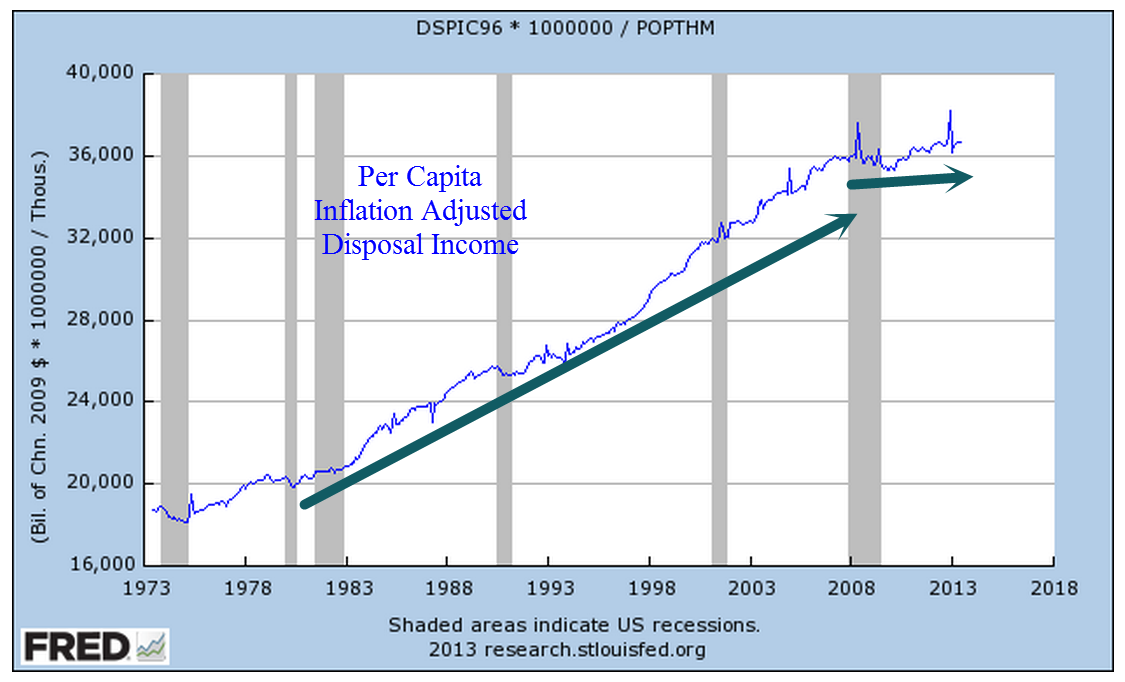
But a longer term picture is a bit more sobering. The decades longs rising trend of real income has clearly plateaued since the recession began at the end of 2007, over five years ago.
The recession has been a sobering experience for everyone, including the business community. While the growth signs are mildly positive, an underlying watchfulness seems to be the order of the day.
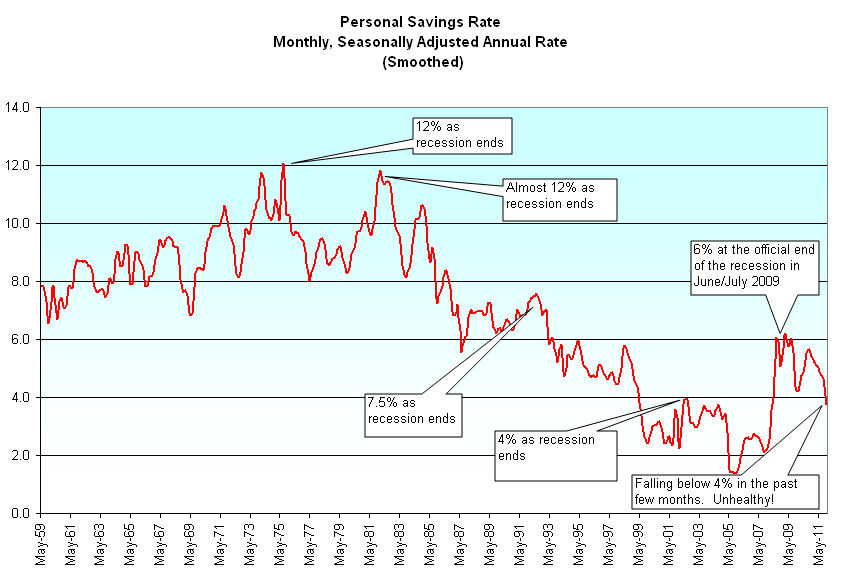
The Bureau of Economic Analysis (BEA) keeps track of our “piggy banks” in a metric called the Personal Savings Rate (PSR). This is a measure of disposable income less spending on consumption items. The rate is a percentage of savings to disposable income. Below is a graph of the past 60 years, showing the steady decline in personal savings that began in the 1980s. (Source)
The stock market has cheered the recent rise in consumer confidence and spending but – a word of caution. As the graph shows, the PSR was at 4.7% in December 2011. This past Friday, the BEA reported that the PSR had declined to 4.3% in January and declined again in February to 3.7%. In real inflation-adjusted dollars, personal incomes declined slightly at the beginning of this year, making it doubtful that the recent rise in consumer spending can be sustained.
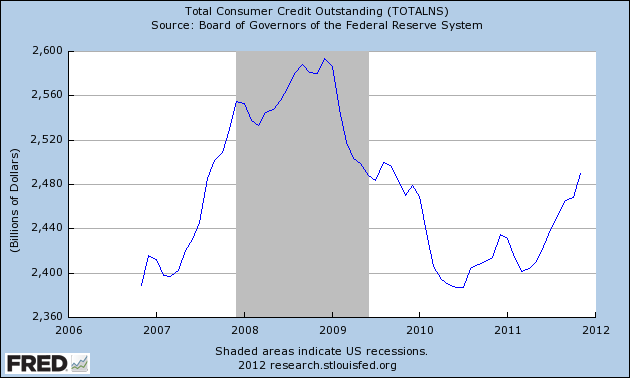
Last week the Commerce Dept reported that consumer credit had grown in November at an annualized rate of 10%.
The growth consisted mostly of car and truck sales, which shows increasing confidence and pent up demand.
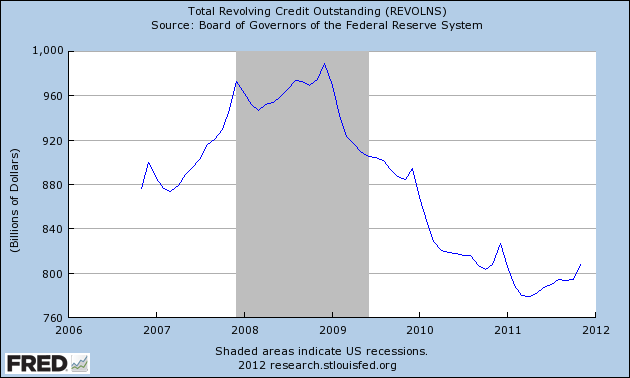
Below is a chart of revolving credit outstanding which excludes auto sales. As we can see, the American consumer is still struggling.
Taking a longer perspective, let’s look at the personal savings rate for the past 50 years. The savings rate is calculated by subtracting all personal consumption expenses, including interest, from disposable personal income (gross income less taxes).
The savings rate shows the underlying resilience – or lack of it – of the average American household. Savings helps fuel investment in companies, investment in local, state and federal government bonds. As our savings fall, we become ever more reliant on foreign money to fuel this country’s debt and growth.