Taxes and Investment

March 17, 2024

by Stephen Stofka

This week’s letter is about the effect of tax revenues on government, on the economy and the role that taxes play in our lives. Tax revenues are the income of a government at all levels – federal, municipal and state. Those revenues fund the courts and prisons, the police, the roads and cultural institutions that connect people together, yet no one wants to pay them. The essence of a tax is a private payment for a public benefit. Few object to the opposite, a public payment for a private benefit when they are on the receiving end of such a subsidy.

Regardless of the amount that people pay in taxes, they feel that they have a right to complain about any good or service that a government provides. It’s in the Constitution. First Amendment – freedom of speech. For those who work in a democratic government, the unpopularity of taxes presents an existential conflict. Paul Samuelson (1947) pointed out the difficulty of designing a purely lump-sum tax or subsidy. A lump-sum tax is like a head tax, a fixed amount of tax regardless of a person’s circumstances. Under such a system, the wealthiest and poorest person pay the same amount of tax. This violates a sense of proportionality that is a guiding ethical principle.

A fixed single rate of tax answers concerns of proportionality. As an example, many districts enact a set rate for residential real estate. However, states have been reluctant to adopt a single or flat rate of income tax. In 1987, Colorado was the first state to adopt a single tax rate, according to the Tax Foundation. Other states were slow to follow Colorado’s lead and less than a quarter of the states have adopted a flat tax rate. Revenue and proportionality are not the only concerns. By its nature, a democratic government is not fair. People elect representatives who will maximize their benefits and minimize their taxes. Politicians naturally want to lighten the tax load of regular voters. In a flat tax system like the one in Colorado, politicians have amended the definition of taxable income to benefit some taxpayer groups at the expense of other groups. Pension income like Social Security and state retirement plans is not subject to state income tax.

The federal government and the majority of the states enact a graduated income tax that penalizes effort at the margin. An employee who works an occasional day of overtime may be surprised by the additional taxes taken out of that additional pay. Payroll software treats that extra amount as though the employee worked overtime every week, increasing the annual income used to calculate the tax rate on that additional income.

Republican politicians routinely champion their principle of low taxes. The justification for the tax cuts in the 1980s was based on an idea put forth in 1974 by the economist Arthur Laffer who drew an inverted curve on a napkin to illustrate the idea that higher tax rates might lead to lower tax revenues. Despite repeated evidence that lower tax rates lead to lower tax revenues, Republicans have clung to the idea. In the graph below, I have charted federal tax revenues as a percent of GDP. They do not include Social Security taxes.

According to the theory behind the Laffer Curve, lower taxes should spur more investment, more output, higher incomes and higher tax revenues. As we see in the graph above, tax raises led to higher revenues soon after they were enacted. Tax cuts did not. Believers in the theory claim that the cuts can take several years to work but this makes it hard to identify causality. In the graph below, I have added in investment as a percent of GDP.

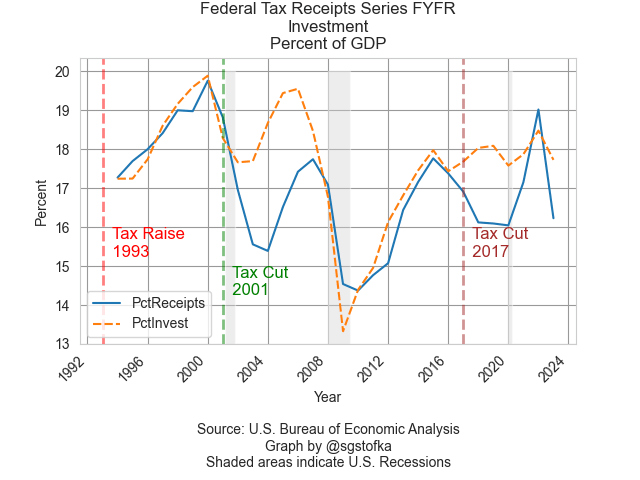
The Bush tax cuts in 2001 certainly helped arrest the decline in investment following the “dot-com bust.” However, too much of that investment went into residential housing and led to the housing boom that preceded the financial crisis. Those tax cuts expired in 2010 and both investment and tax revenues improved. That raises the question: did higher taxes in 1993 and 2010 produce more investment? On principle, it seems unlikely. Following the 2017 tax cuts known by their acronym TCJA, investment again reversed a decline but had little effect on tax revenues. The rise in revenues as a percent of GDP was due to the fall in output as a result of the pandemic.

According to the neoclassical economist’s narrative, savings provide the source of investment. Taxes reduce savings and therefore reduce investment. Italian economist Pietro Sraffa (1932) reiterated a point made by Sir Dennis Robertson that savings were an inducement to more investment as well as a source of investment. Investment occurs in the period before consumption. People have money to save for two reasons. The first is that their incomes increase from new investment in production. Secondly, there are not enough goods in the marketplace to induce them to spend that extra income. The mismatch in supply and demand gives companies pricing power. Investors rush in to take advantage of the additional demand and the flow of new savings gives banks the confidence to make more loans.

For the past thirty years, federal revenues excluding social security taxes have averaged 17% of GDP. For that same period, the government spent 18.6% of GDP. The deficits have been persistent because the federal government consistently spends more than it taxes, an analysis confirmed by the Congressional Budget Office in a recent report. Republican lawmakers try to choke tax revenues to “Starve the Beast” – the beast being the size and reach of the federal government. To Democratic policymakers, our society needs constant remodeling, so they always have a plan for extra tax revenue. Neither party seems willing to resolve this political push-me-pull-you and the public has become used to deficits. There is always one more war to fight, one more wrong to right.

/////////////////

Photo by Kelly Sikkema on Unsplash

Keywords: tax cuts, investment, taxes

Samuelson, Paul Anthony. (1947). Foundations of Economic Analysis. Harvard University Press.

Sraffa, P. (1932). Dr. Hayek on money and Capital. The Economic Journal, 42(165), 42. https://doi.org/10.2307/2223735

Experimental Philosophy

March 21, 2021

by Steve Stofka

At a Senate Banking Committee hearing this week Senator Tim Kane presented a comparison of two philosophies of governing. Without any Democratic support, Republicans passed the Tax Cut and Jobs Act (TCJA) in December 2017. Prior to its passing, the non-partisan Congressional Budget Office estimated the loss of revenues at $1.5T over ten years. After two years of data, they revised their estimate of lost revenue to about $1.8T. The bulk of the benefits go to the top 20% of incomes. Without any Republican support, Democrats passed the American Rescue Plan (ARP) two weeks ago. Its estimated cost is $1.9T over ten years. This bill will benefit the bottom 60% of income earners. Two plans, two philosophies, similar costs.

Tim Kane suggested that we are having a real-world experiment. Both laws are projected to cost the same amount. Economists already have performance metrics on the Republican law from 2018-2019, the two years before Covid.  In 2023, economists can compare performance and benefits of ARP which exemplifies the Democratic philosophy.

The essence of the Republican philosophy is an assumption that income and benefits will “trickle down” from the top 20% of income earners, the wealthy in America. After three decades of Republican rhetoric that income should trickle down, many economists find the opposite trend. Those at the top get wealthier.

The Gini coefficient is a measure on equality/inequality. 0 represents perfect equality, 1 represents perfect inequality. In 1972, the Gini coefficient for household income in the U.S. was .4. In the fifty years since, that coefficient has risen to .48 (FRED Series GINIALLRH), near the mid-point of the equality/inequality range. An economic analysis can only confirm what many Americans sense intuitively; life is getting easier for the wealthy and harder for the middle and working classes.

The Republican philosophy espouses tax cuts and a strong defensive posture around the world which has led to a constant state of war. Former President Trump had to fight his own party to cut back troop commitments in Iraq and Syria. These twin goals – a larger military and tax cuts – are incompatible and have caused bigger deficits than Democratic administrations over the past forty years. Republican voters care about deficits so Republican politicians continue to pay homage to the idea despite their poor performance on that count. Republican politicians counter that it is the Democratic benefit plans that cause deficits, not Republican military spending and tax cuts.

Democrats champion more benefits and higher taxes on high income earners to pay for the benefits. Most of those high-income earners are in solidly Democratic states, not Republican political strongholds, so there is little advantage to Republican resistance to higher taxes. Republicans are opposed to higher taxes on principle, not politics. They believe that there are few legitimate functions of central government under Federalism: 1) provide a common defense and make treaties, what John Locke called a Federative power in his Second Treatise of Government, 2) resolve disputes between states, 3) preserve property and individual freedoms. The several other functions like coining money and post offices can be found in Article 1, Section 8 of the Constitution.

The heart of the dispute between Republican and Democratic voters lies in their different interpretations of the General Welfare clause of that section, i.e., that Congress shall have the power to “provide for the common Defence and general Welfare of the United States.” Democratic voters believe that phrase means Congress should provide for the welfare of the people in each state. Republican voters believe that it applies at the state level. In interpreting the Second Amendment, Democrats and Republicans switch; Democrats think gun rights apply to state militias while Republicans think those rights apply to individuals.

These are long standing arguments and opinions that resist change, despite the experimental data. I agree with Tim Kane that we have a chance to compare economic philosophies. I disagree that the results will change many minds. We don’t like to change our habits or opinions.

//////////////

Photo by Bermix Studio on Unsplash

The Bubble of Average

November 26, 2017

by Steve Stofka

December is the 10-year anniversary of the start of the recession that culminated in the Financial Crisis of 2008. Four years later, an investor finally broke even.

Since that breakeven point in early 2012, the total return of the SP500 has more than doubled.  The rising market and historically low volatility sparks predictions of a bubble and a crash. The Shiller CAPE ratio, an inflation adjusted measure of price-earnings, is not as high as the ratio of the dot-com boom but it is very high.  Stocks are expensive.

Let’s turn to some long-term returns for a different perspective. The 10-year annual return is only 8.13%, almost 2% less than the average for the past 90 years. The 20-year return is even worse – just 7%.

From July 2000 to August 2006 an investor made nothing. As a rule of thumb, savings needed in the next five years should not be invested in the stock market. Both downturns are good examples. The 2000-2006 downturn lasted six years. The 2007-2012 lasted more than four years.

Let’s turn to a 30-year period, 1988 to 2017. The period begins just after the October 1987 meltdown. All the froth has been taken out of the market. The 1990s included the historic run up of the dot-com boom. The 30-year return is above average but not by much – .6%.

The most disturbing truth about these averages is the average or below average returns of these periods.  Investor surveys regularly show that people disregard averages and overestimate future returns.  That fantasy is the true bubble.

//////////////////////////

Corporate Taxes

Next week the Senate will attempt to pass a tax cut bill. As I noted last week, both the Senate and House bills cut the corporate income tax to 20%. The administration and Republican lawmakers state that this tax cut will help working families the most. They must be too busy to read the analysis of their own Treasury department.

The Department periodically analyzes the distribution of the tax burden on various types of taxpayers. In their latest analysis, they estimate that labor income bears only 19% of the costs of corporate income taxes. Steve Mnuchin, the head of the department, claims that workers bear 2/3rds of the cost of the corporate tax. He uses this fantasy number to support a corporate tax cut.

Who will benefit most from a cut in the corporate income tax? The report states “the top 10 percent of families bears 72.5 percent of the burden” and will be the winners.

Over the decades, through Republican and Democratic administrations, the cost burden of labor has changed only slightly. Economists might argue the finer points, but the distribution is well understood. Mnuchin’s job is to sell the boss’s tax cuts. Facts be damned and full steam ahead.

Rocky Tax Road

November 19, 2017

The House passed a tax cut bill this week as the Senate Finance Committee passed a separate version that must still go to the full Senate for a vote. There’s a hard road ahead for this bill to reach the President’s desk.

The Process…

The full Senate will take up the bill after Thanksgiving. If the Senate passes the bill, there are still more steps. Bills submitted by Congress must have identical language from both the House and Senate.

The House passed its tax bill first, so the Senate could adopt the House version and approve it. Highly unlikely. If the Senate passes a bill, both bills will likely go to a House-Senate conference committee to resolve differences in the two bills and produce a unified bill. The Republicans will hold a majority on that committee and do not need Democratic votes.

If the committee can produce a unified bill, it will be sent to the House and Senate for a vote. If either body rejects the bill, it can be sent back to the joint committee, but that rarely happens. The bill would be effectively dead.

Republican leaders regard passage of the bill as critical to the 2018 Senate races. After the Republican majority failed to pass a health care bill earlier this year, big dollar donors have advised party leaders that they are closing their wallets if the party cannot pass a tax bill. Fundraising for the 2018 campaigns kicks off in a month.

The Provisions…for business

Both bills cut the corporate income tax to 20%. Both bills will tax pass-through and passive income at 25% or 32%.

Pass-through income consists of profits earned by businesses that flow to the business owner as personal income. Half of all pass-through income goes to the top 1% of incomes.

Passive income can be the profits from rental property, or dividends paid by an REIT (Real Estate Investment Trust). Under current law, such income is taxed at personal rates as high as 40%.

Republican Senator Ron Johnson opposes the bill as it came out of the Finance Committee. The bill gives an estimated $1.3 trillion in tax cuts to corporations, more than three times the $362 billion in tax cuts to taxpayers with pass-through income. Each sector currently pays half of the taxes on business profits. Small businesses and farmers get 25 cents of the tax cut dollar, while big corporations get 75 cents.

With only a two-person majority, Senate Republicans cannot afford to lose more than two votes and pass this bill. Susan Collins from Maine, a state dominated by small businesses, has echoed Johnson’s objections. Rand Paul from Kentucky says he will not vote for a bill that increases the deficit, which this bill does. Unless there are some key changes made to the Senate bill during the Thanksgiving break, the bill is unlikely to pass.

Both bills keep the 1031 exchange clause which allows real estate owners to avoid capital gains taxes on the sale of a property when they reinvest the gains in a similar class property. Owners of equities do not enjoy this tax subsidy. An investor who sells a stock, mutual fund, or ETF must pay any capital gains even if the investor buys another equity with the gains.

The Provision…for individuals

The House bill promises to save a median income family $1182 in taxes. Not about $1200. $1182. The precision of that number indicates that it is more a selling tool than a reality. The Senate version will likely tout something similar.

Half of taxpayers will notice little change in either bill because they pay almost no income taxes. Both bills retain the Earned Income Tax Credit (EITC). Lower income taxpayers will see no relief from the bite of FICA taxes.

The standard deduction is doubled but personal exemptions are eliminated and the child tax credit is increased by $600 per child but only for five years. Have you got that? Paul Ryan, the House Majority Leader, assured us that the tax bill would be simpler. Sound simple to you?

The Senate bill includes a repeal of Obamacare penalties for not having health insurance. Oddly enough, this saves the government $332 billion over ten years. Wait, how does that happen? The Congressional Budget Office (CBO) estimates that many younger people who would be eligible for subsidies under Obamacare will simply forgo insurance if the penalty is eliminated. Republican leaders get two birds with one tax stone. Senators can register their disapproval of the most hated part of Obamacare and the savings enable the Senate bill to meet the deficit requirements under reconciliation rules.  These rules allow the Senate to pass legislation with a simple majority.

As I noted two weeks ago, both bills eliminate or reduce the current deduction for state and local taxes (SALT). High tax states like California, New York, New Jersey, Connecticut and Massachusetts have no Republican Senators. If Republican leaders lose the votes of Johnson, Collins and Paul, they would have to reinstate a full SALT deduction to have any hope of gaining one or two Democratic votes.

The Senate eliminates the SALT deduction entirely and uses the tax money to continue the deductions for medical expenses, student loans, mortgage interest and charitable donations. The House bill eliminated these deductions but allowed some SALT deduction in order to appease Republican House members from high tax states.

The House bill simplifies the tax brackets from the current seven to four. The Senate version has seven brackets.

The Conclusion…

Imagine a rough dirt road after a lot of rain. The tax bill has just turned off the paved highway and onto the dirt road. Expect a lot of muttered cursing, pushing and digging to move a tax bill to its final destination, the desk of President Trump.


Numbers and Feelings

November 5, 2017

How do numbers feel to us? Numbers are hard like rocks. Feelings are squishy. Numbers are left-brained. Feelings are right-brained. Deep in the vaults of our brains, tiny elves translate one into another. Here’s an example.

This past week, House Republicans released an initial proposal of tax reform. A feature of the plan is the limitation of state and local tax deductions (SALT) to $10,000. Under current tax law, taxpayers have been able to deduct state and local taxes without limit.

This will hurt taxpayers in high-tax blue states which are overwhelmingly Democratic. Wisconsin, a purple state, is the lone exception among the top ten states (Forbes ranking of state tax burden).

Expecting no votes from Democrats in passing a tax reform/cut bill, Republicans included few provisions in the bill that would pacify voters in Blue Democratic states. Republican congresspersons in those states are faced with a dilemma. One Republican congressperson in New Jersey, one of the top high tax states, claimed that the average SALT deduction in his district was $21,000, more than double the allowance in the tax reform proposal.

Knowing that the SALT limitation will hurt their constituents, do Republican House members vote with their party or in the interests of their constituents? Numbers can make politicians anxious.

For some taxpayers in those states, the feeling is anger. “I don’t want to pay taxes on my taxes,” one New Jersey resident growled.

That same N.J. congressperson claimed that incomes less than $200,000 were middle-class. According to this calculator based on the Census Bureau’s Current Population Survey, an income of $200K is in the 97th percentile of all incomes. Less than 3% of households have incomes greater than $200K. Hardly middle-class.

What is middle class? Some studies use the 25th – 75th percentile. Some use the 30th – 80th percentile. Using the latter definition, 2016 incomes from $24,000 to $75,000 were considered middle-class. These classifications use national data. Many coastal states have far higher incomes and living costs.

People living in some east and west coastal states feel middle class even though the income numbers do not classify them as such. Take for example, a household in Silicon Valley, where the median household income is almost $100K,  $40K more than the national median. They are rich, right?

Not so fast. The median price of a home in Santa Clara County (San Jose) is almost $1.2 million (See here ). Spending $40,000 annually for housing on an income of $95,000 feels middle class. The percentage of housing cost to income, 42%, is far higher than the 30% HUD guideline, and is more typical of poor working-class families.

Californians have counties with the highest incomes in the U.S. – and some of the poorest. The state has a median household income that is 12% higher than the national average.

CalUSHouseholdIncComp

But that’s not how it feels. That extra income is eaten up by higher housing costs, high car insurance premiums, and higher taxes at all levels. California sends about 12% more taxes to Washington than it gets back in various national programs. The additional federal taxes paid by higher income coastal states helps pay for benefits to those in lower income states, particularly those in southern states. Blue states subsidize Red states.

The Red states control the national agenda in Washington. The Republican tax proposal in its current form takes tax pebbles from the Red scale and puts them on the Blue scale. That feels spiteful.  Voters in those Blue states feel angry.

Interest groups around the country feel angry. The National Association of Home Builders claims that the SALT limit will lower home valuations, particularly in coastal states. They have promised a considerable effort and expense to defeat this version of the tax proposal.

When I recalculated my family’s 2016 taxes using the new proposal, we saved $752, a bit less than the $1200 average savings for a family of four. The monthly tax savings – the numbers – are relatively small. I feel neither angry or joyful. Those of us who are little affected by the proposal are unlikely to raise our voices in protest or support.

Angry people act. They call, they shout, they organize.

Joyful people – the CEOs of large corporations who will benefit greatly from this proposal – are not shouting. They calmly make claims that lower taxes will create more jobs, although the evidence is rather weak. They are organizing. They are calling talk shows. But most of all they are donating.

Political donations can speak more loudly than the shouts of angry people. In the political game of Rock, Scissors, Paper, cash covers a rock thrown in anger. Angry people must take up the more precise and patient tool of the scissors if they hope to best cash in a contest.

Lastly, this tax proposal further divides earners into groups. Income earners above the median will learn that this $1 is not the same as that $1 to the taxman.  According to an analysis done for the Wall St. Journal,
The $1 earned in wages and salary will be taxed more than
The $1 earned by the small manufacturer, which will be taxed more than
The $1 earned by the real estate investor, which will be taxed more than
The $1 earned by a stock or bond investor, which will be taxed more than
The $1 paid to an inheritor, who will pay $0.

Republicans criticize the identity politics practiced by Democrats. With this tax proposal, Republicans have stamped identities on the very $$$$ we earn. Those numbers don’t feel good.


Tax Cuts and Us

Until the end of the year, we will hear and read a lot about the expiration of the Bush tax cuts.  For those who want to extend all the Bush tax cuts, you will hear stuff like this: “The non-partisan Congressional Budget Office (CBO) has predicted a recession in 2013 if the Bush tax cuts are allowed to expire.”  As with most political claims, this is slightly true.  Remember that politicians are little more than magicians practicing a logical sleight of hand in order to convince you of some claim.  What the CBO actually said in a May 2012 report was “if the fiscal policies currently in place are continued in coming years, the revenues collected by the federal government will fall far short of federal spending, putting the budget on an unsustainable path.” (Source)  In the next sentence, the CBO cautions “On the other hand, immediate spending cuts or tax increases would represent an added drag on the weak economic expansion.”  Is there room for compromise in this dysfunctional Congress?

While many politicians are aware of the difficult trade-offs, they dare not mention that to voters, who, they presume, are stupid.  On Fox News, MSNBC and other media, we will continue to hear simplified versions of a complex debate because – well, we’re just too dumb to pay attention to complex arguments that involve math.  If you are like most voters, many politicians reason, you have already stopped reading this because it has too many adjectives, verbs and commas.

The CBO does its best to estimate the long term impact on the federal budget and economic activity as a result of a paticular policy. To illustrate just how difficult this task is, let’s look at a July 2007 letter from the CBO to the Congressional Budget Committee projecting “For 2008 through 2011, CBO’s baseline budget projections show deficits of $113 billion, $134 billion, $157 billion, and $35 billion, respectively.”  Deficits were actually $458 billion, $1,413 billion, $1,293 billion and $1,300 billion.  Actual deficits were almost ten times what the CBO projected!  Knowing that ten year projections are almost pure fantasy, Congress continues this practice.  Each party uses the CBO estimates to support or attack a particular policy. 

The CBO projects a recession in 2013 if ALL tax policies were allowed to expire, including the Bush tax cuts.  “These include the Bush tax cuts, the alternative minimum tax (AMT) patch, the temporary payroll tax cut, and other temporary expiring provisions, many of which are commonly referred to as “tax extenders.” (Source)   The Congressional Joint Committee On Taxation (JCT) has a complete seven page (!!!) list of “temporary” tax cuts that are due to expire at the end of this year. 

What is the bottom line for the individual taxpayer if ALL the fiscal policies, including the Bush tax cuts, were allowed to expire?  In a 2012 report by the Congressional Research Service, they cite estimates by the Tax Policy Center that, in 2010, “the Bush tax cuts resulted in the lowest 20% of taxpayers seeing their income rise by 0.5%, while the top 20% saw their after-tax incomes rise by 4.9% and the top 1% saw their income rise by 6.6%”. (Source).  What will be the impact on most taxpayers if the Bush tax cuts expire?  Some but certainly not as dire as some politicans predict.  But that is not how politicians get votes.  To get us to the polls, politicians and their pundit lackeys who appear on TV and radio talk shows try to breed fear in voters.  The media is happy to oblige; fear makes for better ratings.

Based on estimates from the Tax Policy Center and the IRS, below is a comparison of what 2012 tax rates would be with and without the effect of what are commonly called the Bush tax cuts. (Source) This is just a “what if” scenario since the Bush tax cuts are still in effect for the 2012 tax year, but it does give us a good guesstimate of the effect of letting the tax cuts expire.

Using that data, I have projected what the effective tax rate on adjusted gross income would be for 2013 if the tax cuts are allowed to lapse.  It includes the tax brackets that includes the majority of tax payers.

The couple making $40K in adjusted gross income would pay $645 more in Federal income taxes.  The couple making $80K would pay $2225 more; the couple making $120K would pay $6669 more.  Those in the top 20% would see tax increases of $16K and more.  It is understandable that taxpayers with income in the millions would want to keep their gravy train going.  They need government mostly to protect their property rights; everything else, all the regulations and social support programs, is just wasted tax money.  Most of the rest of us don’t like paying taxes either.  We could step up to the plate and pay down some of the debt that we have run up; or maybe we should just let our kids figure it out.

Starve The Beast

Fiscal realists have often championed a Starve the Beast theory, which aims to restrain the growth of government spending by restricting or reducing the growth of tax revenue to that government. The theory intuitively makes sense.  With less money to spend, politicians will be forced to lower spending.  During the past thirty years, however, the exact opposite has happened at the federal level.  When tax cuts were enacted, spending went up.  When taxes were raised, spending went down.  How to explain this curious phenomenon?

Jerry referred me to two articles written in 2004 and published by two think tanks commonly thought to be at opposite ends of the political spectrum, the libertarian leaning Cato Institute and the liberal leaning Brookings Institution.  In an article at About.com, Mike Moffat cites a one page summary by William Niskanen, Chairman of the Cato Institute, of a study that Niskanen did in 2002 which examined the relationship between tax cuts and spending.  He found an inverse relationship; taxes went up, spending went down and vice versa.

Two authors at the Brookings Institution, also writing in 2004, examined the voting records of mostly Republican lawmakers who had taken the “No New Taxes” pledge that year and found that the majority were, in fact, liberal spenders.  In 2004, the authors predicted that the combination of tax cuts and liberal spending by a Republican majority would dramatically increase the deficits.  Ballooning deficits during the following four years did lead to a doubling of the national debt, just as they predicted.

How many of the 258 original pledge signers are still in office?  I don’t have time for that analysis but the Americans For Tax Reform lists 235 Representatives and 41 Senators in the upcoming Congress who have taken a reiteration of the no tax pledge, called the Taxpayer Protection Pledge.

This past weekend President Obama and Republican leaders from the upcoming Congress hammered out a “framework” of compromise over the renewal of the Bush Era tax cuts.  Republicans were adamant that the top 3 – 5% of incomes retain the slightly lower tax rates of the past decade.  While Democrats may ridicule Republican politicians as paid stooges for the rich, many Republicans openly took the pledge, were presumably voted or retained in office because of the pledge and are honoring that pledge to their voters.

 Neither Republicans or Democrats have taken a pledge to reduce spending.  Below is a graph of Federal spending without transfer payments like Social Security, unemployment insurance and other social welfare programs.

Notice that leveling off in the 90s?  To decrease the ballooning debt incurred during the Reagan years, taxes were increased in 1993 under the newly elected Clinton Administration.  Voters balked, sending Republicans to Congress in 1994 on a pledge to cut spending, which they did.  The Starve the Beast theory works in reverse.  When voters have to come up with more taxes now, they demand reductions in government spending.  When taxes are cut, voters lose any urgency to insist that their representatives cut spending.  They talk about leaving a tax burden for their children but they don’t flood the offices of their representatives with phone calls, letters and emails.  That flood happens when the tax burden for government spending falls on voters now

Federal spending is only a third of the problem.  The 50 states constitute 2/3 of total government spending.  Below is a graph, in real dollars, of total government spending less transfer payments.

Tax cuts produce less real tax revenue and disincentivize voters to scrutinize the spending habits of their elected officials, thus increasing our national debt.  Tax increases produce more real tax revenue and stir up a passion in voters to get spending in control, thus reducing the national debt.  Over the long term, the choice should be clear – increase taxes which cuts spending.

What is the framework that Obama and Republican leaders worked out this past weekend?  Provisions include a two year extension of the tax cuts for all income earners, a 2% payroll tax reduction, an extension of federal unemployment benefits and an accelerated write off of business investment.  The two year cost of this is over $850B.  In short, this is Stimulus 2, slightly larger in cost than the $800+ billion that Stimulus 1 cost.  Stimulus 1 featured stimulus spending controlled from the commanding heights of the federal and state government.  Stimulus 2, if passed, will feature spending controlled by the people and businesses of this country.  The real risk of Stimulus 2 is that the receivers of these tax breaks will not spend the savings but continue to pay down accumulated debt.  Businesses are already holding onto an estimated $2 trillion in cash, reluctant to invest the money until there is a sure sign that the economy is turning around and they can make some return on their investment. 

Will accelerated tax deductions for investment induce businesses to loosen their purse strings?  Stay tuned as the Great Recession continues….and continues.