June Labor Report and Plaques

On a recent vacation road trip, I enjoyed a number of tourist sites.  At Carlsbad Caverns in New Mexico, I learned that 2000 men with the CCC (Civilian Conservation Corp) built most of the visitor walkways and accomodations in the caverns between 1938 and 1942. Not only did the Caverns project provide enjoyment and a learning experience for me seventy years later, it provided work for a country still suffering through a long depression.  In Corpus Christi, I learned that, in the early 1970s, the sand dunes had been reclaimed by a joint effort of Texas and the Federal Government.  Stopping at a scenic site in west Texas, I read that visitor accommodations had been built as part of the Federal Highway project in the 1950s. At Big Bend National Park, I learned that Texas had turned these deep canyonlands into a state park in 1935, providing work for many in the process. 

What tourist sites will our children and grandchildren visit?  Will they read any signs that herald the hard work of those who lived through this Great Recession?  Why not?  Politicians argued about the budget and the national debt in the 1930s, in the 1950s, in the 1970s, just as they do today.  Then they got to work and made something happen.  Democrats and Republicans have sat on opposite sides of the fence and pointed fingers at each other in those past decades – then grudgingly came to a compromise and got something done, putting thousands to work on enduring projects.  Fifty to a hundred years from now, will there be any projects built by this generation that will have visitor plaques that our great grandchildren can read while on vacation?

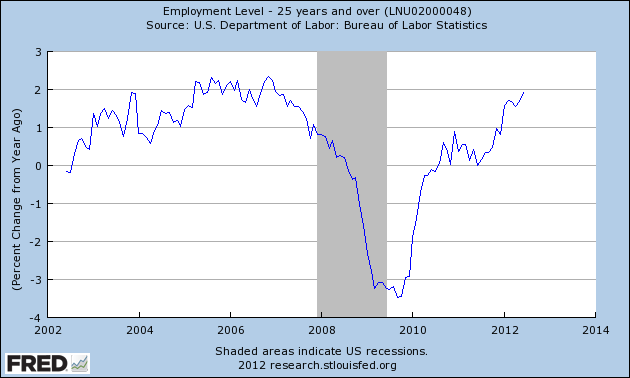
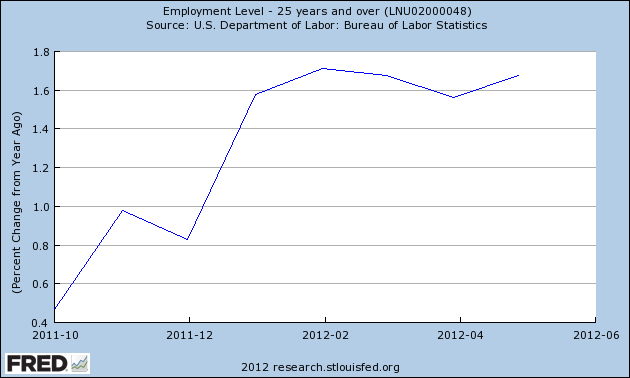
With that, I’ll turn to the June employment report.  The headline number was a disappointment to many.  Although the number of jobs increased by about 75,000, it was less than the 120,000 hoped for.  The good news is that the year over year percent increase in jobs for most of the working population continued to increase.

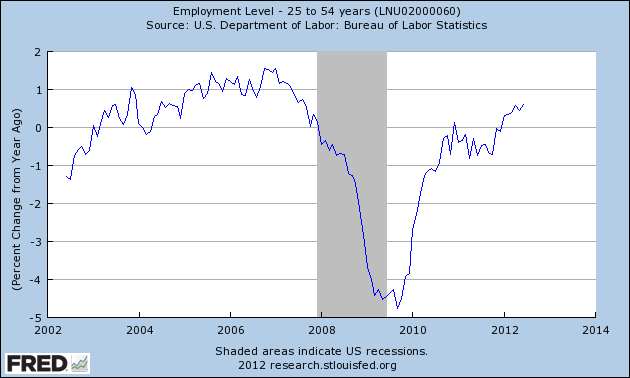
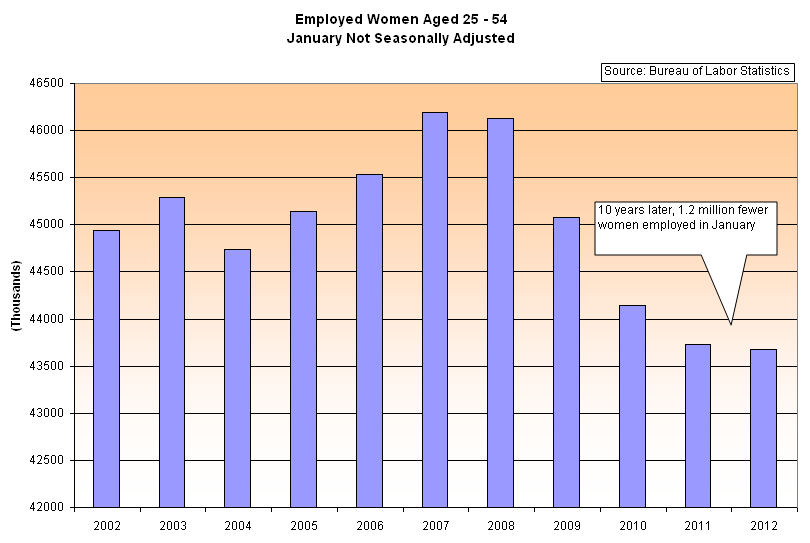
The core working force – as I call it – those aged 25 – 54 continued to show modest positive increases as well.

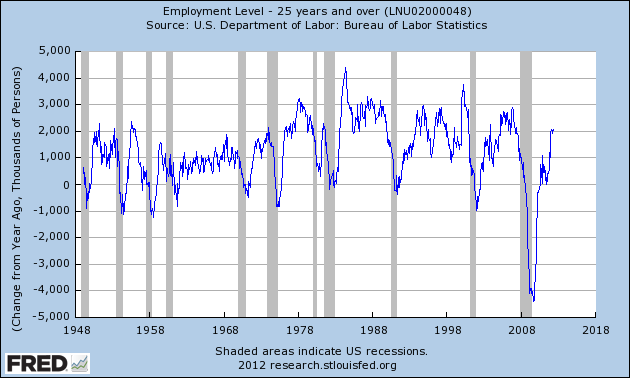
The problem is that it is still not enough.  In the larger work force, aged 25+, we would like to see sustained 1.5% to 2% year on year growth to pull the economy up and out of the quicksand.  Despite all the rhetoric from the politicians who claim they know how to create jobs, those of us who actually create jobs know that the chief reason for the lack of stronger hiring is the politicians themselves.  The June survey of the National Federation of Independent Business (NFIB) a small business organization, reported that about 25% of business owners “who say it is a bad time to expand blame the current political mess.”  Another quarter of respondents blame weak sales, a fifth blame taxes and another fifth blame “unreasonable regulation and red tape.”  The number of firms planning to hire in the next six months offset approximately the same number of firms planning on reducing jobs.  In short, a lackluster preview of the second half of the year.

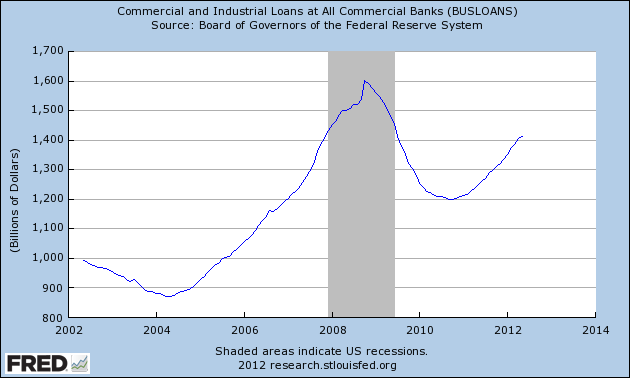
Over the past two years, business loans are continuing to grow, indicating increasing investment.

Businesses are preparing – cautiously – for increased consumer spending.  But consumer loan growth has stalled after a severe decline at the onset of the recession several years ago.  The spike in the first quarter of 2010 was an accounting change (explanation)

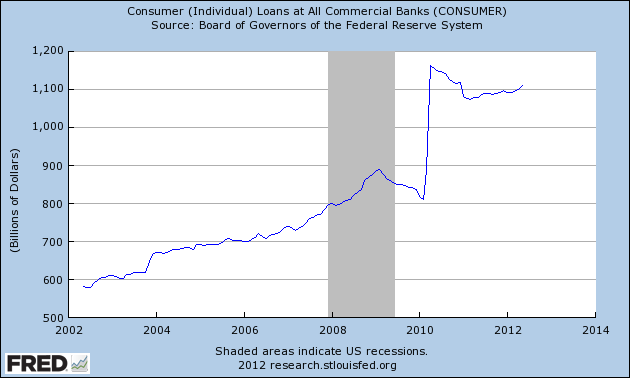
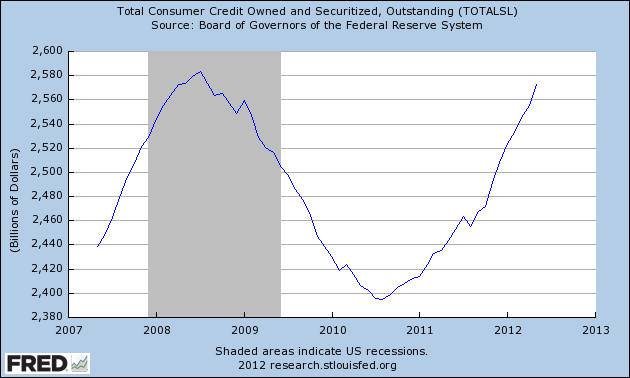
A bright spot – or dark spot – is the increase in overall consumer credit, approaching the levels of 2007.  Are consumers more confident?  Recent surveys don’t show that.  Are consumers more desperate and charging more to make up for  a lack of income growth?  Probably.

Disregard the rants and promises of blowhard politicians.  Consumer demand initiates most of the job creation in this country.  Businesses respond to that consumer demand by hiring more employees.  Without the demand, business owners create few jobs.  The only jobs created are sales and advertising jobs as business owners try to increase demand or take sales away from competitors.

In the coming months before this election, I encourage all of you to ask two questions of your representatives, senators, president and presidential contender:
1.  If consumers are still cautious, what policy can you implement that will encourage consumers to spend more? 
2.  If businesses are still cautious in their outlook, what policy can you implement that will encourage them to invest more in new jobs and equipment?

If the politician is a Republican, he or she will say that reducing regulations and taxes for businesses will help them create more jobs.  Ask them how that will help create jobs if the business has only tepid sales growth.  Should businesses hire more people just to sit around and fiddle their thumbs?

If the politician is a Democrat, they will talk about “investment” but what they mean is government spending to take the place of the lack of consumer spending.  How are they going to encourage consumers to spend more?  Silence.

Neither party has an answer to the problem of deleveraging, which is what consumers have been doing for the past several years.  They borrowed against their homes and their homes went down in value.  They charged more on their credit cards to make up for the lack of growth in their real incomes.  They had to pay down or default on that credit before charging more.  Deleveraging is a process that must be endured.

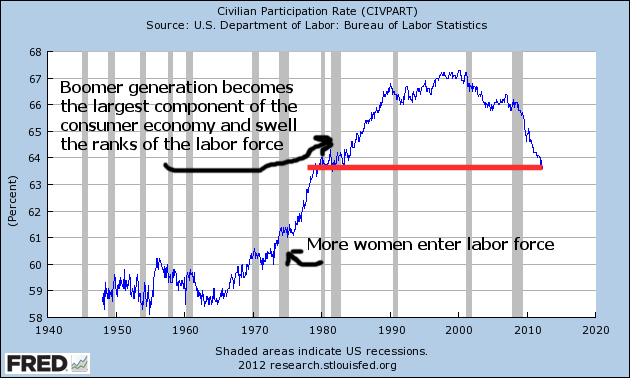
Unlike the individual states, the federal government has the constitutional capability of borrowing money.  While the federal government can not solve the problem of consumer deleveraging, it can soften the impact by borrowing to initiate the same kind of projects that the federal government, together with the states, did in previous decades: build and improve stuff that we can put a plaque on!  I do not like increasing government debt but I do like visitor plaques and informational signs at scenic and tourist sites.  Fifty years from now, will the Boomers be known as the Stumble Bum Generation or the Plaque Generation?

Manufacturing Rising

Manufacturing Employment has been increasing since the recession officially ending in mid 2009 but it remains at historically low levels. (Click to enlarge in separate tab)

As a percentage of the Civilian Labor Force (those working and those looking for a job), there has been a decades long decline.  Almost 1 in 4 employees worked in manufacturing in the 1960s.  Today, the ratio is 1 in 12. 

When China joined the World Trade Organization (WTO) in 2001, it began taking a lot of what are called “low value added” manufacturing jobs.  These are jobs which do not require specialized skills or knowledge.  Many rural and urban U.S. workers with high school degrees or less lost their jobs to mainly rural Chinese workers who migrated to large cities in China and staffed the recently built factories.

While employment in manufacturing has gone down, sales have climbed, enjoying positive year over year gains except for the two recessions in the 2000s.

Adjusted for inflation over the past twenty years, each manufacturing worker is producing almost twice the value of goods. 

Investment in factories and production equipment, more streamlined processes and a higher skilled workforce have led to these productivity gains.  Since 2006, workers have seen a 16% increase in earnings, almost as much as the 18% real productivity gains during those years.

Democratic politicians and commentators often criticize business owners and executives for taking all the profits from productivity gains by workers.  In this industry, the facts simply do not support those criticisms.

May Labor Report

May’s monthly Labor Report headlined a seasonally adjusted job gain of about 70K, less than half of the 150K expected.  The stock market response was swift and worsened as the day’s trading progressed.  By the time the dust cleared Friday evening, the broader S&P500 index had lost about 2.5%, it’s worst daily performance since Oct. 3, 2011.

On Feb. 5th, I wrote in response to the January labor report showing a gain of 234,000 jobs: “With the S&P500 index at 1344, some market pundits are whispering the 1500 mark that the S&P could take a run at this year.  Holy moly, macanoli, what a buzz about one labor report!” and later “Any job growth is good, but when I see a better improvement in the employment numbers for [the core work force aged 25 – 54], I will know that we are building a resilient economy, one that can withstand some shocks.”

Remember, the headline numbers are seasonally adjusted.  For the past three years, market watchers and economists have been warning about the seasonal adjustment factors used by the Labor Dept.  The severe job losses in the fall and winter of 2008/2009 have probably skewed the adjustment factors, leading the Labor Dept to overstate job gains during the winter and understate job gains in the spring and summer months.  The unusually warm winter of 2011/2012 further skewed job gains, pushing some normal spring hiring forward into the winter months.  That’s why I look at year over year gains in unseasonally adjusted numbers, particularly in the core work force aged 25 – 54.

Below is a graph of the percent gains of the core work force, which accounts for about 2/3 of the total work force.  The FED has conveniently saved me the trouble of running the graphs from the Labor Dept – but mine are more colorful :-).

The headline numbers of monthly job gains of more than 200K led many investors to bid up stock prices a bit more than the job gains in the core work force warranted.  Friday’s stock market reaction was probably a bit much but many investors simply bailed.  The same stock price and labor market patterns of 2010 and 2011 are emerging again this year.  Last June, I wrote about a backtest of investing based on the old “Sell In May and Go Away” mantra. While that investment strategy underperformed regular monthly investing, it has been disturbingly profitable for the past two years and looks to repeat again this year.  The disappointing labor figures only compounded the worries about the ongoing recession and financial woes in Europe, causing many to bail out of the market.

Let’s “zoom out” on the core work force, looking at the past year and a half.  There is a definite positive trend in place.

Let’s fly up like little birdies and look at the core work force for the past 12 years to see this recent upward trend in perspective.

Let’s look at the larger work force, those aged 25+, which accounts for 88% of employment in this country.  The year over year gains have leveled off at about 1.6% in the past few months.

Looking back the past 12 years, we see that this gain is moderately healthy.  The housing bubble produced employment gains of over 2% – gains concentrated in construction.

Now let’s look back to the “roaring nineties,” before China joined the WTO in 2001, leading to a loss of 4 million manufacturing jobs in this country.  The country enjoyed a tech boom in that decade, eventually leading to the dot-com bubble as we approached the millennium mark.

The job gains these past 6 – 8 months are respectable, averaging what they were in the nineties; core work force numbers are still growing.  The job losses of this past recession were historic.  Most of the 8.13 million jobs lost happened before Obama took office and the job losses were staggering when compared to other recessions.  The 1982-84 recession, for comparison, suffered total job losses of 2.84 million, about a third of the job losses of this past recession. Below is a graph of the year over change in employment levels since 1948.  This past recession makes all the past recessions look like small wrinkles.  Job losses of this size severely weakened the structure of our economy.

The employment growth of the past few years has been respectable, even more so given the deep hole our economy is climbing out of.  We are a people who have become accustomed to instant gratification.  We want change and we want it now, dammit.  The political and media machines of both parties know this and play to it.  George Bush played to it in the 2000 campaign, promising to bring the parties closer together, only to drive them further apart.  Obama played to it in his 2008 run for the White House, promising to usher in a new era of honest and accessible government, of community of government and the middle classes, where everyone enjoyed a more even playing field.  Romney’s run for the Presidency will highlight his business experience, promising unspecified growth policies.  What all of these people and their advisors know is that the American public is a sucker for change, reaching for the brass ring of change as we whirl around on the political merry-go-round.  We can be easily lied to because we trust our guts, not our brains.  If we trust someone or agree with their ideology, we will believe almost any data they throw at us.  Most of us don’t check the data.  We’re too busy for that or we don’t know how to check the data.  It all becomes a blur of he said this and the other guy said that and we get confused and vote with our guts.  The parties play to our prejudices.  Think you don’t have any?  Think again.

This election season we will hear a lot of claims, accusations and refutations.  Moderators of the upcoming Presidential debates rarely challenge a candidate with data.  The moderators ask policy questions; the candidate responds with mostly rehearsed answers.  Then on to the next question.  It is up to us to do our homework but most of us won’t.  Too many of us may be like the caller to a talk show recently.  When confronted with government statistics that refuted the caller’s opinion, he responded “That can’t be right” and countered that the government data is wrong.  We do love our opinions and that is the number one prejudice we all share. 

Employment – April 2012

This past friday, the Bureau of Labor Statistics (BLS) released their monthly assessment of labor conditions in this country and the headline figure was a disappointment.  The survey of businesses showed a seasonally adjusted 115,000 net jobs added in April, below the 150,000 expected by economists.  The unemployment rate dropped to 8.1% as almost 350,000 people simply dropped out.  Some of this was due no doubt to early retirees but the Federal Reserve estimates that retirees account for about 25% of the drop out rate.

As I have done in the past, I’ll take a deeper look at some numbers behind the headline numbers.  The core work force of people aged 25 – 54 continues to show gains but the chart below shows the comparative weakness of this segment of the work force.  This age demographic is the “middle”, when people accumulate both earning and buying power and form the primary demand of a consumer economy like the U.S.

The year over year job gains continue to climb upwards.

Late last summer, the larger work force of those aged 25 and older began showing year over year job gains several months before the core work force, revealing an underlying structural weakness of both the workforce and the recovery.

Some of the workforce is graying, moving from the core 25 – 54 age demographic into the older 55+ demographic, where workers are trying to save for retirement or taking jobs because their social security and retirement income is not adequate.  With a natural propensity for saving, older workers do not create the needed demand for the economy to grow strongly.  In the chart below is the year over year job gains for those aged 55+ and this is a key metric for it shows which age group have enjoyed the bulk of job gains in this recovery.

Throughout this recession and the massive loss of jobs, older workers have continued to show gains.  Strengths in the labor force statistics have been in retail, business services and health care.  Experienced older workers can be attractive to employers offering business services.  In retail and health care, it may be that older workers have less family responsibility, show a greater reliability and are thus more attractive to employers who enjoy a “buyers” market.  This past month was the first month that gains slowed while the gains of the core work force continued to climb.

As I have noted before, the demographic bell curve of the past three decades is coming to a close.  The participation rate, the number of workers as a percent of the working age population, has declined to 1981 levels, nearing the closing of an upswell brought on as the post WW2 boomer generation entered their prime working years.

The 1980 Census shows that, there were 25.5 million people 65 and older in 1980 (11.3% of the total population), an increase of 5 million from the 20.0 million count (12.3% of total) in 1970.  While the numbers climbed, the percentage stayed stable in that 10 year period.  Those aged 50 – 64 numbered 33.4 million, or 14.7% of the population.  In 1970, it was 29.7 million or 14.6%.  Again, the numbers were stable.  The median age of the U.S. population was 30.

Fast forward to the 2010 census and the percentage of those aged 65+ is still relatively stable at 40.3 million or 13.0% of the population.  Despite all the medical advances of the past 30 years and the trillions of Medicare dollars spent on the elderly, the percentage of older people is still about the same as it was in 1970 and 1980.

But the juggernaut of Boomers is waiting in the wings.  The 2010 Census shows that those aged 50 – 64, the “meat” of the Boomer generation, numbered 58.8 million, or 19% of the total population.  In thirty years, they have increased from 15% to 19% of the population.  The median age of the population is now 37 years, an increase of seven years.

The 25 – 54 age group funds the social contract that provides health insurance and retirement income for older Americans.   For this core work force, the increasing job gains of the past four months have been a welcome sign but, as the chart above shows, this core has suffered huge job losses in the past 3+ years and are climbing out of a deep hole.  I hope that April is the beginning of new trend, where the job gains increasingly go to the core younger segment of the work force and not to older Americans.  Only then will we see sustainable economic growth.

The Core Work Force

The Bureau of Labor Statistics (BLS) released their monthly Employment Summary this past Friday and the market cheered, the Dow jumping up 100 or so at the open.  The Sunday talk shows have been abuzz about the report, which showed a January gain of 243,000 jobs.  After 5 months of increasing job gains, how improved are Obama’s chances of re-election?  Does the improving job picture cause the Republican Presidential contenders to change course a bit?  Wanting not to appear as though they are rooting against the American economy, do the contenders aim at specific policies of Obama in the coming months?  With the S&P500 index at 1344, some market pundits are whispering the 1500 mark that the S&P could take a run at this year.  Holy moly, macanoli, what a buzz about one labor report!

The labor report is only part of the picture puzzle that shows an improving economy.  The ISM manufacturing report was slightly below expectations but still growing.  Two key components of the index, new orders and backlogs, showed a robust increase, hinting at continuing improvement in the coming months.  The recent durable goods report shows that businesses are building inventories, a sign that expectations are improving.   Retail sales tapered off in December, but Personal Income was slightly above expectations, growing .5% over November.  Caterpillar, the large equipment maker, is looking forward to revenue and profit increases in 2012, reducing earlier concerns of a global recession.  A recent report indicates that the ongoing contraction in China’s manufacturing has slowed and is close to the neutral mark between contraction and growth. 

So, what’s not to like?

Looking past the monthly headline numbers of job growth, let’s look at this country’s core work force, men and women aged 25-54.  The BLS just made several census adjustments which resulted in upward revisions to seasonally adjusted job growth from April to December.  Instead of looking at seasonally adjusted numbers, I’ll take a look at the raw numbers from the BLS employment report for January and compare them to BLS January data for the past ten years.

A unseasonably warm winter throughout much of the U.S. gave a boost to construction jobs in the office building and multi-family residential construction.  Although the construction industry is still far below 2007 levels, that boost shows up in a comparison of employed men aged 25 – 54 from last January to this January. (Click to enlarge in separate tab)

The ongoing attrition in government jobs, which disproportionately employs women, has slowed but is still evident in comparisons with past Januaries.

This rather tepid growth, or lack of it, in our core work force is troubling.  This age demographic forms the backbone of a healthy economy, raising children, buying furniture and homes, saving for retirement and their kid’s college. Any job growth is good, but when I see a better improvement in the employment numbers for this group, I will know that we are building a resilient economy, one that can withstand some shocks.  We know of some possible shocks – the probable default of Greece, the ongoing recession in Europe and the possibility of some armed conflict with Iran, to name but three.  The shocks we don’t forsee are what can push our economy off balance.  Last year was a reminder of the impact of unforeseen shocks.  The tsunami  in Japan and the flooding in Thailand not only devastated those countries and their people but impacted supply chains in Asia and consequently sent after shocks throughout the world.

Recently fashionable has been talk of a decoupling of the U.S. and emerging countries’ economies from the sovereign debt and financial troubles in Europe.  If recent history has taught us nothing, it is that much of the world is joined together by interdependent webs of financial conglomerates and the monetary policies of nation states, by the tension between global consumer demand and multi-national supply chains to meet that demand.

Earnings

The headline from a recent report by the Census Bureau revealed that the men’s median (50% made more, 50% made less) inflation adjusted income is now less than it was in 1968.  Looking behind the headline at half a century of data uncovers some trends that surprised me.(Click to enlarge in separate tab)

Men’s median earnings during this mother of all recessions have actually been better than the recessions of the early nineties and early eighties.  What distinguished the recession of the early 2000s was that median earnings did not decline, probably due to the growing boom in the construction industry at the time – a boom that would blow up the economy in 2008.  What is apparent is the two decade “Camelot” period of the post war period when median male incomes steadily increased.

1979 was a historic year when there were more women in the workplace than men. How have full time employees of both sexes done in the past thirty years? Data from the Bureau of Labor Statistics shows a overall slight increase in median inflation adjusted earnings during the past decade.

The increased production of workers during those thirty years has been strong – far more than the slight increase in earnings.

As I noted a few weeks ago top incomes have been growing far more than the median income.  Productivity gains produce greater profits. Those profits have largely gone to employers, not the employees. 

Employment Cycles

Last week I cautioned about negative surprises in the coming week’s data and on Friday the BLS (Bureau of Labor Statistics) dumped a big turd – the monthly Labor Report.   How close can one get to zero jobs created?  Out of a civilian labor force of 150+ million, 18,000 jobs is pretty darn close to zero.  The country needs about 150,000+ new job creations a month to keep up with population growth and reduce the unemployment rate.  It was no wonder, then, that the unemployment rate went up yet again for the 3rd month in a row.

Very troubling is a longer term pattern – the average number of weeks that people are unemployed continues to rise. At almost 40 weeks, it is double the number of weeks in 2003 as we pulled out of the relatively light recession of the early 2000s.

In previous blogs, I have compared this current recession to the recession(s) of the early eighties when Ronald Reagan was president.  Obama has been in office for 30 months and I wondered what the unemployment rate was for Reagan’s first 30 months. (Click to enlarge in separate tab)

Although the unemployment rate at this point in Reagan’s tenure was higher, it was steadily, although incrementally, declining.  The current unemployment rate is lower but creeping higher like an ocean tide.  In 1982, Democrats used the rising unemployment rate to advantage, winning an additional  27 House seats to command a whopping 61% majority in the House.  In 2010, Republicans were able to do the same, turning a 58% – 42% Democratic majority in the House to a 56% – 44% Republican majority.  In the off-year election of 1986, voters handed both the Senate and the House to Democrats. Politicians of both parties know that it is difficult to keep your job when unemployment is high. 

 Let’s step back and look at a more disturbing trend that surpasses political parties – the lack of growth in the civilian labor force, which is the total of all people working full and part time and those who are not working but still looking.

 Not since the post WW2 years has this country seen a comparable lack of growth.  In the late 40s and early fifties, the labor force stalled out at approximately 60 million for several years.  In the past three years, it has topped and declined, hovering around the 153 million mark.

While unemployment rates vary from month to month, a more structural view of the economy is revealed by the Civilian Employment to Population ratio (EMRATIO), which compares the Civilian workforce, employed, unemployed and underemployed, to the total population that is not institutionalized in some form or other.

I have highlighted the booms of the past decades on this Federal Reserve chart.  The decline from this last boom is dramatic.  Why?  Any student of the stock market will recognize a familiar reversal pattern in the chart above – the Head and Shoulders.  The peak of 1990 is the left shoulder, the tech peak of 2000 is the head and the housing peak of 2007 forms the right shoulder.  While there is not a consistent “neckline” component to this graph, that is probably due more to tax cut and housing legislation passed in 2003, which prevented a further decline in the ratio.  What does the head and shoulders pattern signify?  A painful return to normal or “reversion to the mean.” In order to get to the average, there is a period when we have to go below the average.  That’s the painful part.

The average of this ratio over 60+ years is 59.2%.  From January 1981 to December 2007, the average was 62.0%.  This past June, this ratio declined further to 58.2%.  The excruciating job of this recession is to take out the remaining excesses of the past three booms.   An ideal ratio is probably closer to 60 – not too hot and not too cold.  If we were to have that ratio, the civilian labor force would be 158 million, almost 5 million more than we have currently.  If only 85% of those almost 5 million people were employed, we would have 4 million extra jobs and the unemployment rate would be just under 6%.

The Reagan and Obama administrations stand as bookends to a larger generational pattern.  While Presidents do play a key role in negotiating economic policies with Congress, they take far too much credit and blame for broad changes in the economy.  As the multitudes of the Boomer generation entered their late twenties and early thirties in the 1980s, they (we) bought more stuff, kickstarting the dramatic rise in household credit which started the first boom.  The “mini-boomers” born in the nineties and 2000s will repeat the pattern.  In the early part of this decade we will continue wringing out the excesses of credit that the boomers rang up over the past decades, preparing the way for this second wave of boomers who will start buying more stuff in the latter part of this decade and into the next decade.

Rinse and repeat.

Jobs, Jobs, Jobs

Jerry sent me an article from the Orange County register on the number of companies moving out of California.  As we’ll see, other states should be examining the jobs environment in their state and determining whether their state invites business.

A National Review article, often quoted by conservative pundits, repeats the fact that Texas has created the majority of new jobs in this country during 2010.  This net new job growth may be coming at the expense of other states.

Latest BLS (Bureau of Labor Statistics) data shows that Texas had net job growth of 251,000 jobs from March 2010 to March 2011.   Some might dismiss job growth in Texas as oil related but the data tells a different tale. While other states were laying off government employees, Texas added 15,000 government jobs  (pg. 9)  The gains were spread among all categories but the 42,000 job increase in health and education services was second only to the 88,000 jobs created in the Professional and Business Service category. 

During that same time, California had net job growth of 171,000.  California has 38 million people compared to Texas’ 25 million.  New York, with a population of 20 million, created only 56,000 jobs.  Florida’s 19 million population created just 51,000 jobs. Arkansas, with a relatively small population of 3 million, created 69,000 jobs, more than either New York or Florida.  Illinois net job growth was 77,000 with a 13 million population.  New Jersey, another populous eastern state, had a small job loss. (Population estimates)

States announce programs that tout how many jobs they are creating but is anyone actually keeping count? An investigation in North Carolina reveals that the published numbers are suspicious, at best.

The federal government announces jobs created or saved by the stimulus program but they rely on the states to keep track of the numbers attributable to stimulus dollars.  Here’s a tale of keeping count – or not – of jobs created through the stimulus program.

Some people in an industry – medical marijuana – that are keeping count of jobs created in Montana.
As Frank would say, “Doobie-doobie-doo”

Next Friday the BLS releases its monthly job data report.  Let’s hope that it is not as disappointing – and market rattling – as this last month’s data.

Unemployment Initial Claims

Every Thursday the Bureau of Labor Statistics (BLS) compiles the initial claims for unemployment in each state.  It publishes both the raw figures and a “seasonally adjusted” (SA) number which accounts for anomalies like higher initial claims after the Christmas season is over and department stores lay off employees.  To smooth out the weekly numbers, it uses a 4 week moving average to get a truer trend of the number of people filing initial claims for UI.

Below is a 5 year history of these initial claims.  In the past few months, the number of initial claims has resumed its decline but a signal that the labor market is on a solid recovery path occurs when the 4 week average drops below 400,000.  As you can see in the graph, initial claims hovered around the 300,000 mark during the mid decade when the economy was more robust. (Click to enlarge in separate tab)

We often hear and read of comparisons of current unemployment with that of the 1982 – 83 recession.  A picture is a worth a 1000 words so I took a 3 year slice of the graph above and overlaid it on a graph of initial claims during the early 80s.

They look similar except that the current recession lasted longer than the 1982-83 recession.  In the past few years and in  the early 80s, intial claims climbed dramatically, then fell.  The comparison graph shows the important difference.  Unlike the early 80s, when initial claims continued to fall as the economy recovered, we have been “stuck” this year in a very slow decline of initial claims.

To understand the true severity of this downturn, however, we must really “zoom out” and look at total civilian employment, which includes government civilian workers as well. 

Unlike the recession of the early 1980s, the current downturn has seen a drastic decrease in total employment.  Although not technically a depression, we can say that this “past” recession was (and is) the mother of all recessions so far.

The graphs above are courtesy of the research division at the St. Louis branch of the Federal Reserve and are available quite easily to the general public.

Trends

A few trends that have caught my attention in the past month:

Credit card offers in the mail are down 77% in the past year.
Gold, bonds, commodities, and stocks are up. It is unusual for all of these asset classes to rise at the same time.
Women now account for 50% of workers, up from 35% thirty years ago.
Only 25% of workers aged 55+ have saved more than $250K for their retirement (excludes house equity and pensions)
On average, the Employee Benefit Research Institute reports that Americans aged 65+ get almost 40% of their income from Social Security. In 2007, the median income for those 65 and older was $18K.
If you had 60% of your portfolio invested in a mix of stocks and 40% in bonds before the banking crisis, you have lost nothing in the past year.
In the past ten years, the Federal Reserve reports (click on debt) that consumer debt has increased 63% and mortgage debt has shot up 135%. Debt in the public sector has almost doubled. Both federal and state debts have risen 95%. For perspective, the Consumer Price Index has gone up on 30% in the past ten years.