Last week I cautioned about negative surprises in the coming week’s data and on Friday the BLS (Bureau of Labor Statistics) dumped a big turd – the monthly Labor Report. How close can one get to zero jobs created? Out of a civilian labor force of 150+ million, 18,000 jobs is pretty darn close to zero. The country needs about 150,000+ new job creations a month to keep up with population growth and reduce the unemployment rate. It was no wonder, then, that the unemployment rate went up yet again for the 3rd month in a row.
Very troubling is a longer term pattern – the average number of weeks that people are unemployed continues to rise. At almost 40 weeks, it is double the number of weeks in 2003 as we pulled out of the relatively light recession of the early 2000s.

In previous blogs, I have compared this current recession to the recession(s) of the early eighties when Ronald Reagan was president. Obama has been in office for 30 months and I wondered what the unemployment rate was for Reagan’s first 30 months. (Click to enlarge in separate tab)
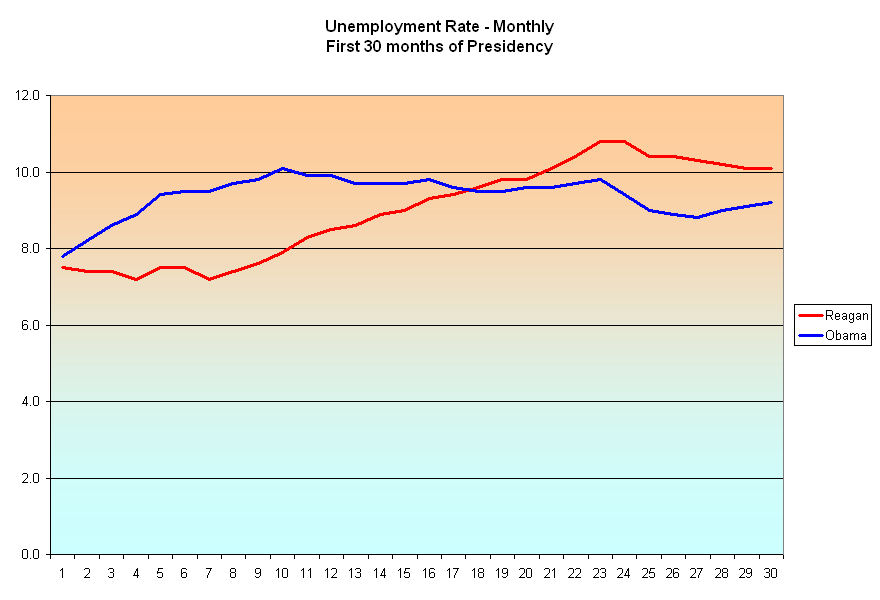
Although the unemployment rate at this point in Reagan’s tenure was higher, it was steadily, although incrementally, declining. The current unemployment rate is lower but creeping higher like an ocean tide. In 1982, Democrats used the rising unemployment rate to advantage, winning an additional 27 House seats to command a whopping 61% majority in the House. In 2010, Republicans were able to do the same, turning a 58% – 42% Democratic majority in the House to a 56% – 44% Republican majority. In the off-year election of 1986, voters handed both the Senate and the House to Democrats. Politicians of both parties know that it is difficult to keep your job when unemployment is high.
Let’s step back and look at a more disturbing trend that surpasses political parties – the lack of growth in the civilian labor force, which is the total of all people working full and part time and those who are not working but still looking.

Not since the post WW2 years has this country seen a comparable lack of growth. In the late 40s and early fifties, the labor force stalled out at approximately 60 million for several years. In the past three years, it has topped and declined, hovering around the 153 million mark.

While unemployment rates vary from month to month, a more structural view of the economy is revealed by the Civilian Employment to Population ratio (EMRATIO), which compares the Civilian workforce, employed, unemployed and underemployed, to the total population that is not institutionalized in some form or other.

I have highlighted the booms of the past decades on this Federal Reserve chart. The decline from this last boom is dramatic. Why? Any student of the stock market will recognize a familiar reversal pattern in the chart above – the Head and Shoulders. The peak of 1990 is the left shoulder, the tech peak of 2000 is the head and the housing peak of 2007 forms the right shoulder. While there is not a consistent “neckline” component to this graph, that is probably due more to tax cut and housing legislation passed in 2003, which prevented a further decline in the ratio. What does the head and shoulders pattern signify? A painful return to normal or “reversion to the mean.” In order to get to the average, there is a period when we have to go below the average. That’s the painful part.
The average of this ratio over 60+ years is 59.2%. From January 1981 to December 2007, the average was 62.0%. This past June, this ratio declined further to 58.2%. The excruciating job of this recession is to take out the remaining excesses of the past three booms. An ideal ratio is probably closer to 60 – not too hot and not too cold. If we were to have that ratio, the civilian labor force would be 158 million, almost 5 million more than we have currently. If only 85% of those almost 5 million people were employed, we would have 4 million extra jobs and the unemployment rate would be just under 6%.
The Reagan and Obama administrations stand as bookends to a larger generational pattern. While Presidents do play a key role in negotiating economic policies with Congress, they take far too much credit and blame for broad changes in the economy. As the multitudes of the Boomer generation entered their late twenties and early thirties in the 1980s, they (we) bought more stuff, kickstarting the dramatic rise in household credit which started the first boom. The “mini-boomers” born in the nineties and 2000s will repeat the pattern. In the early part of this decade we will continue wringing out the excesses of credit that the boomers rang up over the past decades, preparing the way for this second wave of boomers who will start buying more stuff in the latter part of this decade and into the next decade.
Rinse and repeat.
