Laboring But Not Delivering

January 6th, 2013

No change in employment picture.  Same old, same old.  Go back to sleep.

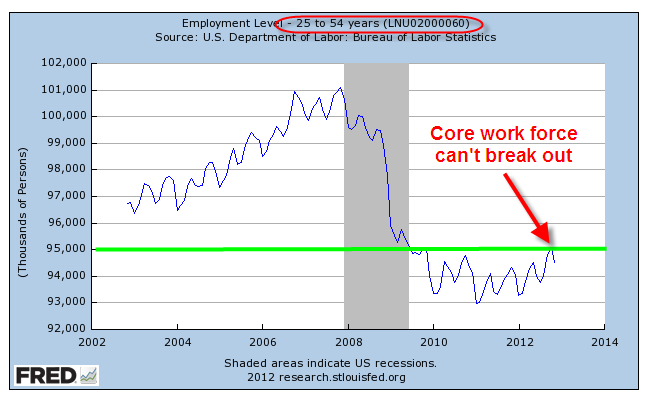
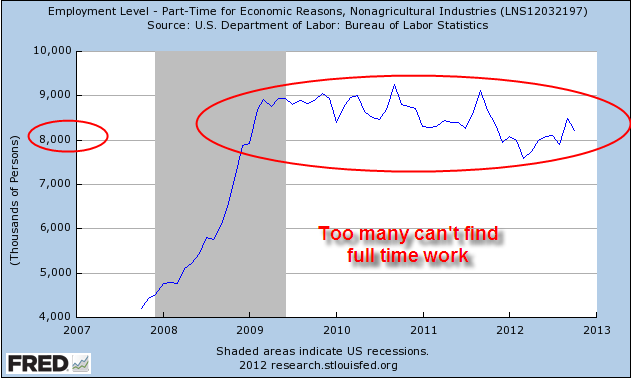
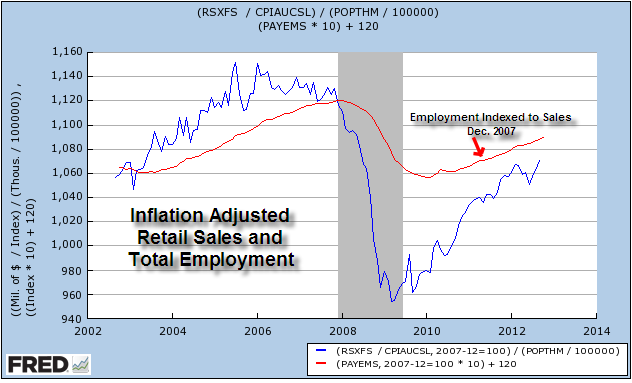
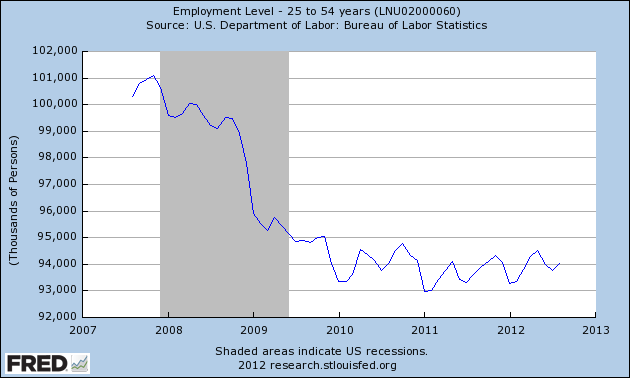
Although the main message of the latest BLS monthly employment survey is little or no change, there are some interesting trends we can look at.    First the ho-hum stuff – stay with me for a paragraph or two.  Job gains of 155,000 this past month was essentially the average of the past twelve months; it is enough just to keep up with population growth.  The unemployment rate, number of jobless, long term unemployed, participation rate, employment-population ratio and number of involuntary part-timers all were essentially unchanged.  Can’t get more sleepy than that – but stable.

Health care employment continues to zoom upwards, gaining 45,000 this month and averaging over 28,000 monthly in 2012.  Over 2/3rds of the gains this month were in ambulatory care and nursing homes.

We are eating and drinking out at about the same pace as we did in 2011.  Food services and drinking places added an average of 24,000 workers per month this year, same as the previous year.

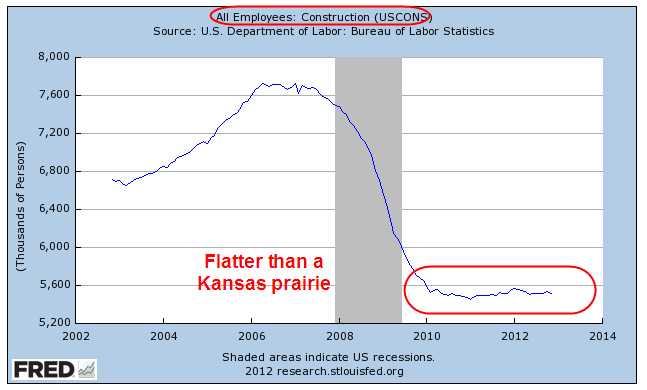
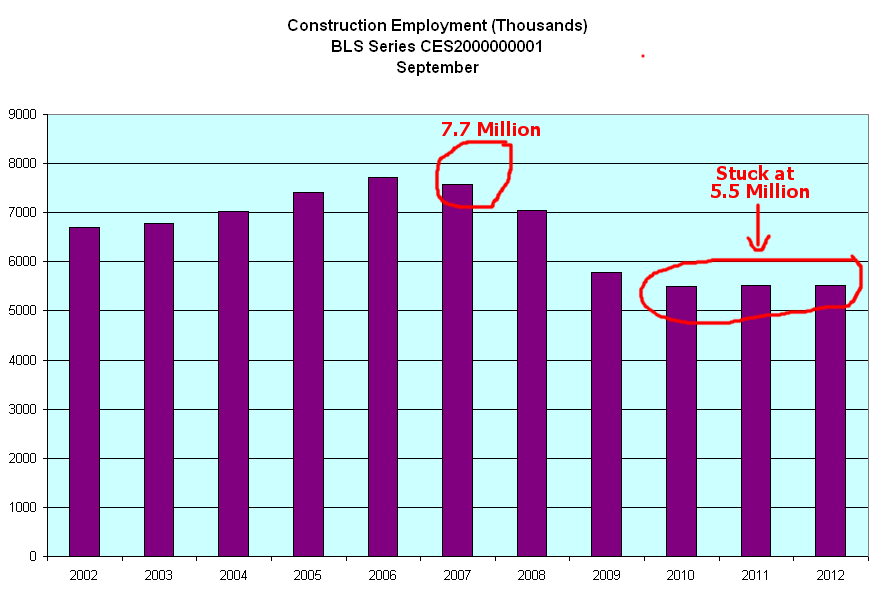
20% of the job gains this month were in Construction but the industry is still flat.

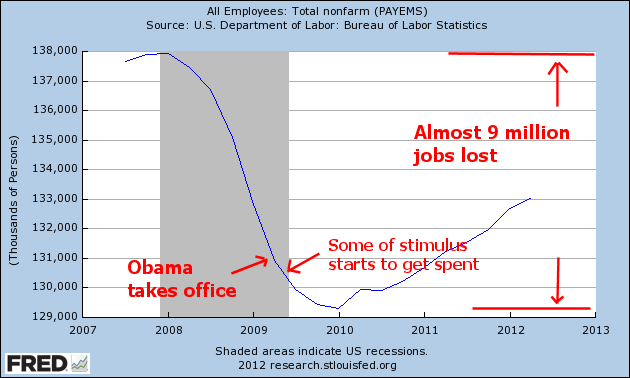
Now here comes the interesting stuff.  Bill McBride at his Calculated Risk blog for this past week has a chart of job recoveries after recessions.  This blog  is one I read regularly and is on my recommended blog list.  Check it out if you have not already done so.

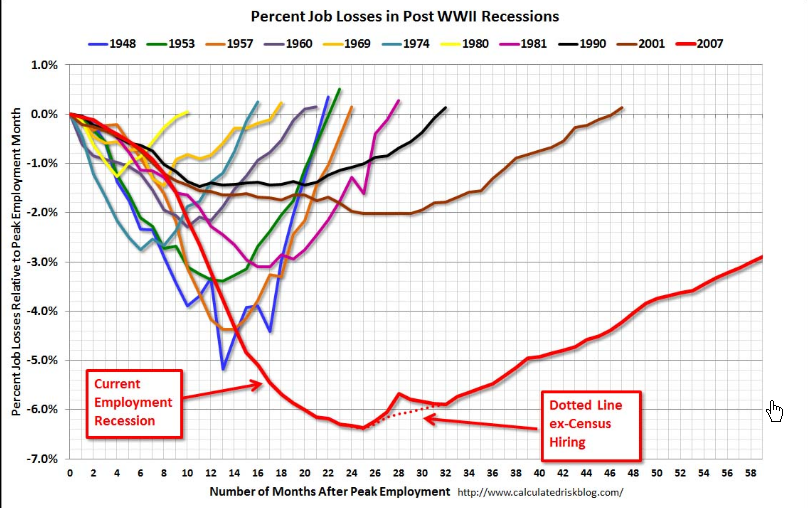
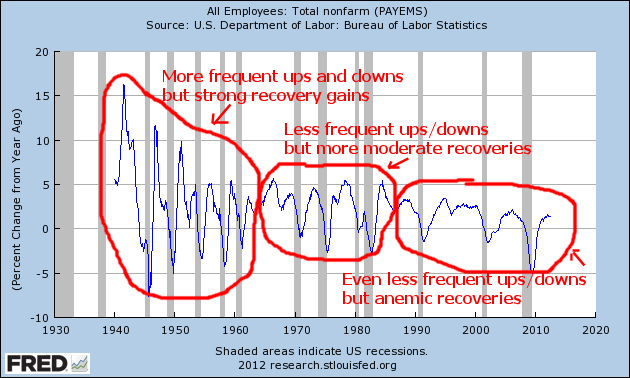
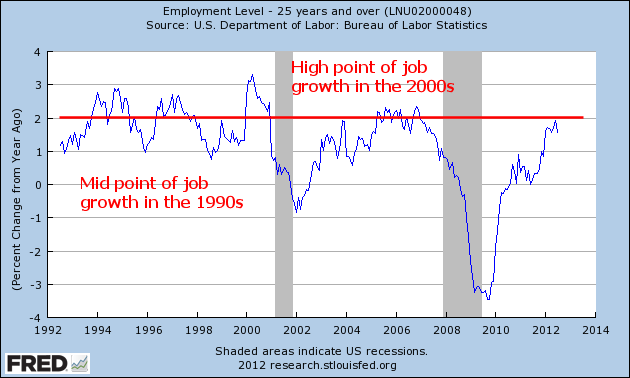
The graph is measuring the job losses from a previous peak; in the past two recessions those employment peaks before the recession took hold were largely caused by bubbles in tech and real estate.  I wanted to get a more reasonable baseline to measure change.  Below is a 75 year graph of the rolling five year average of employment in this country.  It dramatically shows just how weak the job market has been – depression era weak.

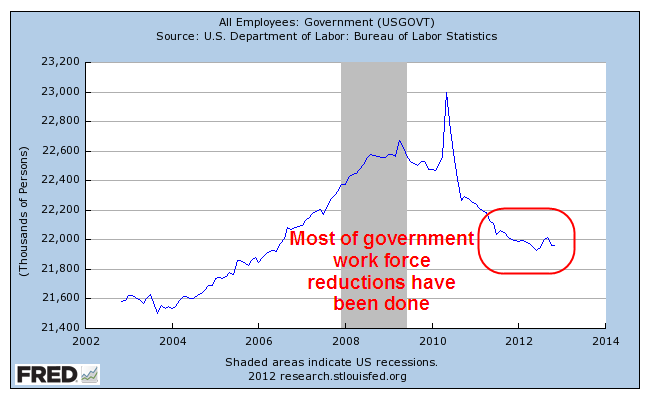
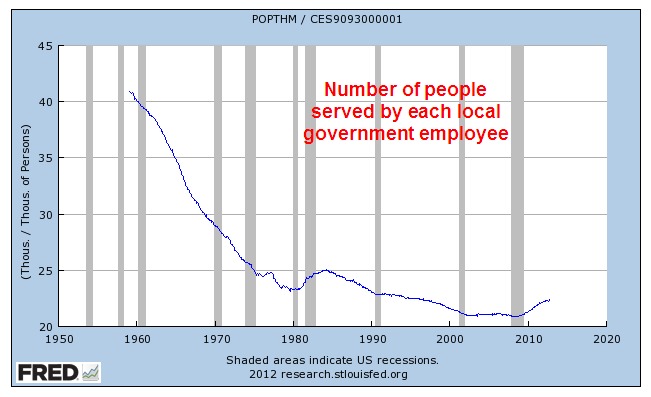
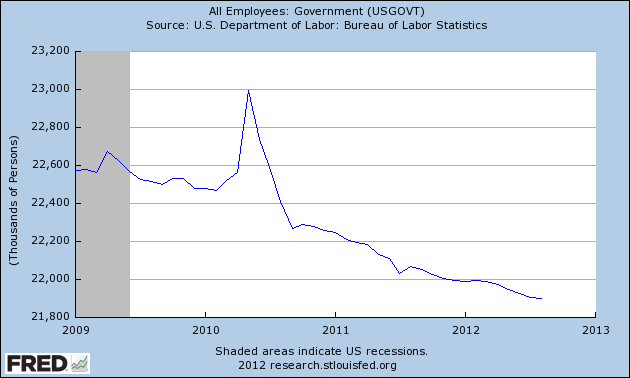
What surprised me in this past month’s report was the further loss of 13,000 jobs in the government sector.  I was expecting few job losses, even perhaps a small gain.  When we look a little closer, it gets interesting.  Since the beginning of 2010, 300,000 teachers, administrators and other workers in local government (these are primarily K-12 schools) have been laid off.

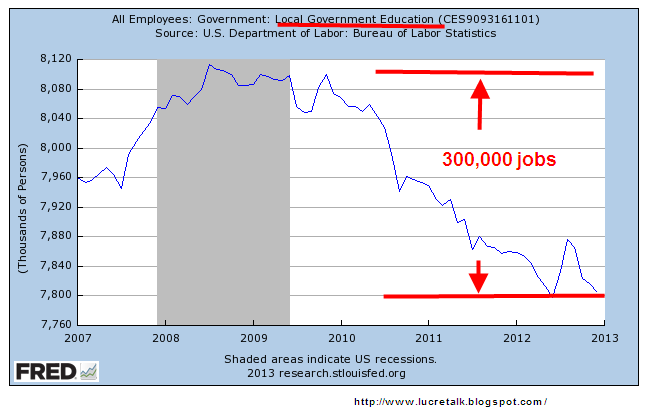
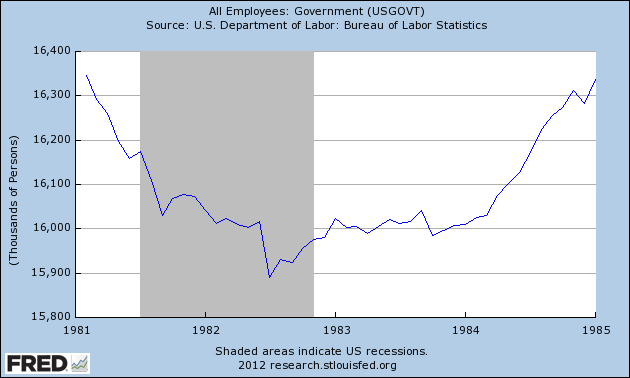
We would expect at least some layoffs at the state education level, which consist mostly of colleges, including community colleges, and universities.  Not so.  Employment has continued to rise.

As property valuations have decreased, so have the taxes based on those valuations.  The states have taken their share of the taxes and left local county, city and village authorities to wrestle with the budget challenges.  Many K-12 teachers have been laid off as a result.

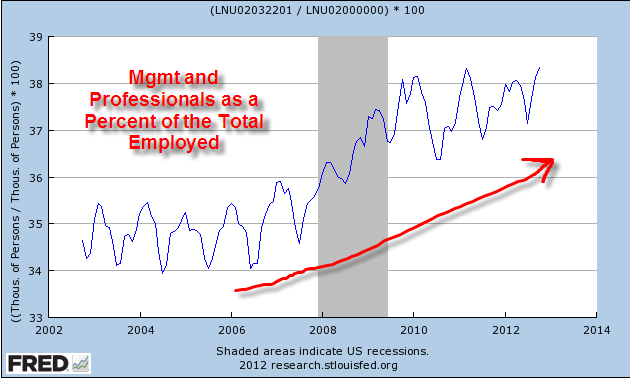
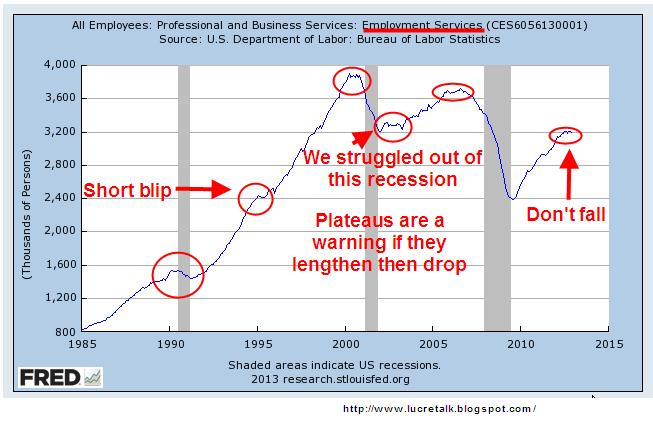
Now I’ll look at some cautionary signs.  Professional and Business Services has seen fairly strong employment gains and employment in this area has reached its prerecession peak.

There is one subcategory, Employment Services, that can often serve as a harbinger of weakness or downturn.  These are the guys whom companies hire to do the hiring.  When employment at these services weaken or fall, there may be something going bad in the fridge.

Another employment indicator is the maintenance and service of buildings.  When stores, industrial spaces and office buildings are vacant or slow, there is less to do.  Doing business takes some wear and tear on buildings.  Less business, less wear and tear.

This a truly historic downturn in both the economy and employment.  The lack of reliable, or at least comparable, data during the 1930s depression and earlier severe recessions make it difficult to do a proper assessment but we can say – to use a technical term – its a doozer.  When I hear someone comparing this recession to the 1980s and advocating, with the assertive crystal clarity that only the uninformed can summon up, that the same policies that got us out of the recession of the early 1980s will get us out of this extended recession, I know I am listening to a fool.  When I hear someone firmly pronounce that pumping vast amounts of federal money into the economy, the tactic tried with arguable success during the 1930s Depression, will solve the problem, that is the chatter of another fool.

The BUT Job Market

December 9th, 2012

The November Bureau of Labor Statistics (BLS) report released Friday surprised many.  Two days earlier, ADP, the private payroll firm that processes 24 million paychecks, released their estimate of private employment gains of 118,000 for the month of November.  Estimates of the BLS total employment growth were in the 80,000 range.  The reductions in government employment, which ADP doesn’t track, are largely over and don’t act as a drag on employment gains each month.

The reductions have been particularly heavy at the local level.  The number of civilians served by each local government employee has risen slightly since the official end of the recession in June 2009 but they are at relatively historic lows over the past five decades.

The thinking was that SuperStorm Sandy would have a significant impact on job growth in the heavily populated tri-state region of New Jersey, New York and Connecticut.  However, the BLS reported “our analysis suggests that Hurricane Sandy did not substantively impact the national employment and unemployment estimates for November.”  Huh???!!  The headline employment gains were 148,000, not enough to reduce the unemployment rate but enough to keep up with population growth.  The other headline number was that the unemployment rate had dropped to 7.7%, a drop of .2%.  Again, huh???!!

Given the circumstances, this was a good report – until one started diving into the numbers on the report.  Here it comes again – that big old BUT!  Another 200,000 workers dropped out of the labor force in November, and none – that’s right – none of them were older workers retiring.  Since November 2011, 2.5 million have left the work force; of those, one million are over 65.  Another 300,000 simply didn’t look for a job in the past month.  Some have gone back to school, whether by choice or the lack of it.

The ranks of the long term unemployed has dropped 200,00 in the past month, 900,000 in the past year.  Some have found jobs; some have run the course of their unemployment benefits and taken what they could get or given up.

Despite the recent rebound in housing, construction continued to lose jobs.

Leading gains were in professional and business services (43,000) and health care (20,000), both fields which have been steady gainers the past several years.  BUT, in the health care field, about 40% of job gains went to staff nursing homes.  

This trend will only get more pronounced as the Boomer generation ages and resource strapped elderly people and their families can not afford even temporary home care that might delay admittance to a nursing home.

Since the summer, businesses have been adding retail workers.  The graph below is seasonally adjusted so that the upward trend is more reliable.  Since June 2009, this sector has added 1/2 million jobs.  BUT – there it is again – many of these jobs are part time and pay below average wages.

The core work force, those aged 25 – 54, dropped last month and has gained only 200,000 in the past year.  How many sometimes think, “I would enjoy my kids more BUT I’m having difficulty keeping a roof over their heads.”

Employment gains of married men and married women have been flat in the past year.  Women head of households, ever resourceful, have gained 1/2 million jobs in the past year. 

Those aged 55 and over have seen job gains of 2 million in the past year; part of these gains are due to an age shift in the population; some is due to older workers continuing to work past their intended retirement.  Regardless of the causes, the trend is dragging down the economic recovery.  Older people simply don’t buy as much stuff as younger people do. 

Fans of the Silver Surfer – let’s climb on our galactic surfboards and rise high above space and time to look at the unemployment rate over the past several decades.  As the manufacturing sector has shrunk, the peaks and troughs of unemployment have risen.

The percent of unemployed workers who have been unemployed more than a half year also shows this disturbing long term trend.

The shrinking of the manufacturing sector, an inherently cyclical one, has had the positive effect of reducing the frequency of unemployment cycles.

2012 was the year that the first of the Boomers reached their full retirement age of 66.  Regardless of the health of the economy, we can expect to see the “Not in the Labor Force” number continue to rise as Boomers drop out of the labor force.  Since mid-2008, 3 million older workers have dropped out.

Each year about 2 million young adults graduate and enroll in college. (Census Bureau Source)  The other 2 million need some kind of work, either part or full time.  The level of unemployment has dropped by 50% for these new entrants into the work force but is still far above the 2007 level – a difficult job market is not a good way to start one’s working career. 

The delayed retirement of many Boomers will continue to put pressure on the job market with young adults particularly impacted.  GE is one company that is planning on bringing back jobs to this country from lower cost countries.  They cite two negatives that plague manufacturers in emerging countries: the lack of adequate patent protection and the theft of intellectual property. Two positives of domestic manufacturing are lower transportation costs and faster times to market.  Let’s hope that this repatriation of manufacturing becomes a trend – young people need the work.  The unemployment rate among those aged 18 – 19 has stayed above 20% for three years.

Power To The People

A moment to acknowledge the personal caring and effort of ordinary people, the courage and doggedness of first responders during the superstorm “Sandy” and a heartfelt sympathy for those who lost loved ones during the storm.  Mile long lines of cars waiting for gas brought back vivid and unpleasant memories of the 1970s when many of us who lived in NYC would get up at 4 AM just to wait in line for a few hours to buy gas so we could get to work.  Resilience and persistence are bred into many New Yawkers (that includes you guys and gals in Jersey, too).  The clean up and repair will test every ounce of both during the next year.  Some losses, of course, are not the kind that can be repaired, only endured with the support of family and friends.

                                                                  _________________

The October employment figures released two days ago showed an increase of 171,000 jobs this past month, about 50,000 more than expected and a welcome relief to the Obama campaign.  Retail and restaurant jobs posted strong gains and health care jobs continued their strong growth. 

More people started looking for jobs, bringing the unemployment rate up a smidge to 7.9%. The year over year percent change in unemployment is relatively healthy, as shown on the 60 year chart below.

This past week came a series of positive reports.  Consumer spending rose .8% in September and home prices continue to improve, showing a .5% monthly gain in the Case Shiller index of 20 leading cities.  Both of these indicators have shown recent strength but the year-over-year gains for both consumer spending and home prices is a plodding 2%.

Consumer confidence has shown strong improvement the past four months and is expected to have about the same positive sentiment level as last month’s survey. As I noted last week, the consumer has lately shown more confidence than the business community.  The Chicago manufacturing index dropped last month and is now at a stall speed.  Tomorrow the national manufacturing report will be released.  The manufacturing sector is certainly responding to the weakness in Europe and slowing growth in China and southeast Asia.

While the employment gains were welcome, there are too many negatives that continue to show.  We are barely keeping ahead of population growth.  Below is a chart showing an index of employment and population growth.  We are still down about 7% from the peak in late 2007, which was more of a bubble level of employment.  We could reasonably target mid-2004 levels.

The core work force of those aged 25 – 54 is showing a little upward movement over the past two years but is still anemic.

Most of the job gains are going to older workers above 55. “Get out of the way, pops!” may become the mantra of younger generations. 

The loss in production jobs leads to a continual increase in the proportion of management and professional jobs.

Hourly Earnings gains are flat out terrible, hitting an all time low.

There are still too many people working part time because they can’t find a full time job.

The number of discouraged workers is declining but is not healthy.

Retail sales, particularly auto sales, are an indication of rising consumer demand.

But after adjusting for population growth in the past decade, we have finally climbed back up to where we were 8 years ago.

To show the correlation between retail spending and employment, I’ve overlaid an index of one over the other.

As you can see, retail sales lead employment gains and losses.  I sincerely hope that retail sales will continue to improve and turn around the recent business pessimism.  My chief concern is the lack of competence and character in Congress on both sides of the aisle.  This coming election will do little to alleviate those concerns.

Labor Report and Debate

A less than forceful President Obama appeared in Denver this past Wednesday at the first of three debates in the closing weeks before the November elections. (The Secret Service was rather more forceful, mandating a shut down of the main north-south highway through town during the debate.)  Republican contender Mitt Romney showed more preparation and assertiveness but unfortunately left some of the facts behind in his hotel room.  Neither candidate can look the truth in the face.  Mr. Obama’s repeated claim that his economic plan saves $4 trillion uses many discredited (even by his sympathizers) gimmicks to arrive at that figure and yet he continues to trot out the assertion.  Mr. Romney really wants us to believe that Congress is going to jeopardize their jobs by taking away popular tax deductions in order to pass his 20% rate cuts.  Congress will pass the rate cuts, which are good for re-election.  Take away the mortgage interest deduction?  We’re not betting on it, Mr. Romney.  The end result of his tax plan and his pledge to increase military spending would be a $2 trillion deficit, double the annual deficit we are currently running.

Mr. Obama continues to pledge his support for the middle class, many of whom continue to slide down from the middle middle class to the lower middle class on their way to upper lower class and downright poverty.  Mr. Obama spent much of the debate consulting his notes on supporting the middle class as though he were teaching a class on the subject.  Note to Mr. Obama: you are no longer in the classroom.  This is the real world.

There are any number of fact checks on claims by both Mr. Romney and Mr. Obama during the debate.  Here is a fairly short summary from several Associated Press writers.

Then Friday morning, the heavens parted and the voice of – no, not God – the Bureau of Labor Statistics issued forth in their monthly pronouncement on the state of the job market: “The unemployment rate decreased to 7.8 percent in September”.

Throughout the country millions of pundits, economists and average Joes and Bettys stopped in disbelief and reached for their ear trumpets.  Had they heard right, they wondered?  Tweet, tweet, tweet went the twittersphere.  Blah, blah, blah went the blogosphere.  Lies, lies, lies went the right wing cons over at Fox and dance, dance, dance went the lefties at MSNBC.  For the first time in his presidency, Mr. Obama has seen the unemployment rate drop below 8%.

Had a large number of people simply given up and left the work force, causing them not to be counted as unemployed?  This has been a characteristic of the decline in the unemployment rate earlier in the year.  But not this month. 

Was the number of jobs created particularly strong?  Not this month.  At 114,000, job growth was not strong or weak and probably not enough to keep up with population growth.  A third of that job growth was in the health care sector.  A nation that continues to show its greatest growth in taking care of an aging and poorer population is not building a foundation for sound long term economic growth.

Many of the unemployed simply did the best they could do – get a part time job.  The number of involuntary part timers increased by more than a half million this past month. From the BLS Employment Release:

“The number of persons employed part time for economic reasons (sometimes
referred to as involuntary part-time workers) rose from 8.0 million in August
to 8.6 million in September. These individuals were working part time because
their hours had been cut back or because they were unable to find a full-time
job.”

There are good and bad trends that cause the unemployment rate to fall.  The two most problematic of the bad trends are 1) unemployed people simply giving up, and 2) involuntary part timers.  We have now seen both of these trends this year.

The steep drop in discouraged workers contributed to the decline in the unemployment rate.

“Among the marginally attached, there were 802,000 discouraged workers in
September, a decline of 235,000 from a year earlier. (These data are not
seasonally adjusted.) Discouraged workers are persons not currently looking
for work because they believe no jobs are available for them.”

Below is a 10 year graph showing the level of discouraged workers. (Click to enlarge in separate tab)

Another contributing factor was the revision in the number of net jobs gained in the two previous months.

“The change in total nonfarm payroll employment for July was revised from
+141,000 to +181,000, and the change for August was revised from +96,000 to
+142,000.”  Last month, many were scratching their heads when the BLS released their August report showing a dramatically lower number of jobs gained than reported by the payroll processing company ADP. It seems that some companies may have been too busy hiring to fill out and turn in their August BLS survey form.

Discouraged workers comprise part of a larger total of 6.4 million people who want a job but have not actively looked for one in the past 4 weeks.  A year ago, in Sept. 2011, the figure was 5.9 million.

Homebuilder stocks have been on a tear this year but construction employment, at 5.5 million, has barely budged in the past 3 years.

The core work force, those aged 25 – 54, continue to show some improvement but still have not reached the post-recession level of late 2009.

In the larger work force, aged 25 and up, the number of employed has risen almost to pre-recession levels, indicating that there are more older people continuing to work when they can – at full or part time jobs. 

As the population ages, so too does the work force – a natural demographic change.  But older workers are not stepping aside for young workers just entering the work force.  Those who can work do so to compensate for the lackluster growth or decline of retirement funds and declining property values, the two chief sources of wealth that a person builds over a lifetime of work. Below is a graph of workers aged 55 and older.

The number of hours worked per week edged up slightly – a good sign.  But – “over the past 12 months, average hourly earnings have risen by 1.8 percent, ” the BLS report notes, indicating that family earnings are just not keeping up with inflation.

On the bright side, we are doing better than much of Europe which is probably already in recession.  Returning to the topic of debates, did we hear either candidate offer a recovery plan for … not this past recession but the one that will probably occur during the next Presidential term.  “What!!!???” you say, “we haven’t even gotten out of this past recession!”  The law of averages, like the law of gravity, is a pesky, problematic force of nature.  The 1960s and the 1990s are the only two decades in the past century where we did not witness a recession within an eight year period (Source), yet few Presidential candidates dare to discuss the eventuality of such a thing.  Even the Congressional Budget Office does not factor in recessions to their ten year budget projections unless the recession is ongoing.  As the Presidential contender, Mr. Romney must play the part of the man with a plan.  After four years, Mr. Obama probably understands that “hope and change” is little more than rousing rhetoric; that the President must steer the raft through dangerous currents without capsizing or losing any passengers, while the other political party rocks the raft enough to make his task even more difficult.  Should Mr. Romney win the Presidency, he will discover the same sobering truth.

We Are Young

There are many conflicting opinions and studies regarding the effect that the minimum wage (MW) has on employment, particularly the employment of teens who often work at jobs that pay MW.  Some studies show an increase in employment of teenage workers after the MW is increased.  Some show a decrease, some show no change.  A 2006 paper by two economists at the University of California reviewed early studies of MW prior to 1982 and those after 1990.  Methodologies, correlations and conclusions in one study are criticized in another study.  Reading just the first six pages of the 150 page paper will give you a sense of the arguments.

How many people does the MW affect?  Is it only those making the MW or does it also include those making just above MW?  What is the effect on the local economy as well as local employment?  Whatever you want to claim about MW, you can probably find a study in this area that will backup your claim.  What we can know for certain is that the MW has declined in real dollars over the past 50 years.  Using MW data  from the Dept of Labor and a CPI calculator from the Bureau of Labor Statistics, I have graphed the minimum wage in both current dollars and real inflation-adjusted dollars.

From 1963 to 2012, the MW has fallen 17%.  The unemployment rate for teens aged 16 – 19 stays stubbornly near 25%.

The unemployment rate for those aged 20 – 24 years has been steadily declining since late 2010 but has ticked up in the past few months.

Low wages and high unemployment breed a sense of futility in young people entering the work force.  During the late sixties and early seventies, the prospect of being drafted into the Vietnam War prompted many high school male graduates to go to college to gain a student deferment from the war.  Almost fifty years later, this generation of high school graduates – both men and women – feel the pressure of having to go to college to escape the bleak job prospects of this labor market.  As I wrote last week, older people are continuing to hold onto jobs, making it doubly difficult for young people entering the labor market supply chain.  Few young people can comprehend the multi-decade generational employment mechanism.  In our late teens and early twenties, we first step on the slow moving employment escalator, gaining experience, knowledge and judgment as we work for relatively low wages.  During our working years we build our skills and the amount of money our labor can command.  For too many young people waiting to step on this job escalator, the escalator is broken.  Each year more young people gather at the base of the escalator and wait. 

Labor Report – August Doldrums

This past Friday, the Bureau of Labor Statistics (BLS) released their monthly report for August and the employment gains of 96,000 were below the already muted expectations of 120,000 jobs gained.  Many economists estimate that it takes 150,000 jobs per month just to keep up with population growth.  On the day before the BLS report, the large payroll processing company, ADP, released their estimate of 201,000 private job gains in August, leading some to speculate that total job gains for the month would be above 150,000.  As you can see below, the BLS and ADP counts of private employment closely track each other. (Click to enlarge charts in a separate tab)

On Thursday afternoon before the Friday morning release of the BLS report, the White House is notified of the numbers.  The disappointing numbers may have led President Obama to tone down the rhetoric of his speech that evening at the Democratic National Convention.  He did not seem to have the “fire in the belly” when he delivered his acceptance speech.  The unemployment rate ticked down from 8.3% to 8.1% because 368,000 dropped out of the work force and are no longer counted as unemployed.  Some of this number retired, either voluntarily or involuntarily.  Some have simply become discouraged.  Some have gone back to school.  The average number of weeks of unemployment is still at high levels. 

Some of this is due to changes in BLS reporting since Obama took office.  Before January 2011, the BLS allowed a maxiumum of 2 years, or 104 weeks in their survey.  Starting in 2011, the BLS allows a maximum of five years, or 260 weeks.  Since a small number of unemployed forces the average number higher, the BLS recommends using the mean for comparison. (BLS Source

Most of Europe is in recession; growth in South America, China and India have slowed.  Several strong economic reports in the winter and spring of this year led many to think that the U.S. economy might be less tethered to this global malaise.  The stock market rose over 10% in the first few months of 2012; then China reported contracting manufacturing and real estate sectors, and European leaders showed their continued inability to resolve the fiscal and monetary policy challenges that threaten to crack the European Union.  We realized that we were not immune to the global financial flu and the stock market fell 10% in May, wiping out the gains of the winter and spring. The monthly employment gains dropped during the summer.

Recent employment and industrial reports have showed that our growth, while still positive, is struggling.  Private job growth has been hampered by the layoffs of government workers, as the chart below shows.

The shedding of government jobs halted this past month as Federal employees actually gained about 3,000.  Those on the left have criticized the Republican House for aggravating job losses in state and local governments by blocking any further federal aid to the states.  A comparison with the first term of the Reagan administration shows a similar decline in government employment during the 1981 – 1982 recession.  However, following the end of the recession, government employment increased in the last two years of his first term and helped Reagan get elected to a second term.  The Democratic House was kinder to Reagan than the current Republican House is to Obama.

The slow growth of the past several months has fueled speculation that the Federal Reserve will once again come to the rescue with a bond buying program.  Since the beginning of June, the stock market has “melted up” on very low volume.  Once again, it is at the peak reached earlier this year and in 2007 before the recession began.

The uninspiring lack of job growth among what I call the core labor force, those aged 25 – 54, is a predictor of a sluggish economy in the near future.  These workers buy a lot of stuff. No jobs, no stuff.

The larger group of adult workers, those aged 25 plus, continues to show gains, indicating that older workers are continuing to keep and get jobs.  The old are simply not making way for the young.  Severe declines in house values and the loss of value in their retirement funds has forced many older workers to continue working longer than they may have planned.  Older workers do no buy a lot of stuff.

During the 2010 elections, Republican candidates for the House promised that job programs would be first priority.  We have been waiting two years.  Both houses of Congress have historically low voter approval ratings yet the burden of the sluggish job growth continues to fall on the President’s shoulders.  Politicians on the Republican side of this dysfunctional Congress point to the President as the cause of the muddle through labor market; they know most voters can’t remember what they learned in civics class in grade school and don’t understand that it is Congress, not the President, that initiates legislation.  It is Congress, both Democrats and Republicans in the House and Senate, that is responsible for the lack of job growth.  Who elected these men and women to the Congress?  Look in the mirror.  That’s who’s responsible for the slow job growth. 

The Job Growth President

Both incumbent President Barack Obama and Republican challenger Mitt Romney are making the case to American voters that each has better policy answers for future job growth.   Obama touts total job gains of 4+ million jobs since the recession ended.  Romney points out that this is less than half of the 9 million jobs lost since the end of 2007.

An economy is a dynamic resolution of the tension between supply and demand among all the people, companies and governments that participate in that marketplace.  Obama’s approach focuses on the demand side of the economy and believes in government borrowing and spending to temporarily take up the slack in private sector demand. The stimulus of government spending is supposed to both support and kickstart demand in the private sector, particularly consumer demand.  The fault of focusing on the demand side of an economy is that “demand-siders” presume that the supply side of the economy will naturally increase production to meet the sustained or increased demand.  In 2009, the Obama administration, together with a Democratic House and Senate passed a stimulus bill that included a lot of money for sorely needed infrastructure projects.  Democrats, most of them demand-siders, simply assumed that there would be a number of “shovel-ready” projects on the drawing board, projects that would employ construction workers laid off during the severe housing decline.  Since demand-siders do not pay as much attention to the process of producing or constructing something, they were dismayed that there were so few such projects ready to go.  Decades of labor, environmental impact and traffic impact regulations had dramatically increased the planning time required for many highway improvement projects.  At a meeting with his council on stimulus planning, Obama commented wryly, “Shovel-ready was not as shovel-ready as we expected.”

Romney’s approach focuses on the supply side of the economic dynamic.  “Supply-siders” believe that the government’s role in the economy should be limited; that government should remove many regulatory barriers and hinderances to the producers of economic goods and services.  The fault of this approach is that it presumes that consumer and inter-business demand will naturally increase as producers are able to make more goods and products available at a cost that has been lowered by the removal of hurdles to production.  The producers will hire more workers, will buy goods and services from other businesses who will hire more workers;  demand will inevitably increase which will support and stimulate more production.  Many adherents of the supply-sider hypothesis believe that defense of the country is a government’s primary proper role.  They advocate a large amount of military spending but regard taxation as a barrier to production.  These two competing and antagonistic ideas – more military spending, less tax revenue per dollar of economic activity – has resulted in large budget deficits which contradict the professed fiscal frugalness of many in this ideological camp.  Libertarians advocate a more consistent supply-side philosophy, arguing for lower military spending in addition to reduced government spending on social programs. 

Demand-siders argue that workers are both producers and consumers.  Supply siders contend that workers are consumers but not producers; workers are a cost of production.  Demand-siders focus on domestic civilian consumption.  Although supply-siders do not focus on consumption, they do emphasize military consumption.

Who is right?  Both of them and neither of them.  The political discourse and election structure aims to separate people into ideological and emotional teams; over the past decade many politicians who were less polarized in this debate have lost their seats.  A hundred years ago, this country began a transition away from party leaders picking candidates for national office to a primary system whereby voters would choose candidates.  In the two decades after World War 2, our political system made a complete transformation to a primary system, which has produced two increasingly polarized political teams.  A small group of voters in each political camp now elects the candidates for national office; in the last presidential election, less than a 1/4 of registered voters voted in the primaries.  We have traded a system where party bosses in a backroom picked candidates to one in which a small contingent of passionate people pick candidates.  We need a new system.

In his “Believe in America” plan Romney asserts that his policies will foster stronger job growth. (Long version and Short version).  They include reducing the corporate income tax rate, more free trade agreements, more oil and gas leases, reducing federal retraining programs and a 5 percent reduction in non-defense discretionary spending, a relatively small reduction in federal spending of $20 billion, or 1/2 of 1% of total federal spending. (Discretionary spending is government spending which excludes those social programs like Social Security and Medicare and Medicaid whose spending is on “auto pilot”).  Romney’s proposals are consistent with a supply-sider philosophy.

Beginning with the conventions in these next few weeks, both political campaigns are about to go into full court press during the remaining days before the election in November.  Each candidate will argue that their approach will foster job growth.  What neither candidate will tell us are some of the complexities that continue to trouble economists who study the labor market.  Why has job growth been rather anemic during the recoveries of the past thirty years?  Below is a chart of the year-over-year (yoy) percent gain in employment.

Notice two changes in the pattern:  the frequency of job losses has decreased but so have the employment gains during recoveries.  Economists at the Federal Reserve have analyzed the factors for this long term trend and concluded: “The analyses discussed here suggest that weak labor demand is the primary explanation for prolonged unemployment duration observed in the recent recession and recovery. The weak recovery of employment is similar to the jobless recoveries that followed the 1990–91 and 2001 recessions. This suggests that the labor market has changed in ways that prevent the cyclical bounceback in the labor market that followed past recessions. ” (Source)  The authors of the study analyze and isolate several factors to account for the change, including changes in how the numbers are reported, the longer duration of unemployment benefits, and the reduced manufacturing production in this country which would respond quickly during recoveries and recall laid off workers.  Weak labor demand is the chief culprit of anemic job growth and the lengthening duration of unemployment.  Why?  In the past thirty years, underdeveloped countries in Asia, India and South America are now offering a ready supply of un-educated or moderately educated workers.

The increase in the global labor supply is a particularly challenging problem because it is accompanied by an increase in productivity; i.e. less workers are needed to produce a unit of something.  Obama’s answer to this problem is more government support for educating young people and retraining those in the workforce whose skills are not suited to the changing demands of producers.  Obama has essentially given up on jobs for low and moderately educated U.S. workers other than government spending on infrastructure projects.  He hopes that American workers can command more of the global market for highly skilled workers. 

Romney wants to reduce federal retraining programs for workers and turn that task over to states.  He hopes that, somehow, someway, businesses with lower production costs will hire more workers.  More oil and gas drilling will employ more moderately educated workers but even Romney knows that these job gains are modest relative to the entire labor market.  More defense spending will employ workers in defense industries but many of those jobs require higher skills; lower skilled workers will benefit as a consequence, as part of an economy that supports defense contractors and military bases.  Increasing the number of soldiers reduces the number of available workers and reduces unemployment.

Neither candidate proposes to address an intractable problem:  too many workers around the globe.  Below is a chart of the y-o-y change in the number of people employed.  Due to a glut of workers, the structure of the labor workforce in this country is inherently weak.  The chart below shows the drastic drop in employment.

A winning economy, like a top-rated tennis player, blends strategies.  Politicians and players that strictly adhere to a school of thought or a school of play lose out to those are able to see and employ the benefits of differing strategies.


Unemployment Measures

When the Bureau of Labor Statistics (BLS) issues their monthly labor report, the headlines quote an unemployment rate and the number of jobs gained in the past month.  In addition to those headline numbers, a newspaper article may cite a Civilian Participation Rate, the number of long term unemployed, discouraged workers, etc.  To the casual reader, all of these numbers swirl around, making it difficult to see a clear picture.  Below is a pie chart breaking down the approximately 313 million people of the U.S. into various segments. (Click to enlarge in separate tab)

When you read about the Civilian Non-Institutional Population, it is all the people in the country except for those who are under 16, in the Armed Forces, a nursing home or prison.   A better term might be “non-restricted”, i.e. those who are, by definition, free to choose whether they want a job or not.  “Persons not in the labor force combined with those in the civilian labor force constitute the civilian noninstitutional population 16 years and over. (There is no upper age limit.)”  (BLS Source )

This population number becomes the divisor (the bottom number of a fraction) for the Civilian Employment Population Ratio (EMRATIO), which calculates the percentage of employed people to the Non-Institutional Population.

When you read “Civilian Labor Force” that means “”The sum of the employed and the unemployed constitutes the civilian labor force” (BLS Source)

When you read about the unemployment rate, this is the U-3 employment rate.

Sometimes you will read about the “true” or “real” unemployment rate, although often the speaker or author can not define what is “true” or “real”, showing a lack of knowledge about the various employment rates.  What they are usually referring to is the U-6 unemployment rate, which includes discouraged workers and those who are working part time because they either can not find a full time job or business is slow and their hours are reduced.

A casual reader of American History will remember the WPA, a government project that put up to three million people to work during the 1930s.  Projects included the Hoover Dam, Grand Coulee Dam, the Lincoln Tunnel linking Manhattan and New Jersey, Carlsbad Caverns, the Great Smoky Mountains National Park and public buildings throughout the U.S.  But who knew that a large part of the unemployment report itself was a WPA project begun in 1940? (BLS Source)

Adults Wanted

The end of another month ending involving billing customers, paying taxes, balancing the bank accounts and closing the books.  Each month it becomes apparent that one of the reasons why there is not more robust job creation is the “invisible” employee costs, both in dollars and in the business owner’s liability.  By invisible, I mean that these costs are typically out of sight and out of mind to most employees.  These costs are quite visible to the owner who, failing to account for them in their business pricing, soon goes out of business.

These costs were designed to be invisible to employees because if most employees knew all the costs, some politicians might lose their jobs.  A paycheck with a gross amount of $1000 might have $200 or more taken out for taxes and health care premiums.  The net amount of the paycheck is $800, which is what we get to spend on bills, rent/mortgage, food, transportation and a movie. We grouse about the $200 in taxes but that $200 pales in comparison to the invisible costs that don’t show on that paycheck stub.  Most of these costs are mandated by either Federal or State law and include Workmen’s Compensation insurance, Unemployment Insurance, Liability Insurance, and Social Security and Medicare taxes (employer’s half).  The cost of these mandates goes into neither your pocket or the employer’s pocket. Benefit costs include health insurance, retirement contributions, education reimbursements, vacation and sick pay.  Mandated costs and benefits can easily add $500 to $1000 in cost to that $1000 gross paycheck amount.  In addition, there are indirect costs which include office and production equipment, rent, utilities, and transportation, as well as the internal costs of accounting, supervision, and training.  After those costs, that $1000 gross paycheck can have a final cost of $2500 or more. 

The indirect costs are simply a part of any business; they are the costs of producing a dollar of revenue to the business.  My chief concern is the invisible insurance and tax mandates whose costs are hidden from employees.  By making the employer, not the employee, responsible for the payment of these costs, politicians could more easily sweep them under the rug.  Some people strongly object to the health insurance mandate but how many protest or are even aware of the Unemployment Insurance mandate or the Workmen’s Compensation Insurance mandate?  Many are not aware simply because the cost is paid by the employer.  While the employer may write the check, the employer “deducts” the cost from the employee by lowering the gross amount that they can pay to an employee.

I am not making a case against these insurances and taxes that add a safety net for workers.  What I do object to is the surreptitious way that lawmakers have enacted them in order to hide the magnitude of the costs of these safety programs.  Because these mandates are structured as a payment from the business and not the employee, Workmen’s Comp, Liability, and Unemployment Insurance are rated based on the company’s industry classification and claims history.  An employee who has worked twenty years without an accident is charged the same amount of money as his/her co-worker who does not pay attention to safety regulations and common sense.  The same holds true for liability insurance; a thoughtful employee and a careless employee pay the same amount.  In some construction industries, Workmen’s Comp and Liability insurance can be 20% or more of gross pay – not a trivial amount.  Should a careless driver and an accident-free driver pay the same amount in auto insurance?  Of course not.  Yet that is how Workmen’s Comp, Liability and Unemployment Insurance are rated.  Since there is no individual worker history, no individual experience rating, there is no direct cost tied to a worker’s actions.  An employee can become naturally divorced from the consequences of their actions.  Often an employer will not add another employee if they are not sure whether he/she will be able to keep them on six months from now.  The reason is that many, if not all, states will increase the unemployment insurance rate for that business when the employee is let go in six months and files for unemployment insurance.  It can be more cost efficient for an employer to pay some overtime to existing employees to make up the extra work till the employer is sure that business volume is on the increase. 

Unlike the other insurance mandates, the health care mandate at least makes individuals personally responsible for their own insurance.  With no direct responsibility for their own Workmen’s Comp, Liability and Unemployment insurance, employees are effectively treated, in the eyes of lawmakers, like teenage children.  A host of state and federal employment regulations only confirms that status.  In the eyes of our laws,  employees are not quite adults.  Employers are treated by state employment agencies as though they were the parents of not quite fully responsible teenagers and the burden of proof is on the employer to show that the employer complied fully with regulations.

How did we get here?  During the second World War, the Federal Government was running up extremely large war costs and experiencing severe cash flow problems.  One problem the government had was that tax payments were not due till March 15th of each year (in 1954 the date was changed to the current April 15th), which meant the government had to borrow a lot of money each month.  Many people were not paying all of their taxes, either income or the Social Security tax enacted several years prior.  The problem of collecting delinquent taxes presented yet another costly headache for the government.  A noted economist of the time, John Kenneth Galbraith, suggested a solution last used eighty years earlier during the Civil War:  make employers withdraw the taxes before they paid their employees.  This would both solve the problem of timely collection of taxes and curb much of the delinquency.  It would be much easier for the government to go after the far fewer businesses in the country than millions of individual taxpayers.  Thus the withholding system was born again. (A history of taxes)

Once the mechanism of withholding was in place, politicians realized what a boon this was.  Taxpayers dislike taxes and the politicians who enact them. Politicians could now increase existing insurance costs and mandate new ones without the taxpayers – the voters – constantly being reminded of these now invisible costs.  Politicians simply had to change the law, then notify a relatively small number of businesses to pay more.  That created a new problem for business owners.  Politicians had effectively deflected the disapproval of voters onto employers.  When an insurance cost goes up, it is difficult for an employer to say to an existing employee that the employer will have to reduce an employee’s hourly wage or salary to make up for this increased cost.  For subsequent hires, an employer can reduce the hourly wage or salary that they will offer to a new employee.  The employer has two alternatives:  raise the price it sells its product or service; or eat the increased cost.  Employers complain about this state of affairs long and loud. They form trade groups and lobby their state legislatures.  The politicians get the better of a bad situation:  listen to loud protests from a lot of voters and possibly get thrown out of office or have to listen to a relatively few employer lobbyists.

I am not advocating the abandonment of the withholding system, which does solve the problem of timely tax payments.  I am advocating for a system that directly charges those who are going to benefit from the safety net that exists – the employees.  This is no longer the paper and pencil age of World War 2.  Digitized records would enable most state and federal agencies to assign individual ratings to employees based on their history.  A new or existing employee presents their individual rating for various types of insurance to the employer and the employer deducts the amounts and sends to the appropriate agency, just as they do now.  The difference is that the employee gets to see what he/she is being charged for and might in some cases be able to control some of those costs.  Instead of being paid $20 an hour, an employee might be paid $34 an hour.  The cost to the employer is the same.  For many of these mandated costs, the tax write offs to the employer are the same; it is a cost of producing business income.

What can we do about it?  Press your elected representatives for individual ratings for these insurances.  An employee who has never filed for unemployment insurance pays the same as a person who has collected six months of unemployment insurance last year.  Does that seem fair?  Why have an employee half and an employer half of the Social Security and Medicare tax?  It all comes out of the employee’s pocket in the long run.  Why the game of hiding the costs?

Imagine a world where an employer can have a bit more sales volume, hire an employee and let them go if sales subsequently fall off.  An employee who is let go would then make the choice of whether to collect unemployment.  They might absolutely need the unemployment insurance and that would affect their individual unemployment rating the same as it does when we file an auto insurance claim.  They might try harder to get another job or switch to a different job in order to keep their individual unemployment rating pristine.  It would be the employee’s choice.

Imagine a world where the employee controls what they put away for retirement.  If you want to put away $6,000 a year tax free into a 401K retirement plan, why shouldn’t you?  Why have the charade of the employer matching your contribution by some percentage?  How did we get to the point where employee compensation is a haunted house of smoke and mirrors?  

Imagine a world where an employee is not bound to an employer for insurances and benefits and tax benefits.  Imagine a world where the employee has choices.  Imagine a world where the employer pays the total of the employee cost to the  employee and the employee then sees the true scope of deductions.  In fact, we do have that world now.  Employers are increasingly using subcontractors and temporary agencies as a way to sidestep the burdens of employment.  From the BLS July Labor Report: “Temporary help services has recovered 98 percent of the jobs lost during the most recent downturn.” (Source).  Tell your state and federal representatives that you would like a different world – one in which you are treated like an adult.

Labor Report – July

Skipping into the Oval Office Friday morning, President Obama’s campaign manager called out with glee, “Mr. President, 163,000 jobs!”
“Buy, buy, buy!” traders shouted on the floor of the N.Y. Stock Exchange.
“Let’s take a six week vacation!” John Boehner, the House Speaker, cried out.
Concentrating on the .1% uptick in the unemployment rate, Presidential contender Mitt Romney said, “the president’s policies are to blame for not having gotten the economy back on track.”

What to make of these conflicting numbers?  Economists and market watchers were anticipating a gain of 100,000 jobs.  Economists guesstimate that a growth of 150,000 jobs per month is needed to absorb the increase in the working population.  163,000 is above 150,000; so how did the unemployment rate tick up from 8.2% to 8.3%?

The headline job gain number comes from the Current Employment Statistics program, a monthly survey of 141,000 businesses and government agencies that represent almost a half million worksites.  This “Establishment Survey”, as it is sometimes called, counts jobs, not people.  The addition of two part time jobs will count as two jobs even if only one person is working those two part time jobs.  Not all businesses return their survey forms to meet the monthly deadline so the Bureau of Labor Statistics (BLS) estimates the results and this first estimate becomes the headline number that gets so much attention from the market and political pundits.  The following month the BLS issues a 2nd estimate, followed by a 3rd estimate a month later.  The chart below shows the differences between the 3rd estimate and the first estimate (BLS source ).  As you can see, the revisions can be substantial. (Click on graphs to open in a separate tab)

On September 2nd, 2011, the BLS released their August report showing a gain of 0 (zero!) jobs.  The stock market sank 2.6%.  The 3rd estimate, released in November, showed job gains of 104,000, not 0!  The BLS will further revise the job gains for a particular month as state unemployment reports and other data becomes available to the BLS.

These job gains are seasonally adjusted.  One of the seasonal adjustments for July is the customary shut down of auto factories in July.  This year, in response to demand, auto manufacturers did not shut down their factories but the BLS makes the adjustment regardless.  Several analysts reason that this seasonal adjustment accounted for about 25,000 of the 163,000 jobs gained.  Despite all these shortcomings, the CES is regarded as the more accurate count of jobs.

The unemployment number comes from a separate monthly survey of 60,000 households conducted by the BLS.  While the Establishment Survey does survey small businesses, it misses a good chunk of the really small businesses, the mom and pop operations, that form an important backbone of the economy.  The Household Survey is often thought to overestimate the total number of jobs in the economy but it gives a detailed picture of the workforce and the unemployed.  From this survey we learn of the age, racial, and education characteristics of the employed.  Each month I look at two aspects of this survey: the growth or decline in what I call the core work force, those aged 25 – 54 years old, and the larger workforce aged 25 and older.  The actual number doesn’t matter as much as the increase or decrease in the adult work force – the trend in job growth.

The graph below charts the year over year percent gain or loss in the core work force.  It is still positive, leveling off after climbing up from negative territory a year ago.

For a bit more perspective, let’s zoom out and look at the past 20 years.

A graph of the year over year percentage gains in the larger work force aged 25+ shows that we have just about reached the high point of job growth during the 2000s.  We would need to at least maintain this level of growth to make up for the job losses during this past recession.  We would like to see job growth more like those we experienced during the high tech boom of the 1990s but the investment in new technology during the 1990s was particularly strong.  A catalyst for such a fundamental growth in the economy is not on the horizon.

The market experienced what I think is a relief rally on Friday.  Persistent troubles in Europe, a slowdown in the growth of China and other Asian emerging economies, lackluster employment reports for May and June, and a tepid 1.5% GDP growth in the second quarter had spread fears of a coming double dip recession. Had the BLS issued a job gains estimate of 50,000, for example, the market would have probably declined 2+%.  Back in April of this year, I wrote about an employment indicator that has been a reliable predictor of recessions.  When the percent change in the unemployment level crosses above zero percent, it’s time to get into the storm cellar and batten down the hatches!

-1% is an indicator of a rebounding labor force midway in a recovery from a recession.  I’ve marked up a thirty year chart of the year on year (y-o-y) percent increase/decrease in the unemployment rate to show the trend.  Had we not shipped so many jobs to China after they joined the World Trade Organization in 2001, we might have had the spurt of job growth recovery that we experienced in the early eighties. 

As the chart below shows, that kind of strong post-recession job growth is not the norm.

Larry Kudlow, a CNBC host, and other “supply sider” pundits are presently making the case that Presidential contender Mitt Romney will usher in a new era of the same kind of unusual job growth we experienced in the 1980s.  Anything is possible, of course, and hosts of financial shows make their money by making headline predictions.  Those of us without a TV show must pay more diligent attention to the law of averages, to the probable, not the possible. That law of averages makes it unlikely that either a President Obama or a President Romney will achieve historically unusual declines in unemployment.  In Britain the slow news months of summer are called the “silly season”.  In these few months before the election, Americans will experience a truly silly season, not for the slowness of news but for the sheer deluge of outlandish and annoying political ads making accusations and far-fetched claims. After that silly season will come another silly season, the Christmas shopping tournament!