Four Foundations

Over the next two months, there will be much debate over spending cuts as the debt limit ceiling approaches in late February.  For the past four years, the Federal Government has been running $1 trillion annual deficits.

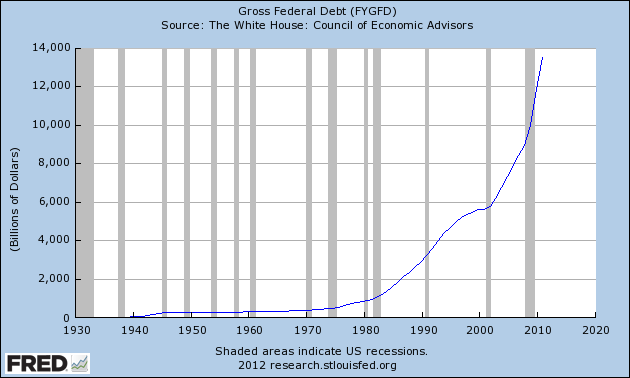
Deficits are the annual shortfall; debt is the cumulative amount of those annual deficits.  The total debt of the Federal Government, including money owed to the Social Security trust funds, is over $16 trillion, and is now more than the annual GDP, the sum of all economic activity in the country.

Republicans contend that the real problem with the budget is entitlement spending: Medicare, Social Security and Medicaid are the largest programs.  In the past ten years, spending on these three programs has almost doubled and now consumes 47% of the total Federal spending budget.

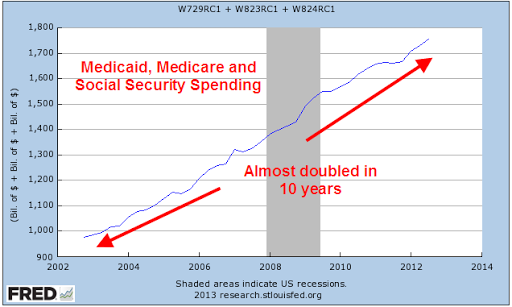
Spending increases on these programs will escalate now that the first wave of the Boomer generation has reached retirement age.  Too many rigid ideologues in the Democratic Party defiantly defend every penny of this spending.

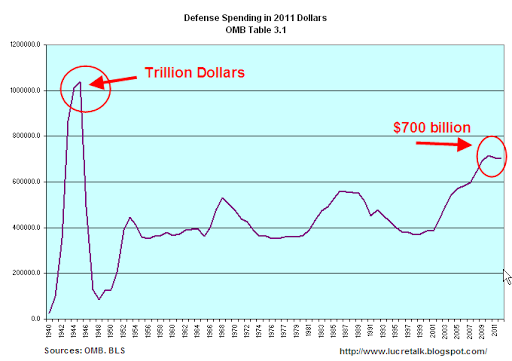
On the other hand, defense spending is near WW2 levels.  On an annual basis, the current $700 billion we spend on defense is far less than the inflation adjusted levels of $1 trillion we spent at the height of WW2.

Wars may be won or lost at their peaks but the spending occurs over several years.  When we look at a moving five year average of defense spending, we are near the average of WW2.

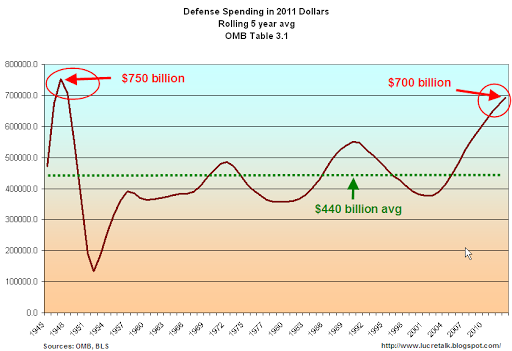
Judging by the amount of money we are spending, we are fighting the third World War.  Yes, it’s a dangerous world but is it as dangerous as the state of the world during WW2?  Has Al-Qaeda, a loose coalition of stateless forces, subjugated Europe as Hitler’s armies did?  Is the threat of Iran comparable to the domination of Japan over the eastern seaboard of Asia during WW2? 

In the late 50s, President and former General Eisenhower warned that the military industrial complex would invade the halls of Washington.  Preparedness is prudence, but Eisenhower knew firsthand that the industry peddles a self-serving culture of fear to those in Washington.  As high military spending becomes entrenched in the federal budget, regions of the country become dependent on the defense industry; those people send  politiicans to Washington to vote for more military spending and the spending cycle spirals upwards.

Each year, we are spending about $250 billion more than the 70 year average of military spending.  Unlike the spike of WW2 spending, the recent five year average has surged upwards like a wave – a wave that is drowning this country in debt.  As troubling as this is, we must remember that we are running $1 trillion deficits – four times the excess amount of military spending.  Those who say that we can balance the budget by cutting defense spending simply have not looked closely at the data.  We can not balance the budget by cutting only entitlement spending or only defense spending.  Even when we combine the two, we still can not balance the budget.

Which brings us to receipts, a gentle euphemism for taxes.  Economic bubbles inflate the amount of tax revenue to the government but the resulting lack of revenues after the bubble bursts outweighs the increased revenue while the bubble was building.

When we run a projection of revenues using more sustainable averages based on longer term trends, we come up with an optimized $3 trillion in revenues for the current year, still leaving us $600 billion short of current spending. 

The solution then is a mix of four factors: more revenue from 1) economic growth and 2) tax reform; less spending for both 3) defense and the 4) social safety net.  These are not easy choices, particularly when partisans vigorously defend a particular program as though it were the last stand at the Alamo.

The BUT Economy

December 9th

An eventful week in what I will call the BUT economy:  GDP revisions, Corporate Profits, Consumer Confidence and the Labor Report.  Let’s get into it!

At the end of last week, the Commerce Dept issued their customary revisions to 3rd quarter Gross Domestic Products (GDP).The first number that came out in October was a preliminary estimate.  As more data comes in, the Commerce Dept. revises its figures, and will have another revision in December.  From the initial estimate of 2.0% annualized growth, the Commerce Dept revised 3rd quarter GDP growth up to 2.7%, below the historical average of about 3% but good news is YAAY! Right?  Wait for it now…BUT upward revisions were due largely to companies building inventories.  Final sales actually declined from the initial estimate of 2.1% to 1.9%.  Excluding exports, final sales were revised from a growth of 2.3% to 1.7%.

The boom in natural gas production has led many power generators to convert their plants from coal to natural gas, when they can.  Total coal production is down this year (Source) but exports of U.S. coal to the rest of the world have surged, so that we are exporting a record 25% of the total coal production in this country.  The U.S. Energy Information Administration (EIA) estimates that coal exports will total about 133 million short tons this year, or 2-1/2 times the average of the past decade. (EIA Source)

The process of drilling for natural gas, called Fracking, has also led to a high production of crude oil (EIA source).

GDP includes both exports (+) and imports (-), what is called “net exports” and it has been negative for several decades as we import far more goods than we export.  This serves as a negative drag on GDP growth.

Exports have risen over the past decade.  As natural gas prices have fallen, surging coal exports in the past few years have helped buoy up lackluster GDP growth.

Another contributor to GDP growth has been a more confident consumer, in contrast to the rather cautious attitude of businesses in the past six months.  An upswing in student debt and car loans has halted the decline as households have shed debt (delevered) either by foreclosure, default, paying down balances or not charging as much.  Household Credit Market Debt outstanding (includes mortgages, car loans, student loans, revolving credit) indicates a growing willingness of consumers to take on more debt. 

On a per person basis, our debt has declined slightly from the peak of 2007 but is still way too high, leaving many of us vulnerable to a subsequent downturn, slight though it might be.

Just how bad has this recession been?  In previous recessions, households cut back their debt to “only” a 5% growth rate.  For the first time ever, the American people reduced their debt growth rate below 0. It is only in the past two years that this rate of negative debt growth is approaching 0.

Here’s the BUT. The underlying fragility of confidence was revealed this past Friday when the U. of Michigan Consumer Sentiment poll showed a plunge in confidence from over 82 in September to 74 in October. For the first time since the recession started in late 2007, the consumer confidence index had finally surpassed 80, only to fall back again the following month.  In a relatively healthy economy, this index is above 90.

To summarize so far, we have a consumer slowly and haltingly gaining more confidence, spending more and keeping the growth rate of her debt in check.  We have an overall economy that is behaving rather tiredly, growing tepidly as though on the downhill of a long boom cycle; that’s a problem since this has not been a boom cycle in the past few years.  So how are corporate profits doing?  Fine! Thank you!

In this past quarter, profits rose by 18%.

Starbucks, the coffee giant, announced this week that they would voluntarily pay some British income tax this year instead of moving the profits to some low tax country and avoiding British income taxes.  It appears that their customers discovered that they had been (legally, mind you) avoiding paying income taxes and were mobilizing to boycott Starbucks’ stores in Great Britain.

Interest rates kept near zero by the Federal Reserve have been a feast for many international corporations.  At the end of October, U.S. companies have issued $1.1 trillion in investment grade and high yield bonds (Source), responding to investors’ thirst for higher yields. That is an increase of 26% over last year’s bond issuance. International companies are, quite rationally, borrowing at the lowest interest rate they can find around the world, then spread that money to their subsidiaries in other countries.  They pay the lowest income taxes they can find internationally and shuffle the paper profits around the world. 

Ok, where were we? Oh yeah, cautious but more confident consumer, tepid but possibly improving GDP growth and record corporate profits.  Oh yeah, and record Federal Debt – over $16 trillion and counting.

Pity the poor corporations who pay the highest income tax rate in the world – except that they don’t.  In 2011, it was about 20%.

Record corporate profits, record low effective corporate tax rates, record low borrowing costs for corporations and record high Federal Debt.  The largest companies heavily lobby Congress to keep their tax rates low.  No matter how high profits are, companies publicly worry about their profit forecast and the economic outlook.  These large companies have become adept at convincing Congress that they are struggling.  Half of the Congress thinks that they must help these poor companies create jobs; key committee members craft more tax goodies and bury these goodies inside large appropriations bills.  Congress underfunds regulatory agencies so that they are effectively outmanned by corporate legal departments.

The lack of corporate tax revenues contributes to the Federal debt; over the past fifty years that share has declined from 20% of Federal revenues to about 10%.  If the share of Federal revenues had remained at the 20% level of the 1960s, the Federal Debt would be $7.4 trillion today, not $16 trillion.  Calculating savings on interest paid on the smaller debt would lower the actual debt to about $6.8 to $7 trillion.

Big increases in productivity have helped fuel the strong rise in profits.  Investments in technology as well as higher skill and education levels have enabled American workers to record levels of production but they have not shared in the gains from those increasing levels of production.  The U.S. has risen to the same levels of income inequality as some emerging countries:  China, Venezuela, Ecuador and Argentina.

To recap:  record high corporate profits due to record high worker productivity which has not benefited the workers, record low effective corporate tax rates and share of the costs of government, record low borrowing costs for corporations, and record high Federal Debt.

All of this largesse to multi-national U.S. corporations begs the question: Where are the jobs? But that I’ll leave for next when we look at the November Labor Report released this past Friday.

Taxes – Not In My Backyard!

There is a lot of discussion about the renewal of the Bush tax cuts enacted in 2003.  This past week the Senate passed a bill to renew the tax rates for all those with less than $250K taxable (not gross) income – $200K if filing single.  The measure is unlikely to pass the Republican dominated House which wants the cuts extended for all taxpayers, including the wealthiest.

For many of us, the tax rate cuts started in 1987, not 2003, after the Tax Reform Act of 1986.  Below is a 100 year chart of historical tax rates for a married couple with two children with a gross income of $66,000 in inflation adjusted dollars (thanks to the Tax Foundation)  After the standard deduction and exemption allowances, this is approximately $40,000 in taxable income.  This is middle class income, slightly below the median for married couples.

As you can see, we have enjoyed comparatively low income tax rates for the past twenty-five years.  For the past ten years, we have been conducting two wars without paying for them.  The rich are not paying.  The middle are not paying.  When our parents and grandparents ran up huge debts fighting WW2 and recovering from the 1930s Depression, they increased taxes on the middle class and the rich to pay down the debt.  This generation, the children and grandchildren of that WW2 generation, decided they had a better idea – charge it!  After all, we have expenses that previous generations didn’t have – like our cable TV bill and internet bill and cell phone bill.  The WW2 generation also had bills that previous generations didn’t have – car, electrical and phone bills for services and products that their parents and grandparents didn’t have.  Did they use that as an excuse to reduce their taxes?  No.

We continue to argue over how much government services and programs we want.  We argue over how much to spend on defense.  We argue whether we want somebody (but not us, God forbid) to pay more in taxes.  While we argue, the Federal debt continues to climb.

Obama’s Fiscal Prudence

Two months ago I compared federal debt by Presidential administration.  Obama’s administration leads the pack.  This would lead one to assume that President Obama is a big spender.  He’s not.  In a WSJ MarketWatch article (I don’t think you need a subscription to see this article), Rex Nutting examined the historical data of federal spending from the Office of Management and Budget (OMB) and Congressional Budget Office (CBO). The data shows that the big spenders were Reagan and G.W. Bush.  What has plagued the Obama administration is a lack of revenue, particularly income tax revenue, because of the recession. 

In a balanced approach, Nutting gives proper due to the role Republicans in Congress have played, checking Congressional spending approvals.

Regardless of the data, we can expect that Republican pundits and political ads will continue to paint the Obama administration as the big daddy of  “tax and spend” Democratic Presidents.  To partisans of either party, when facts don’t conform to their ideology or preconceived notions, there must be something wrong with the facts.  Both parties rely on the fact that many voters vote with their guts, not their heads.

Federal Debt By President

There are several “factoids” running around the internet that Obama has run up more debt than all past presidents combined.  According to the Treasury Dept that claim is not true but the run up in debt has been outstanding since Obama took office in January 2009.  When Bush left office, the total debt was 10 trillion.  It was 15.5 trillion at the end of February 2012.

As the graph below illustrates, we have been borrowing lots of money for the past thirty years.

Then I wondered:  after adjusting for inflation,what is the annual increase in federal debt for each President?  Adjusting for inflation allows us to compare apples to apples.  The Federal Reserve supplies us with both data on the debt and a deflator to adjust current dollars to real 2005 dollars.  Obama’s average is computed up to Dec 2011.

Remember, these are inflation adjusted dollars.  The big spending started with Reagan but both parties have become very practiced at developing good explanations for why we have to spend a lot of money. 

Like many, I have thought that the severe downturn has dramatically reduced federal receipts.  As a percentage of GDP, it has – receipts have been coming in at 15 – 16% of GDP, when the long term average is 18 – 19%.  But … bigger government spending has inflated GDP about 10%. What have receipts been over the past decade?  During the Bush years, the Federal government pulled in an average of 2.13 trillion dollars a year in 2005 real dollars.  During the Obama years, the average is 2.0 trillion.  The drop in receipts has been relatively slight.  80 – 85% of the responsibility for the big run up in the debt is spending.

Last week, Senator McCain acknowledged the true cost of defense spending at $1 trillion and it is defense spending that led the Bush administration to run up a $5 trillion dollar deficit in eight years despite four years of robust growth, fueled largely by a real estate bubble.  The bubble burst and the severe fallout from that debacle has prompted even more defense spending – social support programs to defend Americans against lost jobs, lost health insurance and lost home equity.

“Too much spending!” Republicans cry but do not want to cut back on defense spending or agricultural subsidies in rural areas where their support is strongest.  Income tax subsidies are another form of spending, one highlighted by the Simpson-Bowles commission.  In this broken, contentious political climate, neither side of the political aisle can agree on any meaningful reductions in tax subsidies because the voters who put them there can not agree. 

Since neither side can agree on spending cuts, there is only one other solution – higher revenues.  Yes, that’s the punch line.  Funny, isn’t it?  If neither side can agree on spending cuts, they surely can’t agree on where to get higher revenues.

Bleeding heart Democrats cry out for tax justice for the poor while Republicans stand strong for tax justice for the rich.  The Tax Policy Center can find no studies showing that taxes on the rich influence job creation, either positively or negatively.  To conservatives who believe that they do, facts are unimportant.  Conservatives are like football fans – all you gotta do is believe.

Democrats suffer from the same “fact blindness,” disregarding several studies showing that long term unemployment subsidies undercut the confidence and skills of the unemployed, making them less employable the longer they are out of work.  Car and home buying subsidies of the past few years have done little but push forward the buying of cars and homes.  When the subsidy programs expired, so too did the buying of cars and homes.  Despite the demonstrated ineffectiveness of these social subsidies, Democrats continue to propound that they are for the working person.  Another month and another proposal of yet another program for the “vulnerable.”

The moderates of either party have either been voted out of office or left in frustration.  Olympia Snowe, a Republican Senator from Maine, is the latest to quit the carnival show of Congress.  She wrote, “I do find it frustrating, however, that an atmosphere of polarization and ‘my way or the highway’ ideologies has become pervasive in campaigns and in our governing institutions.”

We can not agree on spending cuts and we have two large spending items looming in the near future which will only exacerbate the debate.  The Boomers are just beginning to collect on their deferred annuity program – we know it as Social Security.  They are one kind of bondholder expecting the government to make good on the promises it has made.  The really big bond leviathan is that world wide group of holders of U.S. debt – over $10 trillion in treasury bonds and notes.   We have benefited from the “flight to safety” over the past few years as investors around the globe have bought U.S. debt at ridiculously low rates.  Investors will want a more normal return for their money eventually and when that happens, the annual interest expense on our debt will rise.  These two groups of bondholders with demands and expectations will light the fuse.

If you think the past decade has been contentious, you ain’t seen nothin’ yet.

Debt Ceiling

As Congress and the White House spend a summer weekend wrestling with negotiations over the debt limit, it helps to step back and look at the overall U.S. debt picture.

Since mid 2008, we have been on a dangerous trajectory, borrowing for TARP, stimulus plans of both spending and tax cuts, two wars, extended unemployment benefits, more tax cuts this past December and more and more defense spending.

Some argue that the only legitimate function of government is defense. Since we can never be safe enough, in principle there is no upper limit to how much we should spend on defense. Friday’s BEA report on GDP shows a 7.3% increase in defense spending.

“We can not abandon the most vulnerable members of our society” is a mantra repeated by some. As the population grows, so too will the vulnerable members of any society. As the population ages, that vulnerability will increase exponentially. In principle, there is no upper limit on our caring and generosity.

In reality, of course, there are limits. In our individual lives, in our communities and in the nation as a whole, we must struggle with the contradictions between our loftier principles and the harsher realities of living. For a while we can delay the reconciliation of principle and reality by putting off the inevitable compromises.

We have a natural knack for prognostication – one that we exhibit at an early age when we don’t clean up our room, do our homework or some other petty chore. Peoples of the future may label us “Homo Prognosticator”, not “Homo Sapiens.”

Debt is one indication of prognostication. We are getting really good at putting things off in the hopes that, one day, it will start getting better.

Below is a chart of federal debt since 2004, showing the increasing change in slope of the debt owed by all of us – our future selves, our kids and grandkids.

As I have noted in previous blogs, we have both a spending and revenue problem. To deny that we have both is more than prognostication – it’s delusion. Neither problem has broadly palatable solutions but the longer we delay implementing solutions, the worse it will get – exponentially worse. Anyone who has charged way too much on credit cards is well aware of that. The interest on the debt increasingly worsens any solution until bankruptcy is the only answer.

National bankruptcy is the sum of over 300 million personal bankruptcies.

Treasury Bonds

Einstein famously quipped that the most powerful force in the universe was compound interest.  An equally powerful force is reversion to the mean, or average.  As discussions go on in Washington about raising the debt ceiling, let’s look at the $8+ trillion dollars of Federal Debt held by private investors.

How much more debt can investors buy?  Since the financial crisis of 2008, investors have gobbled up federal debt just as they gorged on mortgage debt in the years previous to the financial crisis.  Below is that same data with a 10 year moving average, showing just how far above the average federal debt has climbed.

As the Euro-Debt crisis continues to unfold, investors keep lining up to buy Treasury bonds that pay little in interest but offer some perceived refuge for their money.

Below is an ETF, SHY, that tracks the Barclays Short Term Treasury Bond index.  It is close to all time highs, leaving little room to move up and plenty of room to move down as demand for the safety of Treasury Bonds eventually returns to its average.

Bubbas get caught up in bubbles.  Eventually – maybe not this month or the next six months – investors will want to sell some – or a lot – of these Treasury Bonds.  When that happens, watch out below.