Fiscal Cliffs

June 4, 2023

by Stephen Stofka

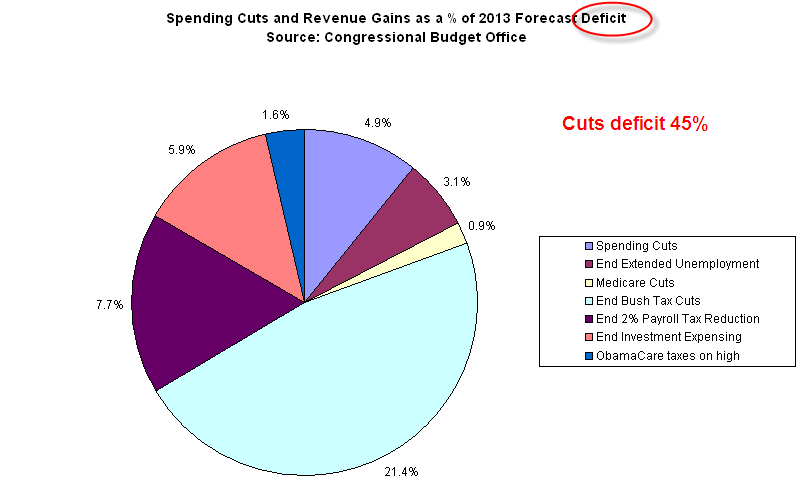
This week’s letter is about household debt and income. First I’ll touch on the latest news in the debt ceiling debacle. In a late Thursday session, the Senate passed a debt ceiling bill 63-36 and the President is expected to sign it before Monday, the day when Treasury Secretary Janet Yellen said the country would start delaying or defaulting on payments. There were few significant cuts to social and military spending, the biggest contributors to the nation’s rising debt. The CBO’s recent outlook estimates that the debt will rise by almost 50% in the next decade.

Although the issue is laid to rest until 2025, neither side is willing to pass a law that voids the 105 year old debt ceiling law. Since the passage of the 17th Amendment in 1913, only the Democratic Party has ever held a filibuster proof 60 vote majority in the Senate. For Republicans, the debt ceiling is a critical bargaining chip to undo Democratic spending priorities. When Democrats had a filibuster proof majority in 2009-2010, they could have undone the debt ceiling law but chose other priorities like Obamacare and banking reform. In 2021, ten Republicans joined Senate Democrats to bypass the 60 vote filibuster threshold and permit a vote to raise the debt ceiling, the Hill reported. Last year, Janet Yellen asked Democrats to lift the debt ceiling while they held majorities in both chambers of Congress but Chuck Schumer probably didn’t have the votes in a narrowly divided Senate.

The latest report on household debt from the New York Federal Reserve (2023) reveals some interesting trends in mortgage debt. During the pandemic, the surge in mortgage originations was particularly strong among those with the best credit scores of 760 and above.

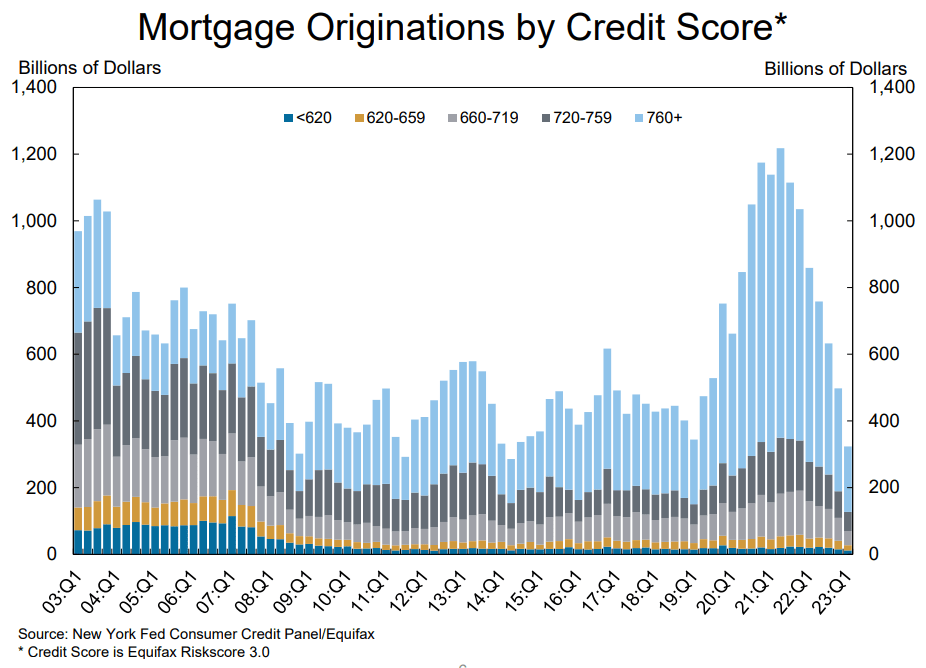
Those with the greatest house buying power are now “locked” into historically low interest mortgages below 4%. How low is 4%? The 50 year average of the 30-year fixed mortgage rate is 7.74%, according to Trading Economics. An entire generation was accustomed to very low rates after the financial crisis. Those low mortgages will create a resistance to sell that will likely dampen the housing market for a decade to come. A $400,000 mortgage at 4% costs $1900 per month. At a 6.5% rate that same monthly payment covers only a $300,000 mortgage. How many people will be willing to downsize into a more affordable mortgage?

In the past 15 years, Americans have reduced their debt load to a level less than their disposable income but how long can that continue? For the past 20 years, real disposable personal income per household has grown at only 1% annually, half of the rate of growth from 1982-2002. (Disposable income is what remains after taxes). In the graph below, that is the blue line. That same income series per job, not household, has grown at 1.25% annually (red line), down from 1.5% annual growth in the previous 20 year period. I’ve charted the two series on a log scale to demonstrate the different growth rates. The difference indicates that those with higher paying jobs have enjoyed higher growth of after tax income for the past two decades. The two series show the cumulative effect of favorable tax policies for those with higher incomes.   

Because the growth of household income is tepid, families are more likely to increase their debt burden. In a decade this could provoke a credit crisis similar to the great recession 15 years ago. Republicans are fiercely resistant to higher taxes on the top income earners and equally resistant to any reductions in military spending or agricultural supports. Democrats continue to promote social programs without the additional tax revenues to support that spending. A higher federal debt level will reduce the federal government’s capacity to support families when the next crisis arrives.   

//////////////////

Photo by Leio McLaren on Unsplash

Keywords: fiscal cliff, public debt, household debt, mortgage, disposable income

Federal Reserve Bank of New York. (2023, May). Quarterly report on household debt and credit. https://www.newyorkfed.org/medialibrary/interactives/householdcredit/data/pdf/HHDC_2023Q1

U.S. Bureau of Economic Analysis, Real Disposable Personal Income [DSPIC96], retrieved from FRED, Federal Reserve Bank of St. Louis; https://fred.stlouisfed.org/series/DSPIC96, June 2, 2023. Other series shown are Total Nonfarm Payroll (PAYEMS), the Census Bureau’s estimate of  households (TTLHHM156N)

Cliff Diving

November 18th, 2012

This past week, President Obama gave a post-election news conference, answering a number of questions about the fiscal cliff due to take effect on January 1st if the lame duck Congress and the President can not come to an agreeement on some budget bandaging.  The stock market has had the jitters since the first week of October, falling 9% since then; about half of that decline came after the election.  At almost the same hour that it became apparent that the balance of power in Washington would remain the same came the unwelcome forecast of no growth for the Eurozone in 2013.  When in doubt, get out.

For the past two years, there have been few “Kumbaya” moments in the halls of Congress or the White House.  The market has had a good run this year; capital gains taxes could increase next year; many decided to take their profits and run.  A I wrote a month ago, the drop in new orders for durable goods was troublesome.  Three weeks ago, the newest durable goods report showed further declines yet consumer confidence was up, creating a tug of war and I waved the yellow flag, saying that the “prudent investor might exercise some caution.”

For the long term investor who makes annual investments in their IRA, this drop in the stock market is an opportunity to make some of that contribution for this year.  If the wrangling over revenue and spending cuts continues over the next few weeks, the market could drop another 10 – 15%. When budget negotiations collapsed in July – August 2011, the market declined almost to bear market territory – about 19%.  All too often, some of us wait till the last minute in April to make our annual IRA contribution. 

The “cliff” terminology was spoken by Fed Chairman Ben Bernanke at a hearing in February.  He probably wished he had chosen less colorful language but he was probably trying to wake up some of the senators at the hearing.  How bad is this cliff?

The total measured economic output of the U.S., its GDP, is estimated by the BEA (Bureau of Economic Analysis) at around $16 trillion – $15.85 trillion, to be exact, based on this year’s estimated growth of about 2.2% and next year’s average 2.75% estimate of growth.  What’s a trillion dollars?  About $9000 for every household in the country.

The non-partisan Congressional Budget Office (CBO) estimated some of the economic impacts if we did go over the cliff; in other words, if the spending cuts and revenue increases occurred next year.  Below is a chart of the percentages of GDP that each component of spending cuts and revenue were to occur.

The total of these is 3.2% of the economy.  Well, that’s not Armageddon, you might think and you would be right. As I mentioned earlier, forecast growth is only about 2.75% for next year so that means that GDP would contract slightly next year.  On the other hand, the cliff sure helps the deficit for next year, cutting it by almost half.  The deficit is projected at about $1.1 trillion before spending cuts and revenue increases.  In more manageable numbers, the country is going to go further into debt next year to the tune of almost $10,000 for every household.

Politicians in front of a microphone are prone to hyperbole.  So are news anchors.  Politicians try to sell their version of the story; news anchors try to keep our attention.  Small numbers like 3.2% of GDP might not get our attention so we could hear more dramatic numbers.  News anchors may say “Spending cuts of $100 billion” because $100 billion sounds important.  But without a total or a percentage, we have no context to evaluate the amount of money.  Is $100 billion a little or a lot?  $100 billion in spending cuts is .6% of the entire economy, or 2.6% of the budget for this coming year.  We may hear “Revenue increases of $400 billion,” which sounds gigantic.  It is 2.5% of the economy, or an additional 13.8% of the projected federal revenue.  Remember, even with the revenue increases, should they take effect, the country’s budget will still be “in the red” an estimated $600 billion dollars, or $5400 per household.

This country needs more revenue and it needs to cut expenses.  Each side of the aisle will fight to protect the “job creators” (interpretation: people with money) or the “working poor” (interpretation: people who are barely making it week to week) or the “middle class” (interpretation: the rest of us).  Tax the other guy, not me.  Cut the other guy’s deductions, not mine.  Cut subsidies, but not mine.  Cut expenses but not in my industry or area of the country. This is the same kind of behavior that 5 – 8 year old kids exhibited in an experiment featured on CBS’ 60 Minutes tonight.  Maybe, just maybe, we need to grow up.