
A landscape of brown hills and far off mountains framed by the entry of a cave

Beyond Our Cave

July 26, 2026

By Stephen Stofka

For the past few weeks I have been writing about the political polarization of voters based on where they live. Last week I wrote that voting behavior depends on our prediction of how a particular candidate or party will affect our own well being or that of  our family, our community. A choice is the result of a prediction. A vote is a choice. Those who vote for a Republican candidate are making different predictions than those who choose a Democratic candidate. To understand the polarization in this country, I want to understand the prediction process itself. How much information do we need to feel like we have enough knowledge to make a prediction? That depends on many things – the circumstances and the consequences of making a prediction.

The Pool of Possibilities

The future is an infinity of possibilities. We cannot gather enough information in the present to flawlessly predict the future. What do we do? Take a small sample of the present and trust that that small sample will reliably represent the future. But how do we decide the size of that sample? Some voters meticulously research candidates and issues before voting. Some people vote by the dominant political party that represents their interests and values. However, in states that allow citizen ballot issues, there may be no clear party line. Some voters rely on a media source to do the research and make recommendations.

Some cities were large enough to support two daily newspapers. The editorial board of one newspaper would present a conservative position on candidates and citizen initiatives. The other newspaper would  present a liberal perspective on candidates and issues. Some people grew up learning only one perspective because their parents subscribed to that newspaper. People who moved to a city soon learned which of the two perspectives aligned with their personal values. The newspapers did the work of filtering all the information.

The Media Jungle

From 1970 to 1990, the circulation of daily newspapers peaked at over 60 million, almost the same number as the number of households in the country. By 2020, estimated circulation was about 25 million. Here’s a chart from Pew Research (Source).
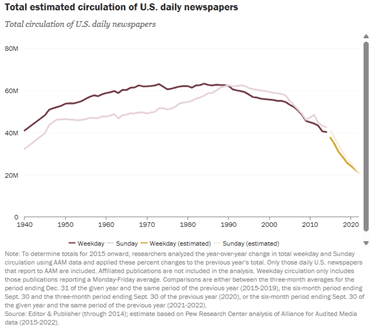
In addition to local and national news, the newspaper had that day’s TV listings, the daily weather forecast, and the results of yesterday’s sports games. Readers checked their horoscope, read cartoons and played the games in the back pages of the newspaper.

Today, digital algorithms serve up news sources and content that engages a reader. We are like donkeys endlessly walking in circles, powering a flour mill as social media dangles a carrot to keep our attention. Like cute cats? Here’s more. Like hearing about Trump’s latest outrage? Here’s more. Before we show you that, here’s a commercial.

The General and the Particular

A President has a relatively small impact on the personal circumstances of most voters. People often vote based on their prediction of whether a particular candidate will be good or bad for the country as a whole, or an industry. Gallup conducts two separate polls for opinions on the general economy, the Economic Confidence Index, and people’s individual financial circumstances, the Personal Finance Survey.

The Economic Confidence Index plunged into negative numbers at the onset of the pandemic and was still negative on the eve of the 2020 election. Sentiments recovered somewhat shortly after Biden took office, then plunged again as inflation climbed to 9% in the summer of 2022. As inflation declined, those polled grew more optimistic. On the eve of the 2024 election, that index was still negative and voters elected Donald Trump, who promised to restore economic confidence. However, a few months after he took office, Trump initiated his “liberation day” tariffs. Public sentiment and the stock market both fell in response. While the stock market recovered, people’s confidence has not. Confidence in the economy is now lower than when Trump left office in January 2021 (Source).

What about people’s personal financial circumstances? In a poll conducted during the first quarter of this year, a third of those polled were “very worried” that they would not have enough money for retirement. Another third were “moderately worried.” Sixty percent of respondents were worried that they could not cover medical bills in case of a serious illness (Source).

Party Loyalty

Some people make voting easy. They vote for each candidate from one of the two dominant political parties. Researching the electoral platform and record of each candidate can be time consuming. Also, many voters do not pay a lot of attention to politics until a few months before an election, so this strategy is practical. Mike Rosen was a conservative radio talk show host in Denver until 2016. His experience working in Washington helped him understand that party politics drove the legislative machinery. Party cohesion, power and connections gets legislation passed. Party affiliation is more important that the merits of individual candidates. Because of that, he endorsed a voting strategy of “party over person.” Having to choose between two dominant parties makes prediction much easier. Each party constructs a brand from a platform of policies meant to strengthen attachment with current members and to attract newcomers.

Attachment

As social creatures, we instinctively seek attachment. Branding is a marketing strategy that promotes attachment between consumers and products or voters and political parties. The Republican Party brands itself as the party of low taxes and low regulations. It promotes larger military spending, which helps support local communities in the southern states where Republican support is strong. The Democratic Party stresses equality and fairness for all. They promote programs which assist lower income families in urban areas where housing and other monthly costs are relatively high. Both branding strategies rely on predictions of the future. Elect our candidates and the future will be better, each party says.

Religion

Religious conviction relies heavily on predictions of the future. The Christian religion evolved from its Jewish roots but stressed individual salvation in contrast to the Messianic culture of the Jewish people that predicted a group salvation. Religious and political affiliation manifests the human desire for attachment. It is understandable that one or both dominant parties would incorporate religious sentiments into their brand.

In the mid-19th century, the Democratic Party promoted expansion of the country into the western lands occupied by Indians and held by Mexico. Expansion of land was necessary for the expansion of slavery, a cornerstone concept championed by the party. The party justified expansion under the banner of Manifest Destiny, an idea that the U.S. had a divinely ordained mission to spread Christian and republican government throughout the continent (Source).

In the past several decades, the Republican Party has absorbed a diverse group of Christian conservatives and evangelicals into the fold. The party has endorsed policies that outlaw abortion and same sex marriages, supported exemption from laws that conflict with one’s religious beliefs, and the rights of religious schools.

Postdiction

The past, particularly the ancient past, is almost as hidden from us as the future. We sample our present circumstances and often invent origin stories to explain the present. We speculate on the creation and composition of the cosmos, the formation of our world, the Earth, and how what is came to be. These speculations are like predictions but they come after the fact. Perhaps we should call them postdictions.

Organized religions promote an attachment to certain origin stories, claiming a divine authority and imprimatur on the opinions, values and interests of that religion’s congregation of believers. There are many religions and religious sects but only two political parties to absorb those congregations.

History

We are a politically divided country because the framers of the Constitution glued two different countries and cultures, north and south, together. Historians note the many dichotomies and contradictions of those founding documents. Thomas Jefferson penned the words “all men are created equal” in the Declaration of Independence, but owned 200 slaves. Article IV, Section 2, Clause 3 of the Constitution itself contained a fugitive slave clause, recognizing and treating human beings as property like domesticated animals (Source). That same declaration grounded government in “the consent of the governed,” but excluded women, blacks, Indians and poor white men.

Although the founders valued liberty and private property, many states allowed the imprisonment of debtors. Governments protected creditor rights above the property rights of farmers. Creditors were usually from urban areas. Debtors, mostly farmers, were from rural areas. From the beginnings of our country, there was a propensity for voters to sort themselves into two interest groups, rural and urban. Because we have a “winner-take-all” election system, this naturally leads to the formation of two political parties. A proportional representation system of elections gives formal recognition to marginalized communities. In our country, minority interests must work within either the Republican or Democratic parties.

Errors

Our actions today represent our predictions of the future, but our predictions aren’t always accurate. How do we cope with the errors of our conclusions? That’s something I want to take a look at next week, and I hope to see you then.

//////////////////

Photo by Maria Lupan on Unsplash

A crystal ball outside on the ground. Inside the ball is the reflection of a lake and trees

Different Predictions

July 19, 2026

By Stephen Stofka

In last week’s post, I ended with a promise to explore our political polarization. We are divided not only by values and ideologies, but by population density. Some of us prefer less density and less regulation. Those who live in a small town may have a limited choice of dining, shopping, health care and entertainment. There may be only one movie theater with one screen. In rural areas, the land doesn’t sit there as a space for human homes, businesses and institutions. The land works. It provides food for human or animal consumption. It provides trees, minerals and other resources. Its mountain peaks reach into the skies to collect water from the clouds, channeling water down the slopes to the valleys below. In these areas, the human community is a part of the land. People live with the land.

The U.S. Census Bureau has long distinguished rural and urban areas by population density. Recently, they have included outlying areas with low population density whose economies are tied to a nearby metro area. The distinguishing characteristic is that 25% of residents commute to a metro area for work (Source).

In dense urban areas, people live on the land. The human community dominates the land. Grass and trees serve as a spiritual refuge for humans, and a habitat for birds and small mammals. Land is space for human designs of concrete, asphalt and lumber. People who live there appreciate the availability of choices in most areas of their lives. They tolerate the regulatory environment needed to manage the frictions between neighbors. They are accustomed to a diversity of cultures and religious traditions.

In the small east Texas town where my mother grew up, there were churches of a variety of Protestant sects. In less than a mile on the main street of the town, there was a Methodist, Baptist, Christ the King and Presbyterian Church. That’s all the variety that people needed in that community. Those who attended an Anglican or Catholic church could drive almost an hour to Dallas on Sunday morning. My mother could not remember meeting a Jewish or Muslim person until she moved to New York City after World War 2.

Different Outlooks

The residents of rural and urban areas have different sensibilities and outlooks on life. They may share values and ideologies, but they place a different emphasis on those values when they vote. In rural towns, change is slow and the residents are suspicious of new developments. In many rural towns, there aren’t enough job or educational opportunities for young people. Many move to urban areas, where they must become accustomed to a faster pace of life. They try on new ideas, music, and other diversions. They become part of social groups that may seem alien to their parents. They question the choices and morals of the political leaders their parents voted for. A recent study by Pew Research shows that younger voters under 30 vote more heavily for Democratic Presidential candidates. Those over 60 favor Republican candidates (Source).

Density Signpost

Several studies in the past twenty years have found that population density is a significant factor predicting party affiliation. It’s not a direct cause of course, but it represents important differences in economic and social circumstances between urban and rural environments. After reading several papers on this topic, I’ll rely on a paper by Trevor Brown and Suzanne Mettler (2024) (Source). The paper is openly available and the authors reference a lot of other papers on the topic. Brown and Mettler note that, until 2000, there was not such a clear partisan divide between rural and urban voters. Here’s a chart from their paper to show the wide divergence in voting patterns in the past two decades.

The chart shows the percentage of voters, urban and rural, who voted for the Republican Presidential candidate. In the year 1996, there was only a 3% difference between urban and rural voters. In the 2020 Presidential election, that difference had grown to 21%. What happened?

Multiple Causes

There are several causes that account for the behavior of an airplane in flight, and human beings are a lot more complicated than airplanes. Different authors have highlighted a number of causes. Those in areas of higher population density are more educated. Not smarter. Just more educated. They work at jobs that require more education, or a degree becomes a filtering mechanism in a competitive job market. Job growth in rural areas has been stagnant. Those in urban areas have higher incomes but have higher housing and living costs. As already discussed, there is a greater variety of religious institutions, and less social pressure to embrace any religion.

Brown and Mettler pointed to some studies that stressed rural “consciousness, identity, or values,” but that didn’t explain the urban-rural divergence in political sentiment of the past three decades. Some authors cited the resentment that rural voters might have for urban voters who impose their priorities on everyone. However, this is not a recent development. In the 1960s, voters in rural upstate New York voted Republican. Voters in the urban area that included New York City voted Democratic. For decades, Colorado voters in the Front Range east of the Continental Divide have voted Democrat, while those in the western part of the state and on the eastern plains voted Republican. Perhaps readers will have similar experiences of longstanding urban-rural divides in other states.

A Shift in Outlook

Many election analysts have struggled to explain the change in voter sentiments before and after an election. Just prior to the 2016 election, Gallup asked voters for their assessment of the economy. 81% of Republican voters thought the economy was getting worse. Soon after Trump won the election, only 44% of Republican voters felt the same way. Among Democrats there was a similar shift, although not as extreme (Source, McCarthy & Jones, 2016). In the weekly Gallup surveys over the following weeks, Republican confidence improved while Democrat’s outlook declined. A similar shift happened before and after the 2024 election. Some analysts have termed the phenomenon partisan perceptual bias. A better term might be partisan prediction bias.

We Predict

We are creatures who must survive on our ability to predict. Unlike a cat, we do not have fast reflexes. To navigate our world, we must predict the motion of others. We get more comfortable driving a car as we learn to make many predictions in a short period of time. Secondly, we are social animals. To survive, we must learn to read the feelings and intentions of others to anticipate how they will act.

Vote Forecasting

Writing in the Public Opinion Quarterly, Andreas Graefe (2014) noted that asking people to predict an election winner was very accurate. She analyzed vote forecasting surveys from 1932 to 2012 and found that the majority of respondents correctly predicted the outcome 89% of the time (Source).

Notice that these forecasting surveys are different from voter intention surveys that ask people who they intend to vote for. These kinds of polls are probably the most reported on. For these kinds of polls, analysts must apply several statistical techniques to align the characteristics of their polling samples more closely with the characteristics of all voters in an electoral region. Sometimes they simply do not make the correct adjustments. Surveys prior to the 2016 election accurately predicted that Hillary Clinton would win the national popular vote. However, the national popular vote does not determine the winner of the Electoral College vote. Analysts misweighted the survey samples in several swing states, which delivered the winning electoral votes to Donald Trump (Source).

Gut Prediction

Asking voters how each of them will vote takes a lot of statistical tweaks to achieve an adequate level of accuracy. Asking voters for their gut predictions of the winner turns out to be quite accurate without those tweaks. When researchers ask people for their opinion on the economy, I think what many people respond with a prediction. Those predictions are based on our perception of our personal circumstances, local and national conditions. We filter those perceptions by ideology, values, and our previous experience. What pops out is a binary prediction of a likely winner from each of the two dominant political parties, not an assessment of the broad economy.

Why do people make such different predictions? Next week I want to look more closely at the components of our prediction process. And with that, I hope to see you next week.

///////////////////

Photo by Brad Switzer on Unsplash

Notes:

Brown, T. E., & Mettler, S. (2024). Sequential Polarization: The Development of the Rural-Urban Political Divide, 1976–2020. Perspectives on Politics, 22(3), 630–658. https://doi:10.1017/S1537592723002918  

Graefe, A. (2014). Accuracy of vote expectation surveys in forecasting elections. Public Opinion Quarterly, 78(S1), 204–232. https://doi.org/10.1093/poq/nfu008  

McCarthy, J., & Jones, J. M. (2016, November 15). U.S. economic confidence surges after election. Gallup. https://news.gallup.com/poll/197474/economic-confidence-surges-election.aspx

Timing Models

May 22, 2016

Long term moving averages can confirm the shifting trends of market sentiment and market watchers customarily watch for crossings of two averages.  The 50 week (1 year) average of the SP500 index just crossed below the 100 week (2 year) average, indicating a  broad and sustained lack of confidence.  Falling oil prices since mid-2014 have led to severe earnings declines at some of the large oil companies in the SP500.  The index is selling for about the same price as the two year average.

What to do?  These crossings or junctions can mark a period of some good buying opportunities – unless they’re not – and that’s the rub with indicators like this one.  Downward crossings typically occur after there has already been a 5 – 15% decline from a recent high.  If an investor sells some stocks at that time, they wind up selling at an interim low, and regret  their action when the market rises shortly thereafter.  They should have bought instead of sold.  AAAARGHHH, a false positive!  Twice in the 1980s, the sentiment shift was less than a year long and an investor who did act lost 10 – 20% as the market climbed after several months.

Conversely, after a 10-15% decline, some investors do buy more stocks, figuring that the excess optimism, or “fluff,” has been shaken out of the market.  Then comes that sinking feeling as the market continues to decline, and decline, and decline.  In April 2001 and July 2008, the 50 week average crossed below the 100 week average.  Investors who lightened up on stocks at those times saved themselves some pain and a lot of money as the broader market continued to lose another 30% or so.

There are not one but two problems with timing models: timing both the exit from and entry back into the market.  Over several decades the majority of active fund managers – professionals who study markets – did not get it right.  They underperformed a broad index like the SP500 because the index is actually a composite of the buying and selling decisions of millions of market participants.  John Bogle, the founder of the now gigantic Vanguard Funds, made exactly this point in his dissertation in the 1950s.  A half century later, this “wacky idea” of index investing has taken over much of the industry.

Consistently successful timing is very difficult and has tax consequences in some accounts.  Investors are encouraged to focus instead on their investment allocation to match their tolerance for risk and volatility, and to consider any prospective income that they might need from a portfolio.

Since 1960, the average annual price gain of the SP500 index has been 6.7%.  Add in an average yield (dividend) of 3% and the total return is almost 10% that an investor gains by doing nothing, a formidable hurdle for any timing model.

Within an allocation model, though, is the idea that an investor might shift a small portion of a portfolio from stocks to bonds and back in response to market signals.  In several previous articles I have looked at a Case-Shiller CAPE10 model (here, here, here, and here) as well as another crossing model using the 50 day and 200 day moving averages, dramatically named the Golden Cross and Death Cross (here, here, and here.)  As already mentioned, we want to avoid some of the false signals of crossing averages.

Instead of a crossing, we can simply use a change in direction of both averages.  When not just one, but both, long term averages turn down, we would move a portion of money from stocks to bonds, and in the opposite direction when both averages turned up.

Over the course of several decades, this strategy has been suprisingly successful.  The market sometimes experiences a decade when prices may be volatile but are essentially flat.  From 2000 – 2012 the SP500 index went up and down but was the same price at the beginning and end of that 12 year period.  1967 to 1977 was another such period, a stagnant period when an investor’s money would be better put to use in the bond market rather than the stock market.

In recent decades, this long term weekly model would have favored stocks from 1982 to March 2001 while the market gained 850%, an annual price gain of 11%.  The model would have shifted money back to stocks in August 2003 at a price about 25% less than the exit price in March 2001. In March 2008, the model would have favored an exit from stocks to bonds.  The stock market at that time was about the same price that it had been 7 years earlier in March 2001.  The model captured a 30% gain while the index went nowhere.

In the 1967 – 1977 period, the model did signal several entries and exits that produced a cumulative 8% price loss over the decade but the model favored the bond market for half of that period when bonds were earning 8% per year, a net gain.

In almost two years, the SP500 has changed little; the yield is less than 2%, far lower than the 3% average of the past 50 years.  However, the broader bond market has also changed little in that time and is paying just a little over 2%.  There are simply periods when strategies and alternatives have little effect. Although the 50 week average crossed below the 100 week average earlier this month, they are essentially horizontal.  The 100 week average is still rising, but barely so, a time of drift and inertia.  In hindsight, we may say it was the calm before a) the storm (1974), or b) the surge (1995). Usually the calm doesn’t last more than two years so we can expect some clear direction by the end of the summer.

/////////////////////////////

It’s the economy, stupid!

One of the myths of Presidential politics is that Presidents have a lot to do with the strength or weakness of the economy, a superhero narrative carefully cultivated by the two dominant parties.  Here’s a comparison of GDP growth during Democratic and Republican administrations. The Dems have it up on the Reps since 1928, chiefly because the comparison starts near the beginning of the Great Depression when the Reps held the Presidency.

For several reasons, GDP data is unreliable during the Depression and WW2 years.  First, the GDP concept wasn’t formalized till just before the start of WW2 so data collection was new, primitive and after the fact.  Secondly, this 14 year period includes an extraordinary amount of government spending which warped the very concept of GDP.  The WPA program that put so many to work during the depression years was a whopping 7% of GDP (Source), like spending $2 trillion dollars, or half the Federal budget, in today’s economy.

The Federal Reserve begins their GDP data series after WW2 when data collection was much improved. If you’re a Dem voter, don’t mention this unreliable data.  Just tell friends, family and co-workers that the Dems have averaged 4% GDP growth since 1927; the Reps only 1.7%.  If you’re a Republican voter, exclude the 20 year period from 1928 to 1947 and begin when the Federal Reserve trusts the data. Starting from 1947,  Republicans have presided over economies with 2.75% annual growth during 36 Presidential years.  During the 30 years Dems have held the Presidency, there has been a slighly greater growth rate of 3.1%.

In short, economic growth is about the same no matter which party holds the Presidency.  Shhhh! Don’t tell anyone till after the election is over.  Legislation by the House and Senate has a much greater impact on the economy.

///////////////////////////

Small Business

“If America is going to dominate the world again, the country has to fix the spirit of free enterprise. Small-business startups are in serious decline.”

“Gallup finds that one-quarter of Americans say they’ve considered becoming business owners but decided not to. ”

These foreboding quotes are from a recent Gallup poll.  Small businesses employ more than 50% of employees and are responsible for the majority of job growth yet many politicians and most voters pay little attention to the concerns of small business owners.  The giant corporations get most of the press, praise and anger.  Could the lack of small business growth be responsible for the lackadaisical growth of the entire economy during this recovery?  As the population  continues to age, growth will be critical to fund the dedication of community resources to both the old and young.

The BLS routinely tracks the Employment-Population Ratio, which is the percentage of people over 16 who are working, currently 60%.  But this ratio does not fully capture the total tax pressures on working people since it excludes those under 16, who require a great deal of community resources.  When we track the number of workers as a percent of the total population, we see a long term decline.  As this ratio declines, the per-worker burdens rise for it is their taxes that must support programs for those who are not working, the young and the old.

Regulatory burdens hamper many small businesses. A recent incident with a Denver brewery highlights the sometimes arbitrary rulemaking that business owners encounter.  Agencies protest that their mission is to ensure public safety.  An unelected manager or small committee in a department of a state or local agency may be the one who decides what is the public safety.  As the rules become more onerous and capricious, fewer people want to chance their savings, their livelihood to start a small business.  As fewer businesses start up, tax revenues decline and the debate grows ever hotter: “more taxes from those with money” vs “less generous social programs.”  Policy changes happen at a glacial pace, further exacerbating the problems until there is some crisis and then the changes are instituted in a haphazard fashion. Since we are unlikely to change this familiar pattern, the issues, anger and contentiousness of this election season are likely to increase in the next decade.  Keep your seat belts buckled.