December 31, 2023
by Stephen Stofka
This week’s letter is about the role of a monetary rule and the guiding points that help the Fed steer its policymaking. Since the 2008-9 financial crisis, the Fed has purchased a lot of assets, increasing its balance sheet from less than one trillion dollars at the end of 2007 to almost $8 trillion this month. It has kept the federal funds rate that anchors all other interest rates near zero for ten of the last 15 years. The members on its board of governors serve 14 year terms, affording them an autonomy resistant to political influence. From those board members the President and Senate choose and confirm the Chair and Vice-Chair of the board. The governance structure allows them to set and follow a plan of steady guidance but their actions have resembled those of sailors steering against unpredictable winds. What are the guiding lights?
In the late 1950s, economists and policymakers enthusiastically endorsed the concept of the Phillips Curve. Picture an ellipse, a circle that has been stretched along one axis so that it appears like an egg.
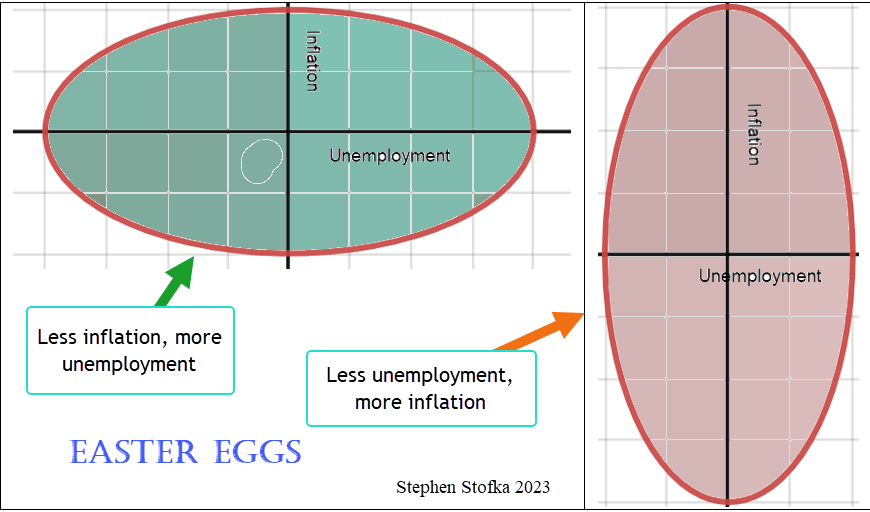
Think of unemployment along the x-axis and inflation along the y-axis. More unemployment stretched the circle, shrinking inflation. More inflation stretched the circle in the y-direction, lessening unemployment. Policymakers could tweak monetary policy to keep these two opposing forces in check. In the 1970s, both inflation and unemployment grew, shattering economic models. Nevertheless, Congress passed legislation in 1978 that essentially handed the economic egg to the Fed. While the central banks of other countries can choose a single policy goal or priority – usually inflation – Congress gave the Fed a twin mandate. It was to conduct monetary policy that kept inflation steady and unemployment low – to squeeze the egg but not break it.
Mindful of its twin mission, the Fed later recognized – rather than adopted – a monetary policy rule, often called a Taylor rule after John B. Taylor (1993), an economist who proposed the interest setting rule as an alternative to discretion. The Fed would use several economic indicators as anchors in policymaking. The Atlanta Fed provides a utility that charts the actual federal funds rate against several alternate versions of a Taylor rule. I’ve included a simple alternative below and the actual funds rate set by the Fed. When the rule calls for a negative interest rate, the Fed is limited by the zero lower bound. Since the onset of the pandemic in March 2020, the Fed’s monetary policy has varied greatly from the rule. Only in the past few months has the actual rate approached the rule.

In a recent Jackson Hole speech, Chairman Powell said, “as is often the case, we are navigating by the stars under cloudy skies.” What are these guiding points that should anchor the Fed’s monetary policy? I’ll start with r-star, represented symbolically as r*, which serves as the foundation, or intercept, of the rule. Tim Sablick at the Richmond Fed defined it as “the natural rate of interest, or the real interest rate that would prevail when the economy is operating at its potential and is in some form of an equilibrium.” Note that this is the real interest rate after subtracting the inflation rate. The market, including the biggest banks, consider it approximately 2% (see note at end). This is also the Fed’s target rate of inflation, or pi-star, represented as π*. The market knows that the Fed is going to conduct monetary policy to meet its target inflation rate of 2%.
Why does the Fed set a target inflation rate of 2% instead of 0%? The Fed officially set that target rate in 1996. The 2% is a margin of error that was supposed to give the Fed some maneuvering room in setting policy. There was also some evidence that inflation measures did not capture the utility enhancements of product innovation. Thirdly, if the public expects a small amount of inflation, it adjusts its behavior so that the cost is so small that the benefit is greater than the cost (Walsh 2010, 276). Today, most central banks set their target rate at 2%.
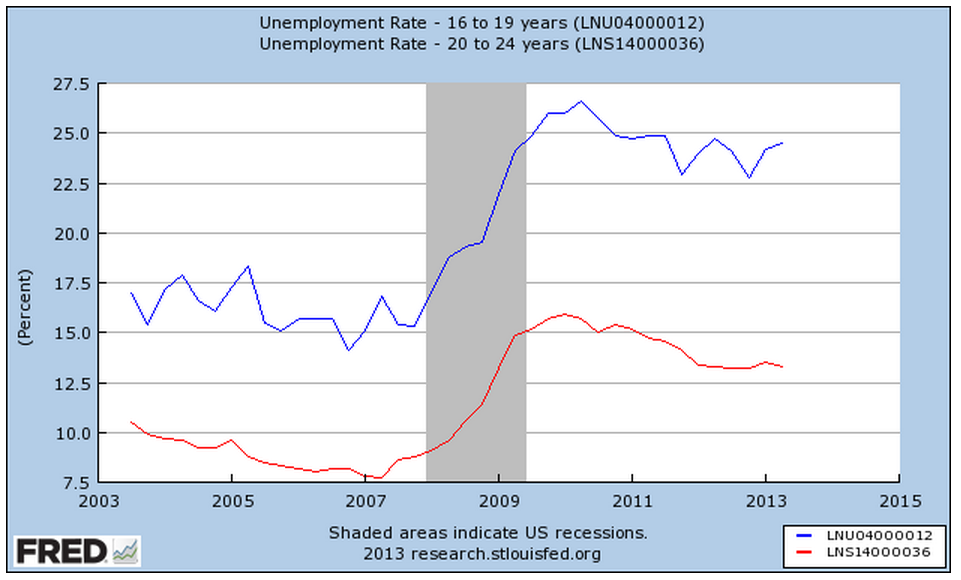
The definition of r-star above is anchored on an economy “in some form of equilibrium.” How does the Fed gauge that? One measure is the unemployment rate and here we have another star, U-star, often represented as un, meaning the natural rate of employment. In 1986 Ellen Rissman at the Chicago Fed described it (links to PDF) as “the rate of unemployment that is compatible with a steady inflation rate.” So now we have both unemployment and the interest rate anchored by the inflation rate.
Another part of that r-star definition is an economy “operating at potential.” Included in the Fed’s interest rate decisions is an estimate of the output gap that is produced by economists at the Congressional Budget Office (CBO). The estimate includes many factors: “the natural rate of unemployment …, various measures of the labor supply, capital services, and productivity.” The CBO builds a baseline projection (links to PDF) of the economy in order to forecast the federal budget outlook and the long term financial health of programs like Social Security. Each of these factors does contribute to price movement but the analysis is complex. A more transparent gauge of an output gap could help steer public expectations of the Fed’s policy responses.
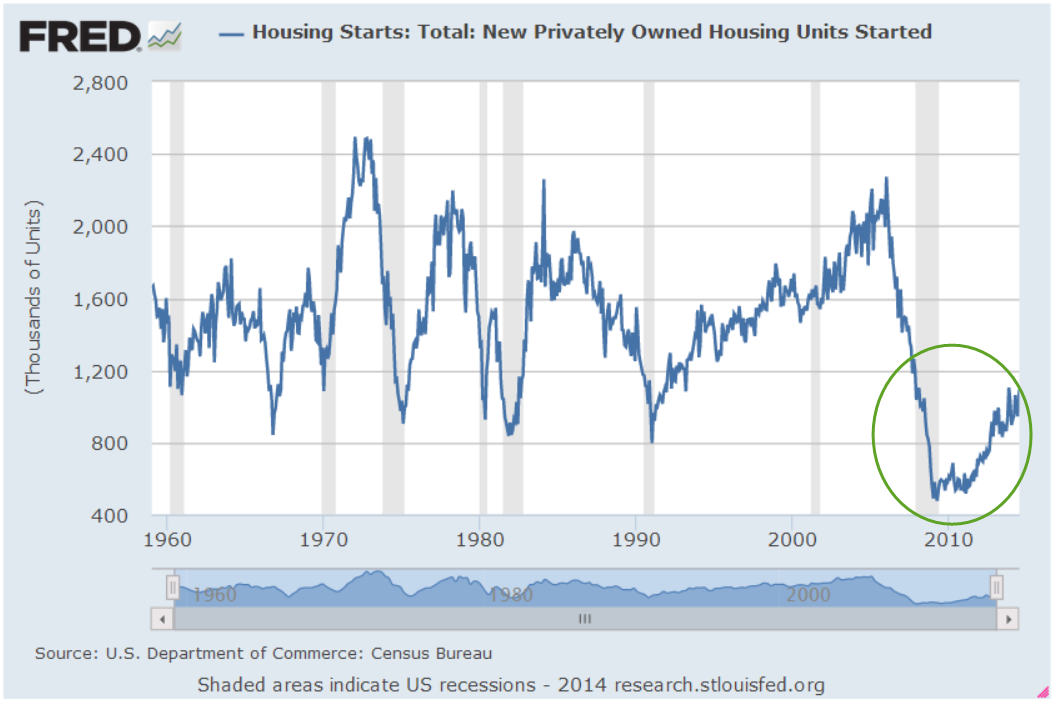
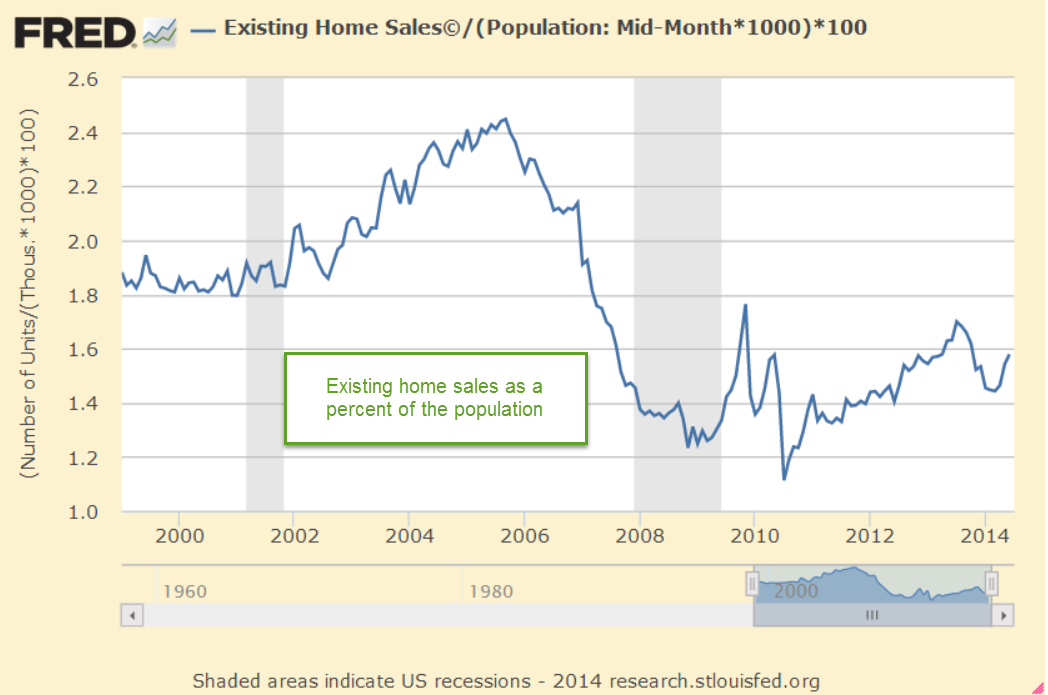
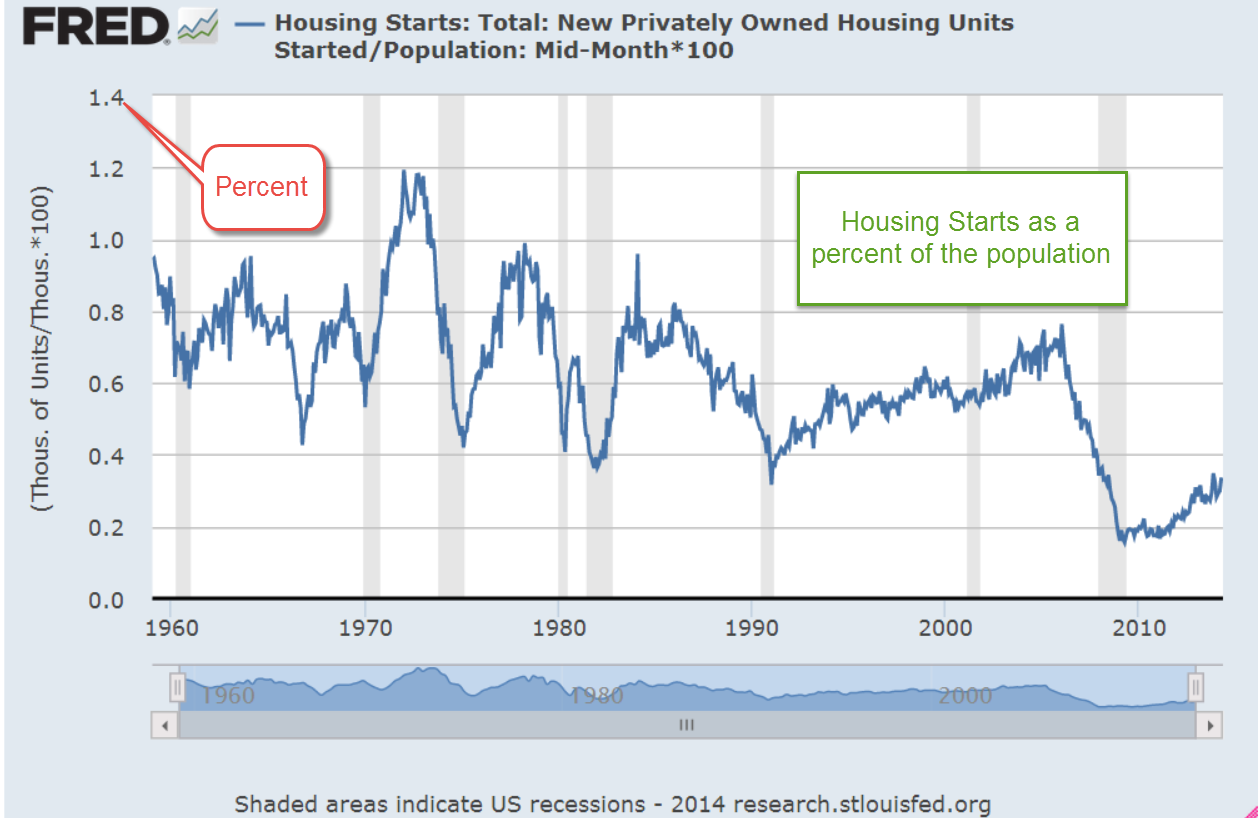
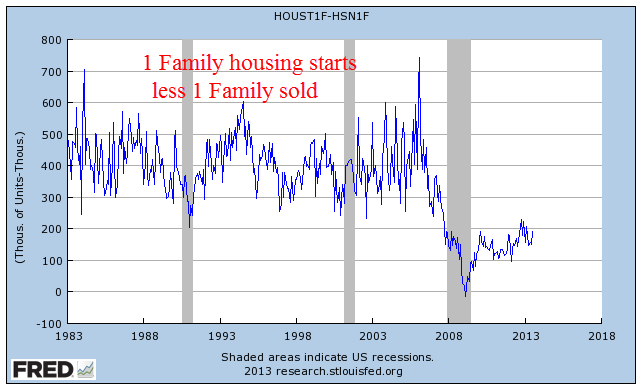
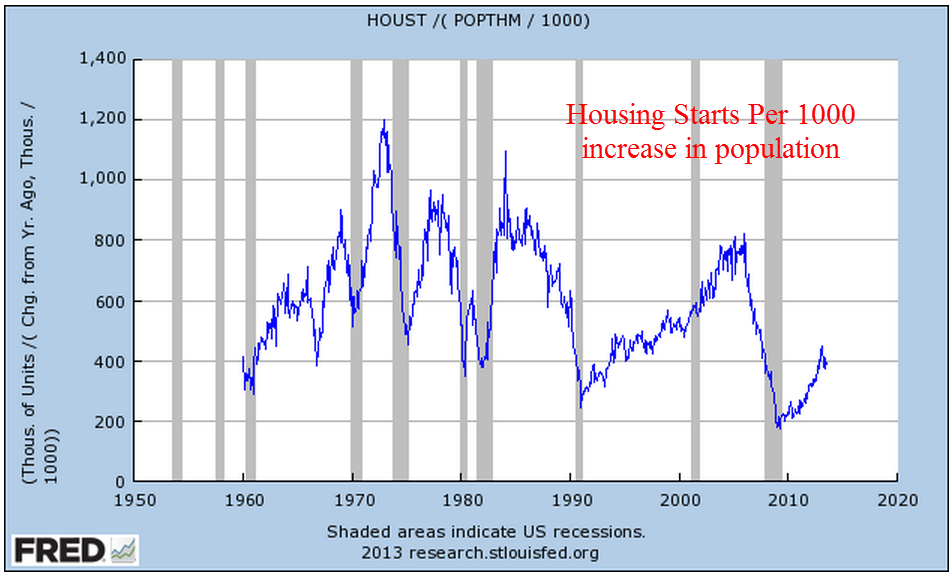
In a paper presented at the Fed’s annual Jackson Hole conference in Wyoming, Ed Leamer (2007, 3) suggested that the Fed substitute “housing starts and the change in housing starts” for the output gap in constructing a monetary policy rule. At that time in August 2007, housing starts had declined 40% from their high in January 2006. Being interest rate sensitive, homebuilders had responded strongly to a 4% increase in the Fed’s key federal funds rate. Despite that reaction, the Fed kept interest rates at a 5% plateau until September 2007. By the time, the Fed “got the message” and began lowering rates, the damage had been done. Six months after Leamer delivered this paper, the investment firm Bear Sterns went bankrupt. The Fed engineered a rescue by absorbing the firm’s toxic mortgage assets and selling the rest to JP Morgan Chase. Six months later, Lehman Brothers collapsed and the domino effect of their derivative positions sparked the global financial crisis.
I have suggested using the All-Transactions House Price Index as a substitute for the output gap. A long-term average of annual changes in this index is about 4.5%. The index is a summation of economic expectations by mortgage companies who base their loan amounts on home appraisals, banks who underwrite HELOC loans to homeowners and loans to homebuilders. The index indirectly captures employment trends among homeowners and their expectations of their own finances. Any change that is more than a chosen long-term average would indicate the need for a tightening monetary policy. Anything less would call for a more accommodative policy. Either of these housing indicators would be a transparent gauge that would help guide the public’s expectations of monetary policy.
Although the Fed considers the Taylor rule in setting its key interest rate, the rate setting committee uses discretion. Why have a rule only to abandon it in times of political or economic stress? The rule may not operate well under severe conditions like the pandemic. A rule may be impractical to implement. A Taylor rule variation called for a federal funds rate of 8% in 2021. This would have required a severe tightening that forced the interest rate up 7% in less than a year. The Fed did that in 1979-80 and again in 1980-81. Both times it caused a recession. The second recession was the worst since the 1930s Depression. An economy as large as the U.S. cannot adjust to such a rapid rate increase.
How strictly should a rule be followed? Some of us want rule making to be as rigid as lawmaking. A rule should apply in all circumstances regardless of consequences. Many Republican lawmakers felt that way when they voted against a bailout package in September 2008. Some of us regard a rule as an advisory, not a straitjacket constraint of policy options. Each of us has a slightly different preference for adherence to rules.
See you all in the New Year!
/////////////
Photo by Mark Duffel on Unsplash
Keywords: housing starts, house price index, stars, output gap, unemployment, interest rate, inflation
All-Transactions House Price Index is FRED Series USSTHPI. The annual change is near the long-term average of 4.5%, down from a high of 20% in 2022.
Housing starts are FRED Series HOUST. The output gap is a combination of two series, real GDP GDPC1, and real potential GDP, GDPPOT.
A gauge of long-term inflation expectations is the 10-year breakeven rate, FRED Series T10YIE. The 20-year average is 2.08%. The series code is T=Treasury, 10Y = 10 year, IE = Inflation Expectations. The T5YIE is a 5-year breakeven rate.
Leamer, E. (2007). Housing Is the Business Cycle. https://doi.org/10.3386/w13428
Taylor, J. B. (1993). Discretion versus policy rules in practice. Carnegie-Rochester Conference Series on Public Policy, 39, 195–214. https://doi.org/10.1016/0167-2231(93)90009-l
Walsh, C. E. (2010). Monetary theory and policy. MIT press.