August 24, 2014
Housing
The week began with a bang as July’s Housing Market index notched its second consecutive reading of +50, growing a few points more than the 53 index of last month. Readings above 50 indicate expansion in the market. The index, compiled by the National Assn of Homebuilders, is a composite of sales, buyer traffic and prospective sales of both new and existing homes. The index first sank below 50 in January and stayed in that contractionary zone for a few months before rising again in June and July.
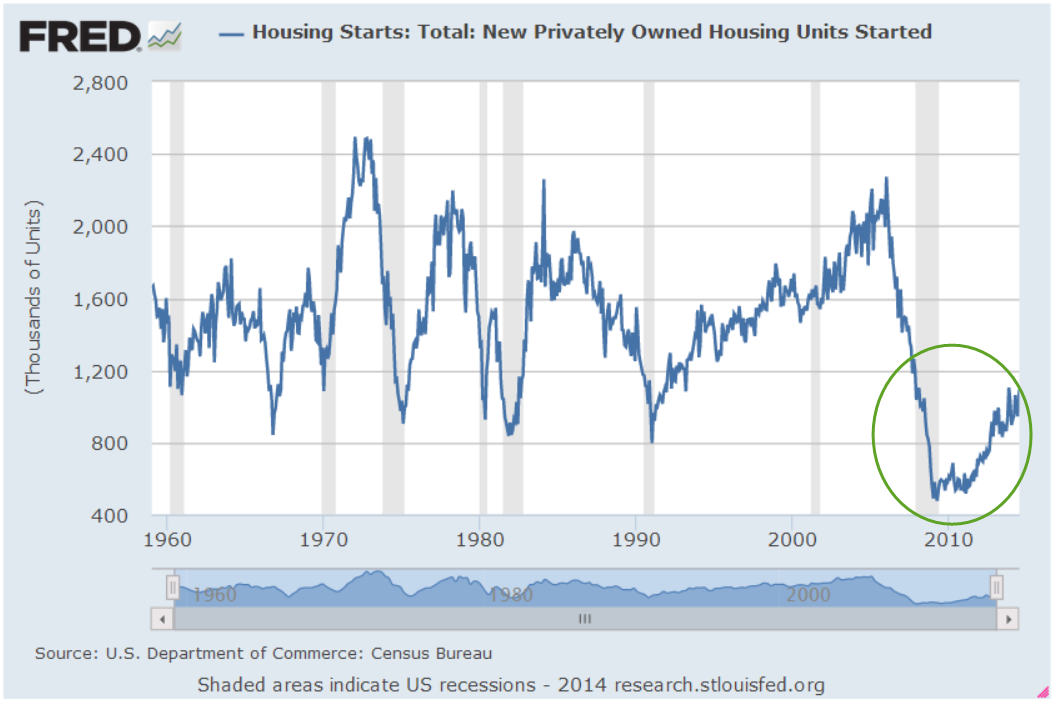
Housing Starts rose back above the 1 million mark but the big gains were in multi-family dwellings. Secondly, this number needs to be put in a long term perspective. We simply are not forming new households at the same pace as we did for the past half century.
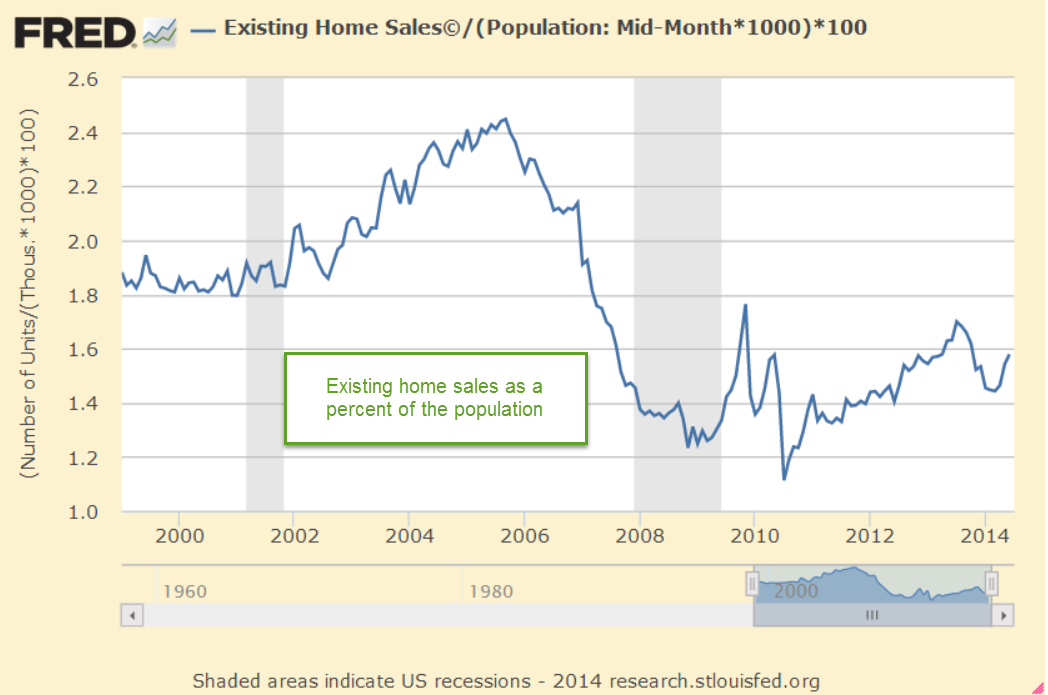
After monthly declines in May and June, new home sales popped up almost 16% in July. Existing home sales rose in July but have now shown 9 consecutive months of year-over-year decreases.

The number of existing home sales is at the same level as 1999-2000. On a per capita basis, we are about 11-12% below the rather stable level of those years, before the housing bubble really erupted in the 2000s.
During the 1960s and 1970s, households grew annually by 2.1% (Census Bureau data). That growth slowed to 1.4% in the 1980s and 1990s and has declined in the past decade to 1% per year. During the 1960s and 1970s, the number of households with children headed by women exploded by over 3% per year, leading to a growing economic disparity among households. During the 1980s, growth slowed but still hit 2.5%. In the past two decades, this growth has stabilized at 1.2 to 1.3% per year, just a bit above the total rate of growth of all households.
The trend of slower growth in household formation shows no signs of changing in the near term. We can expect that this will curtail any historically strong growth in the housing industry. The price of an ETF of homebuilders, XHB, has plateaued since the spring of 2013. The price has tripled from the dark days of 2009 but is unlikely to reach the formerly lofty heights of the mid-$40s anytime soon.
************************
Interest Rates
As the long days of summer wane and children return to school, central bankers gather in the majestic mountains of Jackson Hole, Wyoming. Let’s crank up the wayback machine and return to those yester-years when fear and despondency continued to grip the hearts of many around the world. In August 2010, the Chairman of the Federal Reserve, Ben Bernanke, announced that the Fed would continue to buy Treasuries and other bond instruments to maintain a balance sheet of about $2 trillion dollars, which was already far above normal levels. Bernanke hinted that the Fed would be ready to further expand the program should the economic recovery show signs of faltering. This speech would later be viewed as a pre-announcement of what would be dubbed QE2, or Quantitative Easing Part II, which the Fed announced in November 2010. The promise of Fed support helped fuel a 30% rise in the market from August 2010 to the spring of 2011.
Like the announcement of a new pope, investors look toward the mountain and try to read the smoke signals rising up from this annual confab. Financial gurus practiced at linear regressions and Bayesian probabilities struggle to parse the words of Fed Chairwoman Janet Yellen. Did she use the word “likely” or “probably” in her speech? What coefficient of probability should we assign to the two words? Did she use the present perfect progressive or the past perfect progressive verb tense?
Here’s the gist of Ms. Yellen’s speech – essentially the same gist that she has given in several testimonies before Congress:
monetary policy ultimately must be conducted in a pragmatic manner that relies not on any particular indicator or model, but instead reflects an ongoing assessment of a wide range of information in the context of our ever-evolving understanding of the economy.
Investors like simple forecasting tools – thresholds like the unemployment rate or the rate of inflation. In 2012 and 2013, former chairman Ben Bernanke reminded investors that thresholds are benchmarks that may guide but do not rule the Fed’s decision making. Ms. Yellen reiterated several points:
Estimates of slack necessitate difficult judgments about the magnitudes of the cyclical and structural influences affecting labor market variables, including labor force participation, the extent of part-time employment for economic reasons, and labor market flows, such as the pace of hires and quits….the aging of the workforce and other demographic trends, possible changes in the underlying degree of dynamism in the labor market, and the phenomenon of “polarization”–that is, the reduction in the relative number of middle-skill jobs.
Each month I have encouraged readers to go beyond the employment report headlines, to look at these various components of the labor market. The Fed uses a complex model of 19 components:
This broadly based metric supports the conclusion that the labor market has improved significantly over the past year, but it also suggests that the decline in the unemployment rate over this period somewhat overstates the improvement in overall labor market conditions.
Long term bond prices are at all time highs, leading some to question the reward to risk ratio at these price levels. Prices took a 10% – 12% hit in mid-2013 in anticipation of a rate hike in 2014, indicating that investors are that jumpy. Since the beginning of this year, prices have risen from those lows of late last year. Will 2015 be the year when the Fed finally begins to raise interest rates? Investors have been asking that question for four years.
Since the spring of 2009, 5-1/2 years ago, an index of long term corporate and government bonds (VBLTX as a proxy) has risen 65%. From the spring of 2000 to the spring of 2009, a period of nine years, this index gained the same percentage. Perhaps too much too fast? Only time will tell.
**************************
Takeaways
Housing growth will be constrained by the slower growth in household formation. Further valuation increases in long term bonds seem unlikely.
