September 18, 2022
by Stephen Stofka
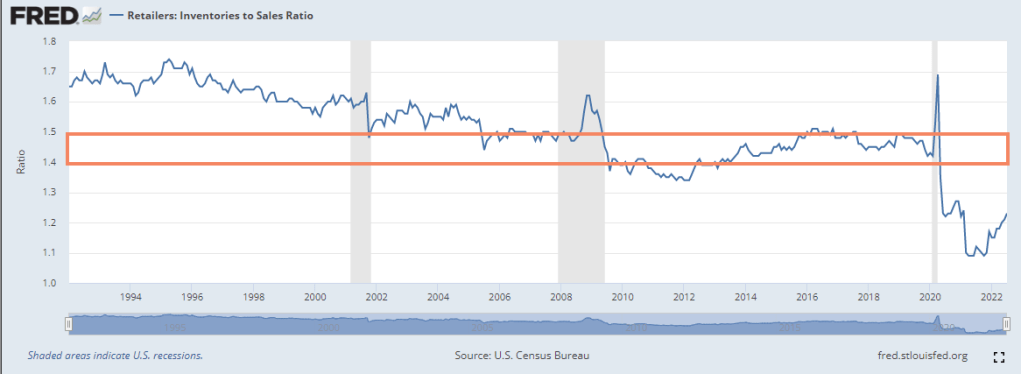
Price records circumstances, not value or utility. Our buying power is like a bar of soap. As water shrinks soap, high inflation shrinks our buying power. Economists offer several explanations for the persistent inflation but the one that I buy is that constrained supply and fairly steady demand are driving prices higher. Rising prices are a symptom of a shortage of goods – a quantity issue. Retailers inventory to sales ratio has increased slightly from the historic low in May 2021 but the ratio is still far below the range of 1.4 – 1.5 that was the benchmark before the pandemic.
This past Thursday, I picked up three jars of my favorite crunchy peanut butter. Some stores have been out of stock on the crunchy variety so I bought extra to be sure. I was not concerned about rising prices. I was responding to a quantity shortage, or the fear of a shortage. The difference is important. In Econ 101, students are shown the standard supply and demand diagram.

Left out of this stylized relationship is that supply is on a slower time scale than demand. It takes time, planning, investment and risk to produce all that supply. To cope with that reality, businesses must keep an inventory on hand to meet changes in demand which happen on a shorter time scale. Shift the red supply line to the left and the intersection of supply and demand occurs at a higher price. The Fed and the market thought that the supply constraints would fully resolve by this year but they have not. As stores and restaurants reopened, customers put away the electric panini sandwich makers, bread machines and gym equipment they had bought during the pandemic. They began purchasing consumables and were willing to pay higher prices for clothes, airline and movie tickets, and restaurant meals. In the face of ongoing supply constraints, the Fed has had to keep raising interest rates to try to curb demand, shifting the blue demand line to the left as well.
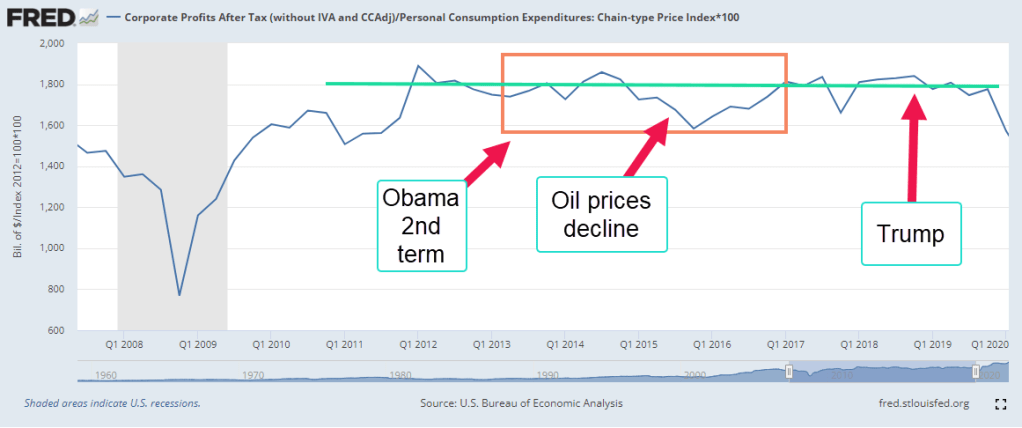
The higher prices helped businesses recover profits lost during the pandemic. Businesses have taken advantage of the supply disruptions to juice their profits by 33% (BEA, 2022).

When the Republicans took control of both chambers of Congress and the Presidency, they lowered corporate taxes. Those on the left often blame the economic elite for society’s problems and wasted no opportunity in criticizing Republicans for gifting the corporate elite. Mr. Trump boasted on his business prowess, promising to get the economy revving up again. Despite his rhetoric, corporate profits remained at the same level as during Mr. Obama’s second term.
A Presidential veto can block legislation but it is Congress that passes the laws that affect the economy. As I wrote last week Congress sometimes buys voter approval, creating bubbles that finally implode. The State Historical Society of Iowa (2019) has an image of a 1928 campaign ad for Herbert Hoover. It is a resume of economic progress under total Republican control during the 1920s. The Congress had won the public’s approval with easy credit and lax regulation. The following year the onset of the Great Depression brought down the house of cards. 25% of workers lost their jobs. Many lost their homes and farms.
Corporations exist to turn money flows into profits. Whatever money Congress spends winds up in corporate coffers. After 9-11, the federal public debt rose by $3 trillion (U.S. Treasury Dept, 2019) while corporate profits more than doubled, all thanks to Congress. Democrats and Republicans supported higher military spending and a building boom supported by easy credit policies.
In response to the pandemic, a bipartisan effort in Congress passed relief packages of more than $3 trillion. Today the public debt is $7 trillion above the pre-pandemic level. Much of that money became corporate profit because that’s what good companies do – turn cash flows into profits. Some of those profits were then used to buy the Treasury bills generated when the government increased their debt. This completed the cycle of debt and profits.
On average voters re-elect 90% of House members and 80% of Senate members. Midterm elections are less than two months away. Both parties take advantage of the public’s tendency to pin responsibility – good or bad – on the President, both the current and the past President, Mr. Trump. “Inflation is Biden’s fault,” Republicans will say and hope it sticks with some voters. Democrats hope that Trump will announce a 2024 run for President before the coming midterm election. They hope that independent voters, particularly suburban women, will vote for Democrats to voice their disaffection with Mr. Trump.
The election spending will juice the profits of media companies who depend on the craziness of our democratic politics. People in western European countries look in dismay at our frenzied politics that makes us vulnerable to a populist like Trump. Some Americans long for authoritarian measures that might curb the craziness of our politics and promote more cooperation. They are tired of the demolition derby of American democracy and wish they could go to sleep for a few months until it is over.
////////////////////
Photo by Anvesh Uppunuthula on Unsplash
State Historical Society of Iowa. (2019, January 14). “A chicken for every pot” political ad, October 30, 1928. IDCA. Retrieved September 16, 2022, from https://iowaculture.gov/history/education/educator-resources/primary-source-sets/great-depression-and-herbert-hoover/chicken If you have a moment, do check this out!
BEA: U.S. Bureau of Economic Analysis, Corporate Profits After Tax (without IVA and CCAdj) [CP], retrieved from FRED, Federal Reserve Bank of St. Louis; https://fred.stlouisfed.org/series/CP, September 16, 2022.
U.S. Department of the Treasury. Fiscal Service, Federal Debt: Total Public Debt [GFDEBTN], retrieved from FRED, Federal Reserve Bank of St. Louis; https://fred.stlouisfed.org/series/GFDEBTN, September 16, 2022.