September 13, 2015
The SP500 index is very close to crossing below its 25 month average this month, four years after a similar downward crossing in September 2011. Worries over the economy and political battles over the budget had created a mood of caution during that summer of 2011. The market immediately rebounded with a 10% gain in October 2011 and has remained above the 25 month average in the four years since. Previous crossings, however – in November 2000 and January 2008 – have marked the beginnings of multi-year downturns.
These long term crossings are coincident with extended periods of re-assessment of both value and risk. Sometimes the price recovery after a crossing below the 25 month average is just a few months as in August 1990, and October 1987, or the quick rebound in 2011. More often the price of the index takes a year or more to recover, as in 1977, 1981, 2000 and 2008.

The downward crossings of 2000 and 2008 preceded extended periods of price weakness. Recovery after the popping of the dot-com bubble lasted till the fall of 2006. In January 2008, just over a year after the end of the last recovery, another downward crossing below the 25 month average occurred. Later on that year, it got really ugly.
As the saying goes, we can’t time the market. However, we can listen to the market. For the fourth year in a row the bond market continues to set records. The issuance of investment grade and higher risk “junk” corporate bonds has totaled $1.2 trillion so far this year. Ahead of a possible rate hike by the Federal Reserve this month, Wednesday’s single day bond issuance set an all time record. The reason for the high bond issuance is understandable – companies want to take advantage of historically low interest rates. The demand for this low interest debt is a gauge of the long term expectations of low inflation.
**********************************
CWPI
The Purchasing Manager’s Index presents a somewhat contradictory note to the recent volatility in the stock market. The CWPI, a composite of the manufacturing and services surveys, shows strong growth. The manufacturing sector has weakened somewhat. The strong dollar has made U.S. exports more expensive.

On the other hand…the ratio of inventory to sales remains elevated at 1.37, meaning that merchants have 37% more product on hand than sales. The particularly harsh winter was unexpected and hurt sales, helping to boost inventories. Five months after the winter ended, there should have been a notable decline in this ratio.
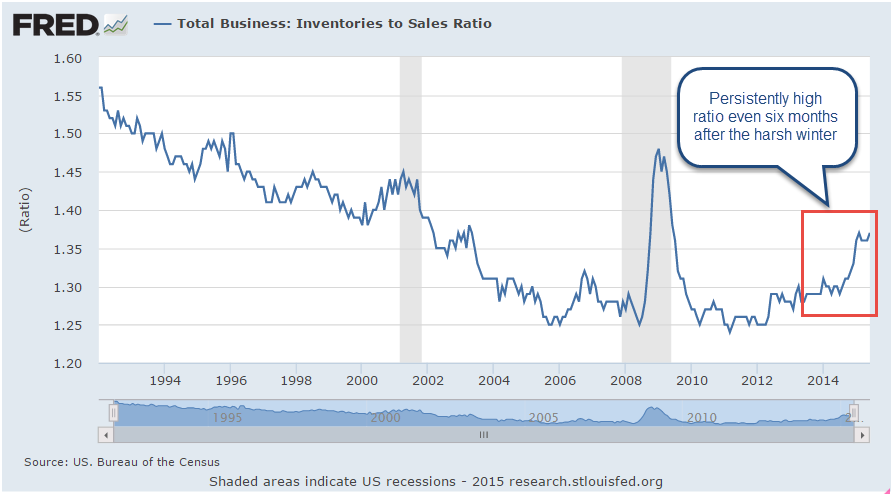
Has some of the strong economic growth gone to inventory build-up?
***********************************
Annuity
In the blog links to the right was an article written by Wade Pfau on the mechanics of income annuities. Even if you are not considering annuities, this is a good chance to expose yourself to some basic concepts about these financial products.
