Still Worried

November 1, 2015

Today is the day that U.S. readers fall back.  Let’s hope it’s the only thing that falls back!

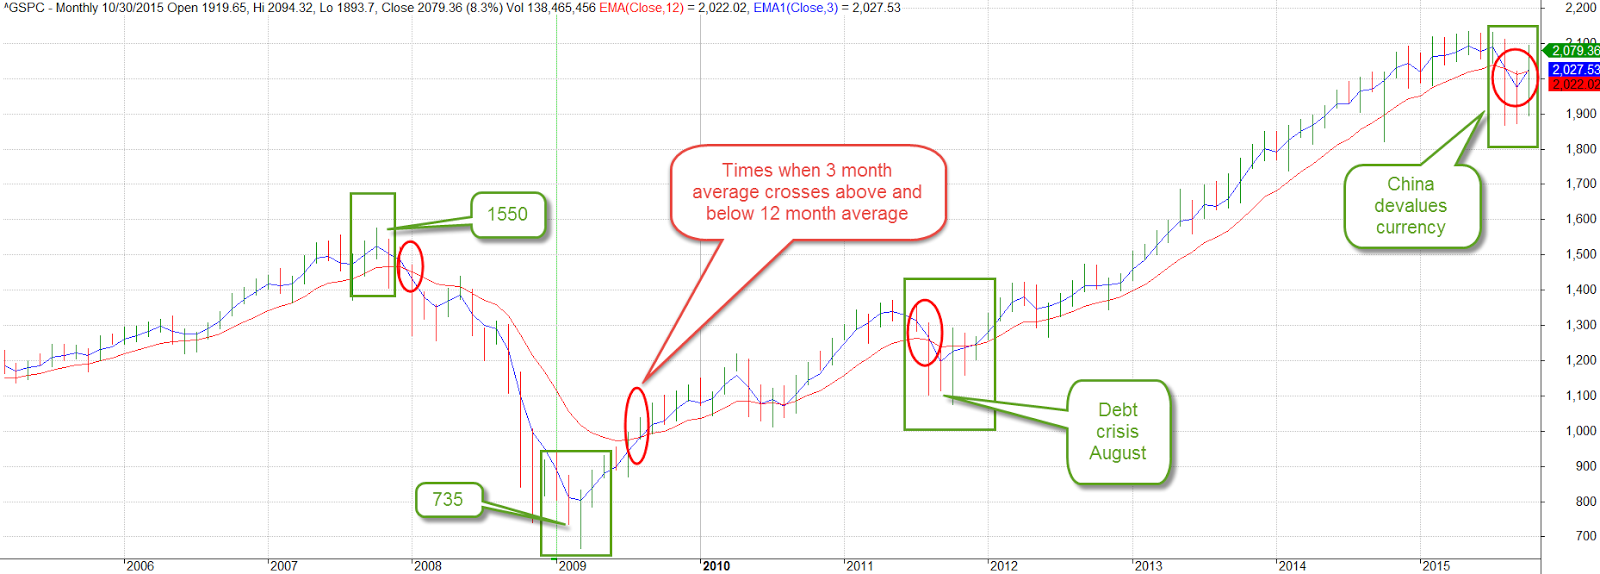
Eight years ago, in October 2007, the SP500 index reached a pre-recession high of 1550. After this month’s 8% recovery the index stands at 2079, more than a third above that long ago high.  A decade long chart of the SP500 shows the inflection points of sentiment.  We can compare two averages to understand the shifts in investor confidence.  A three month average, one quarter of a year, captures short term concerns and hesitations.  A one year average reflects doubts or optimisms that have strengthened over time.  The crossing of one average above or below the other gives us a signal that a change may be coming.  Concerns may be temporary – or not.

After falling below the 12 month average, the 3 month average strained and groaned to pull its chin above that long average, notching five consecutive weekly gains.  Both China and the EU central banks have announced plans for lower interest rates or QE to spur their economies.  Oil prices continued to bounce around under the $50 mark.  OPEC suppliers announced they could not agree on production cuts.  Fearing a continuing oversupply of crude, oil prices fell 4 – 5%.  Then came the news that the number of oil rigs in the U.S. had fallen.  Prices went back up.

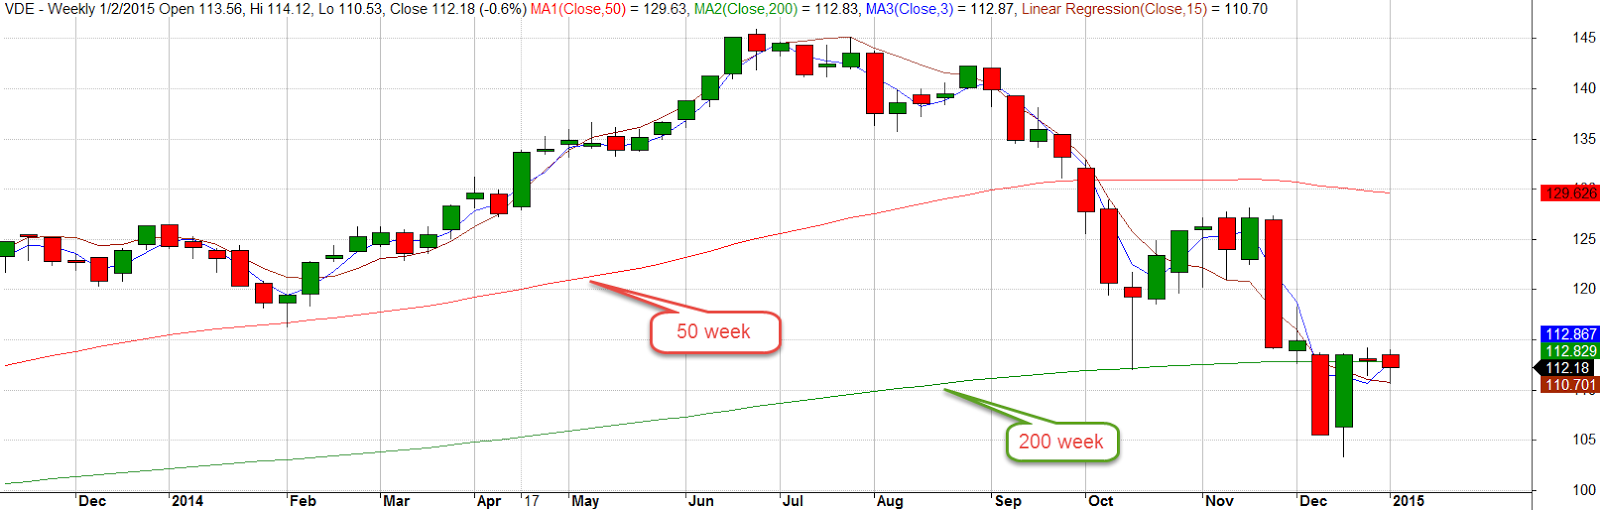
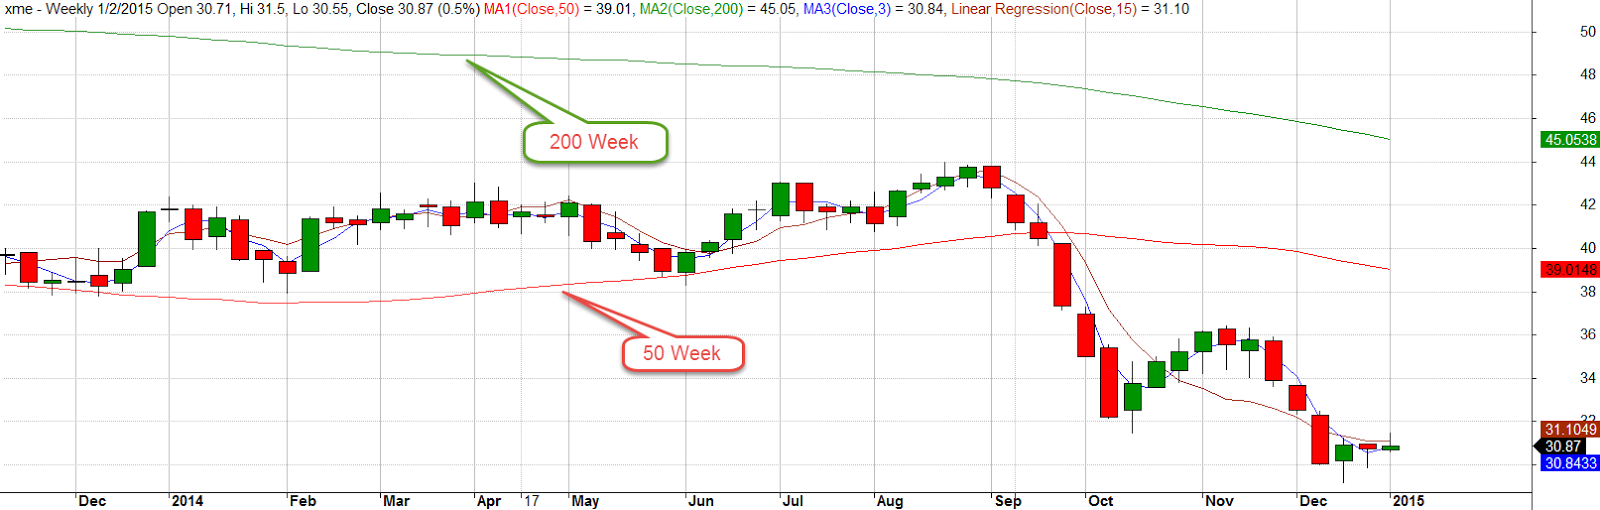
Commodities and mining stocks remain under pressure.  After falling over 18% in September, mining stocks gained back most of those losses in the first two weeks of October, then fell back in the last half of this month, closing the month with a 3% gain.  15 to 20% gains and losses in a sector during a month looks like so much scurrying and confusion.

Emerging market indexes lost ground this past week, slipping more than 4%.  Worries of a global recession continue to haunt various markets.  For large and medium U.S. companies, a slowdown in European and Asian markets is sure to have a negative effect on the bottom line.

The first estimate of 3rd quarter GDP growth was a paltry 1.5%, far below the 3.9% annual rate of the 2nd quarter.  Two-thirds of the SP500 companies have reported earnings for the 3rd quarter and FactSet estimates a decline of 2.2% for the quarter, the second consecutive quarter of earnings declines.

***********************

The Causes of Depression

The economic kind, not the emotional and psychological variety.  Economics history buffs will enjoy David Stockman’s critique of the extraordinary amount of monetary easing under former Fed chairman Ben Bernanke.  As President Reagan’s budget director, Stockman was at the forefront of supply side economics, a theory which promised an answer to the stagflation of the 1970s that drove many to question the assumptions and conclusions of Keynesian economics.

At first a champion of this new approach to economic policy making, Stockman grew disillusioned and later coined the term “voodoo economics” to describe the contradictory thinking of his boss and others in the Republican Party who stuck by their beliefs in supply side economics in spite of the evidence that these policies generated large budget deficits and erratic economic cycles.

In 2010, Stockman penned an editorial  that held some in the Republican Party, his party, culpable for the 2008 fiscal crisis.  He understands that politicians and policy makers become welded to their ideological platforms, disregarding any input that might upset their model of the world.

For those who have a bit of time, an Atlantic magazine December 1981 an article acquainted readers with David Stockman in his first year as budget director.  The budget process seems as broken today as it was 35 years ago when Stockman assumed the task of constructing a Federal budget.

 These “internal mysteries” of the budget process were not dwelt upon by either side, for there was no point in confusing the clear lines of political debate with a much deeper and unanswerable question: Does anyone truly understand, much less control, the dynamics of the federal budget intertwined with the mysteries of the national economy?

Stockman understands the political gamesmanship that permeates Washington.  He criticizes Bernanke’s analysis of the 2008 Great Recession as well as the 1930s Great Depression. Faulty analysis produces faulty remedies. Stockman goes still further, finding fault with Milton Friedman’s monetary analysis of the causes of the Great Depression.  In a 1963 study titled A Monetary History of the United States Friedman and co-author Anna Schwartz found that monetary actions by the Federal Reserve deepened and lengthened the 1930s Depression.  Friedman became the leading spokesman of monetarism in the late 20th century, the thinking that governments can more effectively guide a national economy by adjusting the money supply rather than employing an ever changing regime of fiscal policies.

Students of the great debate of the past 100 years – bottom up or top down? – will enjoy Stockman’s take on the matter.

New Year, No Fear

January 4th, 2015

As the calendar flips from December to January, some favorite activities are predictions for the coming year and reviews of the past year.  Here are a few predictions I’ve heard in the past few weeks:

“We think oil will continue to drift downwards as global demand slackens.”

“We think long term Treasuries will continue to show strong gains in the coming year.”

“Output remains strong, and the labor market continues to strengthen.  We expect further gains in the stock market this year.”

“We expect gold to find a bottom in the $900 to $1000 range and we will be initiating a long position at that time.”

Predictions are foolish, of course.  They are too certain.  An expectation is a bit more sober, a pronouncement of a probability.  Did anyone hear these expectations at the beginning of 2014?

“Oil prices will decline by 40% this year.”

“We expect long term Treasuries to gain 25% in 2014.”

“We expect the euro to fall to a 4-1/2 year low against the dollar.”

I don’t remember any of those predictions at the beginning of 2014.  So here’s my expectation – er, prediction: in 2015, I will be surprised by some of the events that will unfold.

If that doesn’t satisfy your prediction craving, here are several – let’s call them guesstimates – of SP500 earnings and price predictions in 2015.

*********************

Blue Light Specials

As I mentioned a few weeks ago, there are a few stock sectors that are “on sale,” selling below their 200 week, or 4 year average.  Falling gas prices in the last half of 2014 have had a negative impact on energy stocks (XLE, VDE).  Selling below their 200 week averages in December, both ETFs are hovering at their 200 week average.  The 50 week average is above the 200 week average, indicating that this is, so far, a relatively short term trend.

Emerging markets have been in the doldrums for a year and a half.  The 50 week average is just about to cross above the 200 week, signalling that the downturn may have exhausted itself.

The mining sector (XME) is down – way down.  The 50 week average is below the 200 week average and current prices of this ETF are below the 50 week average.  The mining sector can be quite cyclical but could be quite profitable in the next six months.

In the summer of 2011, the oil commodity ETF USO lost a third of its value.  In the melt down of 2008, it lost 75% of its value, falling from $115 down to near $30.  This week USO broke below $20, losing half of its value since July.  Since September 2009, shortly after the official end of the recession, the 50 week average has been trading in a range of $34 to $38, and is currently at the low point of that five year range.  While this may not be appropriate for a casual investor, it might be worth a look for those with some play money.

Other sectors – industrials, materials, finance, health, technology, consumer staples, consumer discretionary, retail and utilities – are above both their 50 and 200 week averages.

*********************

Happiness Is An Open Wallet

The Conference Board’s Consumer Confidence gauge rose still further above 90 in December.  At some time in the distant past, in a year called 1985, all the people were happier than they are today.  That long ago time became the benchmark 100 for this index.  The index number is less important than the trend of confidence – whether it is rising, falling or staying the same.

The Case Shiller 20 City Home Price Index for October showed a 4.5% yearly gain.  The double digit gains of last year and the first six months of 2014 were unsustainable.  However, I would be concerned if this continues to fall toward zero, indicating a serious softening of demand, or a lack of affordability or both.

***************************

The non-SP500 World

The SP500 index, composed of the 500 largest companies in the U.S., was up 11.4% for 2014. An index of mid, small and micro-cap companies was up a more modest 7.1% (Standard Poors) for the year.  An index of REITs was up 25.6% in 2014 after stalling during much of 2011, 2012 and 2013. I was surprised to learn that during the past twenty years, REITs outperformed the SP500.

Conventional wisdom holds that rising interest rates are bad for REIT stocks.  A study of REIT performance shows that the impact is less than most investors think. In addition, the income growth generated by REITs has outpaced inflation in all but one out the past 15 years. VNQ and RWR are two ETFs in this market space.  VNQ has a 10 year return of about 9%, RWR a bit less.

***************************

Social Security

The Social Security program depends on current taxes to pay current beneficiaries.  In per person inflation adjusted dollars, the federal government collects twice the amount of money it did forty years ago.  Per person revenues have almost caught up to the levels of 2006.

The problem is that there are a lot of people starting to retire.  Politicians of both parties have spent the excess social security taxes collected in the past decades.  Last week I asked what you would do if the stock market lost 30% of its value.

This week’s sobering question for those in or near retirement:  what would you do if social security payments were reduced, or means tested?  With the stroke of a pen, Congress could reduce the maximum monthly benefit from $2533 to say $2100.  This would affect a relatively small percentage of voters, those with higher incomes, a favorite target for benefit cuts.  Perhaps you are taking care of an ailing child or parent and need the income.  You might submit a 4 page form listing your pensions, IRAs, the assessed value of your home and any mortgage you had against the house, your mutual funds, stocks and bonds.  Using a complex formula to factor in your age, special circumstances, the cost of living index in your area and the total of your assets, the Social Security Administration would calculate your monthly benefit.  Can’t happen here in the land of the free, home of the brave?