Green Debt

March 17, 2019

by Steve Stofka

Imagine a world where, each year, the U.S. government (USG) gave $1000 to each of it’s approximately 300 million citizens (Note #1). The annual cost of the program would be $300 billion, about $120 billion more than the 2017 tax cuts (Note #2). As it does every year, the USG would borrow the money and issue Treasury bills, which are traded around the world. Although there is more than $23 trillion of Treasury debt – a plentiful supply – there is not enough to meet world demand.

Let’s say that the American people spent 80% of that $300 billion each year and saved the rest (Note #3). Let’s also calculate a multiplier of 1.5 so that the extra $240 billion of spending generates $360 billion of GDP (Note #4), about 1.7% of last year’s GDP. The increase in GDP would return about $60 billion to the USG in tax revenues (Note #5). The net cost to the USG is $300 billion less $60 billion in additional tax revenue = $240 billion.

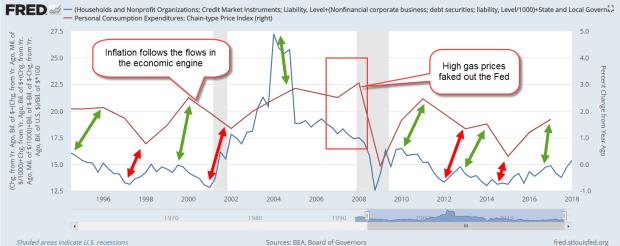
Will the slight increase in GDP each year generate higher inflation? Inflation occurs when too much money chases too few goods and resources. Efficiencies in world production of goods and services has caused a continuing deflation in developed economies. Against those headwinds, inflationary pressures will be modest.

At the end of ten years, this program would create an additional $3.5 trillion in U.S. debt, the same amount of debt that the Federal Reserve accumulated in 2008 to protect the jobs and bonuses of Wall St. bankers. The Fed still owns most of that debt (Note #6). Which is fairer? A program to distribute money equally to everyone or a program to distribute the same amount to a select few?

Implementation of such a program is unlikely but illustrates the lack of a moral rudder in our Congress. Self-branded fiscal conservatives in both parties promote the fiction that the Social Security and Medicare funds will “run out of money” at a certain date in the future. These funds are part of the Federal government and are nothing more than bookkeeping entries on the Federal government’s books. The Social Security Administration explains this: “[the funds] provide 1) an accounting mechanism for tracking all income to and disbursements from the trust funds, and (2) they hold the accumulated assets. These accumulated assets provide automatic spending authority to pay benefits” [my emphasis] (Note #7). The accumulated assets are paper IOUs from the government to itself so that Social Security benefits are beyond the reach of Congressional infighting and debate each year. When it was created, President Roosevelt called Social Security an insurance program because it was insured against Congressional tampering.

Republicans propose to privatize Social Security while Democrats propose additional taxes to “fully fund” Social Security. These schemes are built on accounting fictions and sold to the general public as prudent solutions. Will the trust funds run out of money? Congress can change this with a stroke of a pen. Just as they “borrowed” from the funds, they can “loan” to the funds (Note #8). Both parties are trying to convince voters that big changes must be made because Congress is too incompetent to make a small legislative change. Will voters buy this nonsense and let them keep their jobs?

Around the world, the value of US Treasury debt is more trusted than gold. It is more than a bond because it trades among commercial banks like currency. The U.S. enjoys a unique position. Its debt is a trusted part of the world’s savings. This country has worked hard and prudently to make the U.S. dollar the world’s money. Over the past century, the U.S. has managed its economy and debt better than other large developed countries. Let us take advantage of that position. Let’s stop the political ploys around Social Security and other federal entitlement programs. Let’s have a serious discussion about investing in building new schools and transportation solutions, as well as needed infrastructure repairs. Let’s stop posturing like buffoons and start behaving like the leader we are.

//////////////////////
Notes:

1. Census Quick Facts
2. Annual loss of tax revenue about $180 billion times 10 years = $1.8 trillion per CBO estimate 
3. Americans usually save about 5% of income.
4. More on fiscal multipliers. 1.5 is an average of various multipliers.
5. USG revenues average 17% of GDP.
6. Fed’s balance sheet over time. The Fed buys Treasury debt in the secondary market from large banks that buy the debt at Treasury auctions. The Fed continues to hold $1.6 trillion of mortgage-backed securities, the same kind of debt that led to the Financial Crisis. Current balance sheet.
7. Social Security Administration FAQ #1 on the nature of the funds . Also, see their page debunking SS myths promoted on the Internet
8. The Federal government pays below market interest rates for the money that it “borrowed” from the SSA funds. Decades ago, the interest rate was set at approx. the five-year average for funds “borrowed” for several decades. If 20 or 30 year rates had been used, the SS funds would be much larger. There would be no “crisis” to argue about.

Taxes – the Necessary Good

Taxes shall be levied according to ability to pay. – Franklin D. Roosevelt

August 19, 2018

by Steve Stofka

In the aggregate taxes are necessary and beneficial to everyone. Because Federal taxes act as a drain from the economic engine, they are different from state and local taxes. How those taxes are levied is a matter of policy debate, but they are necessary for the survival of a nation’s government and its economy. Revenue from natural resource production that is owned by a national government acts as a tax. Failing to understand that concept weakens and cracks governments around the world.

The inability to create money constrains state and local governments (Note #1). Taxes paid act as income for goods and services received from those governments. The Federal government has no such constraints. It does not need tax income as such. Rather, it must drain taxes to offset the amount of spending that it pumps into an economy. Inflation, the chief measure of extra money in an economy, rises when the Federal government doesn’t drain enough in taxes. As inflation rises, people turn to goods and service exchange that is not recorded and not taxed. The underground economy tries to offset the hidden tax of inflation.

As Venezuelans flee the runaway inflation in their country, they are running from too much spending and not enough taxation. Yes, it is counterintuitive. Venezuela owns the world’s largest reserve of oil. The net revenue from that oil competes with the taxes that a private oil company would pay to the government. The national government “owes” itself the tax revenues that it would have collected from a private company. Oil production has declined from 2.4 million barrels per day in 2008 to 1.2 million barrels in 2018 (see Note #2). Corruption and incompetence are the chief causes of the decline. Net oil revenue has declined by 95% from the bull market levels of the mid-2000s. Because the national government has not been paying their taxes, inflation has exploded the economy.

Because national politicians begin their careers in local politics, they regard a nationalized resource (NR) as a source of income, not an economic drain. That drain must be kept open through spending in oil infrastructure, training and transportation. In Venezuela, 2016 gross oil revenues were 20% of GDP and a net of less than 5% (see Note #3). Inflation taxes 100% of an economy. Because NR revenue acts as a pressure relief on inflation, that 20% portion of GDP affects 100% of the economy. A lack of understanding of the nature of a NR led to the crisis and decline of Great Britain in the 1970s, China in the 1960s and 1970s, and Zimbabwe in 2008.

How should a national government levy taxes on the taxpayers within the economy? FDR suggested “ability to pay.” For the past one hundred years we have measured ability to pay by income. Is that a good measure? French economist Thomas Piketty suggests that assets are a better measure. Local governments use this method to collect property taxes. Consider a retiree with $500K in liquid assets, who is taxed on $10K in interest and dividends earned each year. Clearly, the retiree’s assets are a better indication of his ability to pay. Should Congress abolish the income tax and tax people and corporations a multiple of what they pay in property taxes on their primary residence or business locations? Those living in high tax suburban and ex-urban areas might move toward lower-taxed urban areas. Would suburban areas actively recruit businesses to widen their tax base and lower property taxes? An intriguing thought.

Tax levies are the subject of endless debate because people cannot agree on what constitutes a fair tax. In the aggregate, the pressure reducing function of taxes benefits everyone, but is especially beneficial to those with less income. Should a national government impose a head tax on everyone? It could. That would amount to $15,000 per person this year, more than some families make. How does a national government extract tax money from its poor? It doesn’t. From 1958 – 1962, China forced taxes out of poor farmers in Mao’s Great Leap Forward (Note #4). Millions starved as a result.

Everyone should contribute equally to shared benefits, but practicality triumphs over principle. The survival of the national government becomes paramount. Some form of redistributive taxation must ensue. How to shape that redistribution? A government could take all the wealth of the ten richest people in America and still be short $3.8 trillion (Note #5). All the debate falls between total equality and total unfairness, and neither accomplishes the task of draining enough taxes out of the engine. A government could spend nothing: no defense, no research, no border or shore protection, no pension, medical or education spending. That’s a government in name only, and not for long. Other governments will want to capture control of that country’s resources.

The vast middle of the debate is an endless variety of proposals of “fairness” in both taxing and spending, a debate that has changed little since Cicero argued for his proposals in the Roman Senate in the first century B.C.E. What is not debatable is that a nation’s taxes must be roughly guided by its spending. A nation like Venezuela, which taxes half of what it spends, was headed for an economic tsunami of high inflation and inevitable collapse.

The debate is important. Just as it did in Rome two thousand years ago, consolidated party power corrupts. Because the current Presidency and House are held by the same party, we can expect a strong growth rate of net input, spending less taxes, and the data confirms the prediction. Net Federal input in the first full year of the Trump administration, April 2017 – March 2018, grew at a record-breaking annual pace of 19.6%, far above the sixty-year average of 8%. However – because Federal input has been so low this decade, the Federal government must continue this torrid pace of input in 2018 and 2019 just to reach the 8% average.

Republicans have held the House for the majority of the past three decades. Neither party agrees with the other party’s priorities, so the Republican strategy has been simple. They talk fiscal discipline and curtail Federal spending during Democratic administrations so that Republicans can spend big on their priorities when they have the Presidency. The Democrats did this for forty years when they held the House from 1954-1994 and will do so again when they have their next Congressional “run.”

To sum up: taxes are good, in general, but bad in the particular. No nation’s leader has stood on the world stage and said, “To tax or not to tax, that is the question.” For a nation and its economy, “to tax” is synonymous wtih “to be.”

/////////////////////////////

Notes:

1. Before the Civil War, each state controlled banking within its border (National Bank Act). For a deeper dive into state financing, try this Brookings Institute article.

2. A background paper on Venezuela oil (PDF). Crude oil production in the first quarter 2018 fell to 2.19 million barrels, a thirty-year low (Reuters). The Venezuela government spends more than 40% of GDP but collects only 20% in taxes (Statistica). During the 1997-2006 oil bull market, net revenues to the Venezuelan government averaged $20B per year (background paper above). Last year it was less than $1B. On August 20th, Venezuelans will lose their gasoline subsidies and pay a competitive price for gasoline (PDVSA article).

3. Gross oil revenue in 2016 was $48B, 20% of GDP of $236B (Reuters article). Exxon Mobil had a net profit of 6.5% in 2011. Venezuela would greatly benefit if the oil production was owned privately and paid 25-30% in income and other taxes.

4. Frank Dikotter was one of several historians afforded access to People’s Party records of the Great Leap Forward. He wrote an exhaustive account of human folly in Mao’s Great Famine .

5. Richest people in America  – Wikipedia 

Miscellaneous

Gold is down more than 10% in the past few months. BAR is a gold ETF launched in the past year. As an alternative to GDL and IAU, it has the lowest expense ratio at .2%. Here is a June 2018 article on the ETF.

Taxes – A Nation’s Tiller

Printing money is merely taxation in another form. – Peter Schiff


August 12, 2018

by Steve Stofka

The Federal government does not need taxes to fund its spending, so why does it impose them? Taxes act as a natural curb on the price pressures induced by Federal spending. Taxes can promote steady growth and allow the government to introduce more entropy into the economic system.

During World War 2, the Federal government ran deficits that were 25% of the entire economy (Note #1) and five times current deficit levels as a percent of the economy. Despite its monetary superpowers, the government imposes a wide range of taxes. Why?

Using the engine model I first introduced a few weeks ago (Note #2), taxes drain pressure from the economic system and act as a natural check on price inflation. During WW2, the government spent so much more than it taxed that it needed to impose wage and price controls to curb inflationary pressures. Does it matter how inflation is checked? Yes.

When price pressures are curbed by law, people turn to other currencies or barter. During WW2, the alternative was barter and do-it-yourself. Because neither of these is a recorded exchange of money, the government collected fewer taxes which further increased price pressure in the economic engine. After the war was over and price controls lifted, tax collections relieved the accumulated price pressures. As a percent of GDP, taxes collected were 50% more than current levels.

For the past fifty years, Federal tax collections have ranged from 10-12% of GDP, but they are not an isolated statistic. What matters is the difference between Federal spending and tax collections, or net Federal input. During the past two decades Federal input has become a growing share of GDP.

FedSpendLessTaxPctGDP

During the past sixty years, that net input has grown 8% per year. The growth rates have varied by decade but the strongest rates of input growth rates have occurred when the same party has held the Presidency and House. Neither party knows restraint. The lowest input growth has occurred when a Republican House restrains a Democratic President (Note #3).

FedNetInputGrowth

Let’s compare net Federal input to the growth of credit. As I wrote last week, the Federal government took a more dominant role in the economy in the late 1960s. By the year 2000, net Federal input grew at an annual rate of 10.3%, over one percent higher than credit growth. During all but six of those years, Democrats controlled the House and the purse. During those forty years, inequality grew.

FedNetInputCreditGrowth

During the 1990s and 2010s, government should have increased its net input to offset the lack of credit growth. To increase input, the government can increase spending, reduce taxes or a combination of both. When GDP growth is added to the chart, we can see why this decade’s GDP growth rate has been the lowest of the past six decades. It’s not rocket science; the inputs have been low.

FedNetInputCreditGrowthGDPGrowth

A universe with maximum entropy is a still universe because all the energy is uniformly distributed. At a minimum entropy, the universe exploded in the Big Bang. Too much clumping of money energy provokes rebellion. Too little clumping hampers investment and interest and condemns a nation to poverty. As an act of self-preservation, a government adopts redistributive tax policies. Among the developed nations, the U.S. is second only to France in the percent of disposable income it redistributes to its people (Note #4).

A nation can either tax its citizens directly, or add so much net input that it provokes higher inflation, which taxes people indirectly through the loss of purchasing power. Of the two alternatives, the former is the more desirable. In a democracy we can vote for those who spend our tax dollars. Inflation is both a tax and an unmanaged redistribution of money from the poor to the rich. How so? Credit is money. Higher inflation rates lead to higher interest rates which reduce access to credit for lower income households, and give households with greater assets a higher return on their savings.

////////////////////////////////

Notes:
1. Federal Income and Outlays at the Office Management and Budget, Historical Tables

2. The “engine” was first introduced in Hunt For Inflation, and continued in Hunt, Part 2 , Engine Flow , and Washington’s Role.

3. Federal spending less tax collections grew at a negative annual rate during the Clinton and Obama administrations. Both had to negotiate with a hostile Republican House in the last six years of their administrations.

4. “U.S. transfer payments constitute 28.5% of Americans’ disposable income—almost double the 15% reported by the Census Bureau. That’s a bigger share than in all large developed countries other than France, which redistributes 33.1% of its disposable income.” (WSJ – Paywall) The OECD’s computation of the GINI coefficient is based on disposable personal income, which is calculated differently in the U.S.

Miscellaneous:

Average GDP growth for the past sixty years has been 3.0%. The average inflation rate has been 3.3%. The 60-year median is 2.6%. The average inflation rate of the past two decades have been only 2.1%.

A good recap of the after effects of the financial crisis.


Washington’s Role

“The rich are much better placed to feed at the public trough. The poor get crumbs.” – Steve Hanke, American Economist, 1942 –

August 5, 2018

by Steve Stofka

In the past fifty years, the increasing role of the Federal government in the economy has been the chief contributor to inequality. In the last years of the Bush administration, America became a socialist economy. Credit growth under the Trump administration has not changed from the levels during the Obama administration. On this score, Trump is Obama II.

Since the Great Recession, the federal government has far surpassed the role of banks in net input into the economic engine. In the post WW2 period, the annual growth in credit outstanding (see Notes #1) to households, corporations, state and local government surpassed the net input of the federal government, its spending less the taxes it drained out of the engine. The blue line in the graph below is the growth in bank credit.

CreditGrowthvsFedInput1953-1970

The Great Society and the escalation of the Vietnam War in the 1960s marked a changing role for the Federal government. Bernie Sanders marked the early 1970s as the beginning of the increase in inequality. Bernie suggested that the Federal government should have a greater role in the economy to correct the problem. Bernie has it backwards, as I will show. It is the greater role of the Federal government in the economy that has contributed to inequality. The hand that feeds the poor becomes the hand that feeds the rich.

Under subsequent presidents after 1968, both Republican and Democratic, the Federal input into the economy dominated the net – loans minus payments – input of bank credit. When the Federal government spends more than it taxes, it becomes a proxy debtor for individuals, state and local governments who cannot borrow enough to meet their needs. As the net credit input into the economy sank in the last two years of the Bush administration, 2007-2008, the role of the Federal government approached the levels of western European socialist governments.

CreditGrowthVsFedInput

The Obama Administration and super-majority Democratic Congress of 2009-2010 simply held that input level established earlier by the Bush Administration and a Democratic House. When Republicans took control of the House in 2011, they fought with the Obama Administration to reduce the input level. From 2012 through 2015, the growth in credit eclipsed the net input of the Federal government. Since early 2016, the growth in Federal input has once again dominated the role of the banks in the private economy. After the tax cuts passed last year, the Federal government will drain less taxes out of the economy and further cement its dominant role as an input into the engine.

For the past 65 years, quarterly credit growth has averaged 1.9%. In the last ten years, it has averaged .4%. From April 2017, two months after Trump took office, through March 2018, quarterly net credit growth averaged the same .4% as it did during the Obama years. Banks may express confidence in the Trump presidency, but their credit policies indicate that they have as little confidence in Trump’s Washington as they had in Obama’s Washington. Unless Trump can turn that sentiment, his administration will suffer the same lackluster growth as the Obama administration. If the Federal government continues to dominate economic input, Trump’s pledge to drain the swamp will be broken. Federal economic power only feeds the K-Street crocodiles lurking in the swamp waters.

/////////////////////

Notes

  1. The growth of credit outstanding (net input) is a function of new credit issued (input), debtors’ payments on existing loans (drain) and the write-off of non-performing loans (drain).

K-Street in Washington is the location of many of the nation’s most powerful lobbying firms.


Engine Flow

July 29, 2018

by Steve Stofka

“Banking was conceived in inequity and born in sin” – Josiah Stamp

In the past two weeks, I’ve looked at the inputs and drains to the economic engine. This week I’ll look at the flow between bank credit, the largest input, and loan payments, the largest drain. Because bankers want to make a profit on the money they pump into the economy, they do a better job of managing the economy than government officials.  Banks manage access to the credit system better than governments and achieve less economic inequality. Whenever governments wrest control of credit creation away from the banks to promote greater equality, the country’s economy suffers.

Let’s begin with the first point; banks must protect their loan portfolios. To do that, they monitor the health of the economy. The Conference Board uses ten data series to construct its index of leading economic indicators to estimate the probability of recession. ECRI uses 50 data series to chart its weekly leading index. These indicators are sensitive and may give a false signal, indicating a coming recession which doesn’t occur. Watching these data series are the banks who form an emergent Artificial Intelligence machine that varies the amount of credit they input into the economic engine.

Let’s piggy back on the efforts and watchfulness of the banks. We can look for a change in the ratio of household credit, an input to the engine, to the unemployment rate, or the ability to drain the input. One quarter’s decline of 2% or greater in this ratio, or two quarters of a smaller decline has been a reliable indicator that a recession is approaching. Below is a graph of the Household Debt-Unemployment ratio during the past thirty years but this signal has been reliable since World War 2.

HouseholdDebtUnemploymentRate

Bank behavior has accurately predicted the start of every recession since WW2. Is this the holy grail for mid to long-term trading decisions? Not quite. The Federal Reserve does not release the total amount of household debt for each quarter until the end of the following quarter (see #1 at end). However, every month, the BLS releases the unemployment rate, the divisor in the Debt-Unemployment ratio. If the rate is lower than a year ago, no worries. If the year-over-year change in the rate is higher in two consecutive months, worry.

Unemploy

Here’s the same chart with the stock market’s reaction when the year-over-year change has been above zero for two months in a row. Insiders and market movers have lightened their exposure to equities.

UnemployStkMkt

Loans add money to the engine. Loan payments drain money from the engine. As unemployment rises, people reduce their loan payments. In managing their risk, the banks react to signs of economic weakness by reducing the amount of credit they issue. Because they are more responsive to evolving conditions than central banks and elected officials, banks manage the economy better than the government.

Access to credit is the key to understanding the disparity in fortunes among Americans. Let’s look at the flow of credit creation in a system where a bank can loan out ten times its deposits. Let’s say I borrow $10,000 from Bank A for a bath remodel. The contractor might have a gross profit of $2500 which he deposits in Bank B, who leverages that into a $25,000 loan to another customer, who remodels her basement. Her contractor’s gross profit of $5000 is deposited in Bank C, which leverages that into a $50,000 loan to another customer for a complete kitchen remodel. Only those people with good credit – the haves – can access this money machine. The machine is closed to the have-nots.

Governments have attempted to fix this inequality. The government borrows from the banks, acting as a substitute for the people who cannot borrow. The government then inputs the money into the economy, but this does not make the engine run because there is not enough being drained out in loan payments and taxes. The engine runs on flow – inputs and drains. One without the other damages the engine and makes the country vulnerable to a triggering event which causes collapse and the economic engine blows up. Yugoslavia (1994), Argentina (2000), Zimbabwe (2008) and Venezuela (2017) are the most recent examples.

Quoting an unnamed source, Winston Churchill said, “Democracy is the worst form of Government except for all those other forms that have been tried from time to time.”  Private bank management of credit creation is a terrible system, but far better than the other systems that have been tried.

///////////////////

Notes:
1. With a month delay, the Fed releases a monthly estimate of household debt that excludes mortgages and HELOCs.

Ten years after the recession, the amount of household debt per employee is still above trend. A ratio of debt to disposable income is below trend.

According to the credit reporting agency Experian “Transactors” are 29% of card holders and pay off their balance each month. 43% carry a balance. The rest are dormant accounts. Experian ranks states by the average credit rating of its residents.

Fannie Mae reports that, as of the end of 2017, 37% of the mortgages modified during the housing crisis had defaulted again.

Bank of America clients with High Net Worth reported that their allocations were 55% stocks, 21% bonds, 15% cash, 10% other.

In May, consumer credit increased at a seasonally adjusted annual rate of 7-1/2 percent. Revolving credit increased at an annual rate of 11-1/2 percent, while nonrevolving credit increased at an annual rate of 6-1/4 percent (Federal Reserve)


The Hunt, Part 2

July 22, 2018

by Steve Stofka

Last week, I showed the inputs to the credit constrained economy as a percent of GDP. I’ll put that up again here.

CreditGrowthFedSpendPctGDP

This week I’ll add in the drains but first let me review one of the inputs, bank loans. Focus your attention on that period just after 9/11, the left gray recession bar,  and the end of 2006, just to the left of the red box outlining the Great Recession on the right.  For those five years after 9/11, the banks doubled their loans to state and local governments, a surge of $1.4 trillion. The banks increased their household and mortgage lending by $5.3 trillion, or 67%. Why did banks act so foolishly? Former Fed chairman Alan Greenspan couldn’t answer that. We have a partial clue.

For 4-1/2 years after 9/11 and the dot-com bust, there was no growth in credit to businesses, a phenomenon unseen before in the data history since WW2. The banks reached out to households, as well as state and local governments because they needed the $1 trillion in loan business missing on the corporate side (#1 below).

There are four drains in the economic engine – Federal taxes, payments on loans, bad debts and the change in bank capital. State and local government taxes are not a drain because those government entities can not create credit. The change in bank capital reflects the changes in the banks’ loan leverage and their confidence in the economy. During the 1990s and 2010s the sum of the inputs and the drains remained within a tight range of about 1/7th of GDP.

InputLessDrains

The results of bad policy during the 2000s are shown clearly in the graph. In addition to the surge in bank loans, the Federal government went on a spending spree after 9/11. There was too much input and not enough drain. The reduction in taxes in 2001 and 2003 exacerbated the problem. There was less being drained out. Asset prices absorb policy mistakes until they don’t – a life lesson for all investors.

Let’s add in a second line to the graph – inflation. The rise and fall of inflation approximates the flows of this economic engine model with a lag time of several months. I’ve shown the peaks and troughs in each series.

InputLessDrainsVsPCE

Look at that critical period from 2006 through 2007. The Fed kept raising rates in response to rising inflation (the red line), driven primarily by increases in the price of oil.  The Fed Funds rate peaked out at 5-1/4% in the summer of 2006 and stayed at that level for a year. The Fed misread the longer term inflation trend and contributed to the onset of the recession in late 2007. The net flows in the engine model (blue line) indicated that the long term trend of inflation was down, not up.

Where will inflation go next? Using last week’s theme, follow the hounds! Who are the hounds? The banks. The inflow of credit from the banks is the primary driver of inflation. Why has inflation in the past decade been low? Because credit growth has been low. Where will inflation go next? A gentle increase – see the slight incline of the blue line at the right of the graph. Contributing to that increase were last year’s tax cuts. Less money is being drained out of the engine.

Too much flow into the economic engine or an improper setting of interest rates – these mistakes are absorbed by assets, which are the reservoirs of the engine. Stocks, bonds and homes are the most commonly held assets and most likely to be mispriced. During the early to mid 2000s, the mistakes in input were so drastic that the financial crisis seems inevitable when we look in the rear view mirror. During the past eight years, the inputs and drains have remained steady, but interest rates have been set at an inappropriate level. Again, we can anticipate that asset prices have been absorbing the mistakes in policy.


//////////////////////////

1. In the last quarter of 2001, loans to non-financial corporate business totaled $2.9 trillion and had averaged 6%+ growth for the past decade. Anticipating that same growth would have implied a credit balance of $3.9 trillion by the end of 2006. The actual balance was $3.1 trillion.

Hunt For Inflation

July 15, 2018

by Steve Stofka

Saddle up your horses, readers, because we are going on the Hunt for Inflation. I promise you’ll be home for afternoon tea. During this recovery, Inflation has been a wily fox, a real dodger. It has not behaved according to a model of fox behavior. Has Inflation evolved a consciousness?

Inflation often behaves quite predictably. The central bank lowers interest rates and pumps money into the economy. Too much money and credit chasing too few goods and Inflation begins running amuck. Tally-ho! Unleash the bloodhounds! The central bank raises interest rates which curbs the lending enthusiasm of its member banks through monetary policy. Inflation is caught, or tamed; the bloodhounds get bored and take a nap.

Not this time. Every time we think we see the tail of Inflation wagging, it turns out to be an illusion. Knowing that Inflation must be out there, the central bank has cautiously bumped up interest rates in the past two years. Every few months another bump, as though unleashing one more bloodhound ready to pounce as soon as Inflation shows itself.

Yes, Inflation has evolved a consciousness – the composite actions of the players in the Hunt. These players come in three varieties. One variety is the private sector – you and me and the business down the street. The second variety is the federal government and its authorized money agent, the Federal Reserve, the country’s central bank. Finally, there is a player who is a hybrid of the two – banks. They are private but have super powers conferred on them by the federal government. The private sector is the economic engine. The federal government and banks have inputs, drains and reservoirs that control the running of the economy.

The three money inputs into the constrained (see end) economy are 1) Federal spending, 2) Credit growth, and 3) net exports. In the graph below, the blue line includes 1, 2, and 3. The red line includes only 1. The graph shows the dramatic collapse of credit growth in this country. Federal spending accounted for all the new money flows into the economy.

CreditNXFedSpendvsFedSpend

Before the financial crisis, money flows into the economy were just over 30% of GDP. In less than a year, those inputs collapsed by almost 25%.

CreditGrowthFedSpendPctGDP

When inflation is lower than target, as it has been for the past decade, too much money flow is being drained out for the amount that is flowing in. In the case of too high or out of control inflation, as in the case of Venezuela, the opposite is true. Too much is being pumped in and not enough is being drained out. That’s the short story that gets you back to the lodge in time for a cup-pa or a pint. Next week – the inputs, drains and reservoirs of the economy.

////////////////////////////

  1. Constrained – the private economy, state and local governments who cannot create new credit.
  2. Net exports are the sum of imports (minus) and exports (plus).