Printing money is merely taxation in another form. – Peter Schiff
August 12, 2018
by Steve Stofka
The Federal government does not need taxes to fund its spending, so why does it impose them? Taxes act as a natural curb on the price pressures induced by Federal spending. Taxes can promote steady growth and allow the government to introduce more entropy into the economic system.
During World War 2, the Federal government ran deficits that were 25% of the entire economy (Note #1) and five times current deficit levels as a percent of the economy. Despite its monetary superpowers, the government imposes a wide range of taxes. Why?
Using the engine model I first introduced a few weeks ago (Note #2), taxes drain pressure from the economic system and act as a natural check on price inflation. During WW2, the government spent so much more than it taxed that it needed to impose wage and price controls to curb inflationary pressures. Does it matter how inflation is checked? Yes.
When price pressures are curbed by law, people turn to other currencies or barter. During WW2, the alternative was barter and do-it-yourself. Because neither of these is a recorded exchange of money, the government collected fewer taxes which further increased price pressure in the economic engine. After the war was over and price controls lifted, tax collections relieved the accumulated price pressures. As a percent of GDP, taxes collected were 50% more than current levels.
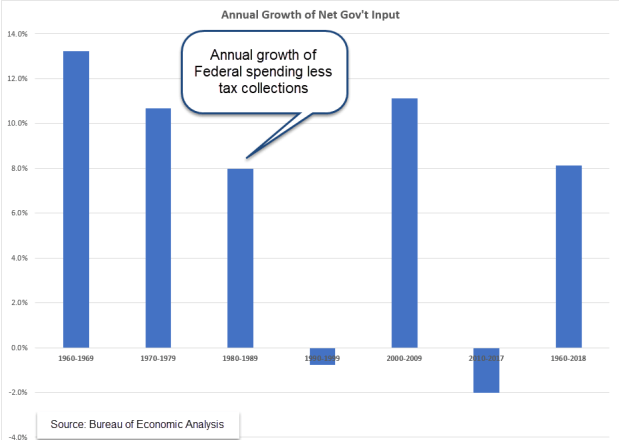
For the past fifty years, Federal tax collections have ranged from 10-12% of GDP, but they are not an isolated statistic. What matters is the difference between Federal spending and tax collections, or net Federal input. During the past two decades Federal input has become a growing share of GDP.

During the past sixty years, that net input has grown 8% per year. The growth rates have varied by decade but the strongest rates of input growth rates have occurred when the same party has held the Presidency and House. Neither party knows restraint. The lowest input growth has occurred when a Republican House restrains a Democratic President (Note #3).
Let’s compare net Federal input to the growth of credit. As I wrote last week, the Federal government took a more dominant role in the economy in the late 1960s. By the year 2000, net Federal input grew at an annual rate of 10.3%, over one percent higher than credit growth. During all but six of those years, Democrats controlled the House and the purse. During those forty years, inequality grew.
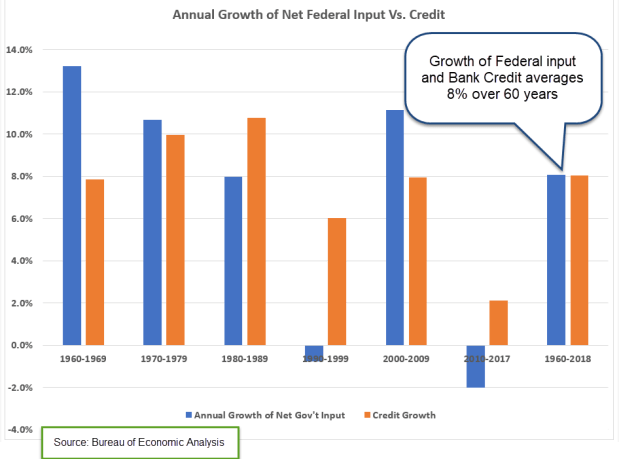
During the 1990s and 2010s, government should have increased its net input to offset the lack of credit growth. To increase input, the government can increase spending, reduce taxes or a combination of both. When GDP growth is added to the chart, we can see why this decade’s GDP growth rate has been the lowest of the past six decades. It’s not rocket science; the inputs have been low.

A universe with maximum entropy is a still universe because all the energy is uniformly distributed. At a minimum entropy, the universe exploded in the Big Bang. Too much clumping of money energy provokes rebellion. Too little clumping hampers investment and interest and condemns a nation to poverty. As an act of self-preservation, a government adopts redistributive tax policies. Among the developed nations, the U.S. is second only to France in the percent of disposable income it redistributes to its people (Note #4).
A nation can either tax its citizens directly, or add so much net input that it provokes higher inflation, which taxes people indirectly through the loss of purchasing power. Of the two alternatives, the former is the more desirable. In a democracy we can vote for those who spend our tax dollars. Inflation is both a tax and an unmanaged redistribution of money from the poor to the rich. How so? Credit is money. Higher inflation rates lead to higher interest rates which reduce access to credit for lower income households, and give households with greater assets a higher return on their savings.
////////////////////////////////
Notes:
1. Federal Income and Outlays at the Office Management and Budget, Historical Tables
2. The “engine” was first introduced in Hunt For Inflation, and continued in Hunt, Part 2 , Engine Flow , and Washington’s Role.
3. Federal spending less tax collections grew at a negative annual rate during the Clinton and Obama administrations. Both had to negotiate with a hostile Republican House in the last six years of their administrations.
4. “U.S. transfer payments constitute 28.5% of Americans’ disposable income—almost double the 15% reported by the Census Bureau. That’s a bigger share than in all large developed countries other than France, which redistributes 33.1% of its disposable income.” (WSJ – Paywall) The OECD’s computation of the GINI coefficient is based on disposable personal income, which is calculated differently in the U.S.
Miscellaneous:
Average GDP growth for the past sixty years has been 3.0%. The average inflation rate has been 3.3%. The 60-year median is 2.6%. The average inflation rate of the past two decades have been only 2.1%.
A good recap of the after effects of the financial crisis.
