December 10, 2023
by Stephen Stofka
This week’s letter is about public goods and the characteristics of public goods. I’ll discuss whether money or a digital currency is a public good. I’ll explore the four types of goods as economists classify them. These properties can enrich our understanding of some contentious debates. Hop on board as we tour the safari park of economic ideas.
Economists use two criteria to classify goods: whether they are rival and whether they are excludable. Rival means that one person’s consumption of a good lessens another person’s consumption of the good. An excludable good means that there is a feasible mechanism to prevent someone from consuming a good. A private good is both rival and excludable. A public good is both non-rival and non-excludable. It helps to look at public goods from a cost perspective. The marginal cost of providing the good to one more person is practically zero. The marginal cost to prevent someone from consuming a public good is very high.
An example of a public good is the national defense. One person’s protection from attack has little if any effect on another person’s protection. A country cannot practically prevent someone from being protected. Another example is firework displays. Although we call the street out in front of our house a “public street,” it is a toll good or club good according to these characteristics. Once built and maintained, the cost for one more driver to use the road is zero so it is non-rival just like the national defense. But it can be made exclusive at a reasonable cost by restricting access. A toll road is an example. A city makes a street public by decree, not by any characteristic of the road. A decree can be undone as when a city converts a city street to a pedestrian mall.
Another type of good is rival but non-exclusive. These are called pooled goods. A classic example is fishing in the ocean. The fish that someone catches are no longer available to someone else so they are a rival good. However, it is difficult and costly to prevent someone from fishing in the ocean. Pooled goods typically include natural resources or game animals. A government manages the depletion of the resource by issuing licenses and imposing fines. Overfishing of the world’s oceans has been a contentious issue for decades.
Governments have managed the problem of pooled resources by selling a property or use right to a private owner. The manager restricts access to the resource and charges a fee to users of the resource, effectively turning a pooled good into a toll good. A use right might be in the form of a 99 year renewable lease or a public-private partnership where a private company manages a park or other natural resource.
These characteristics can provoke some lively discussion. For instance, is money a public good? It might seem so. It costs almost nothing to make another $1 of currency. But providing the next $1 of currency requires billions of dollars of legislative and judicial debate because public spending is rival. If that $1 is spent on one cause, it cannot be spent for another project. If transferred to one person, that same $1 cannot be given to another person. Is it excludable? Social spending programs are based on criteria that exclude some while entitling others to the benefits of the program. We argue so much about “public” spending because the spending itself has characteristics of a private good. It is rival and excludable. Once built an air defense system might act as a public good, providing non-excludable protection. The spending itself is not a public good.
Let’s follow the path of a tax dollar. It went from a private party through a banking system that restricts access to money resources, then into a government pool where it became an indistinguishable unit of tax revenue, a pooled good, then became private again when the tax dollar was spent or transferred to someone. If spent, the use of the good or service became public in some sense. An air defense system or the building of a public library, for example. If transferred to a person, the money was spent in the private economy for goods and services like food and rent. The transformation of private dollars to public pot and back to private dollars is accompanied by a lot of heated debate.
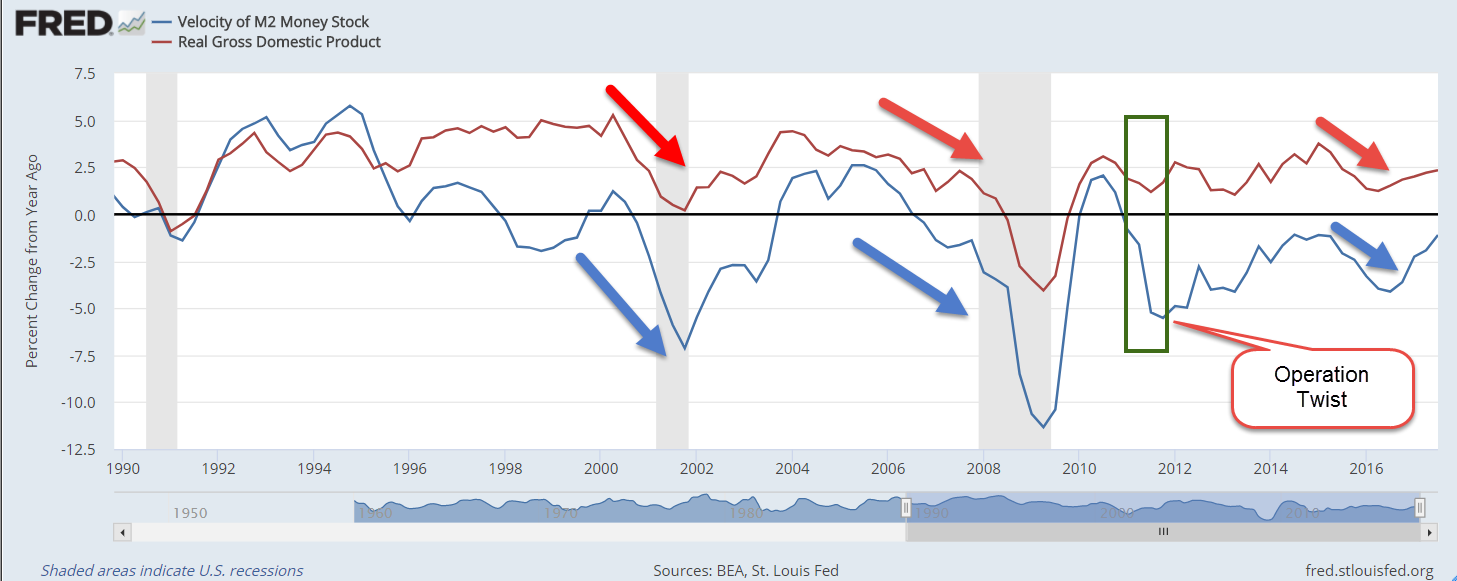
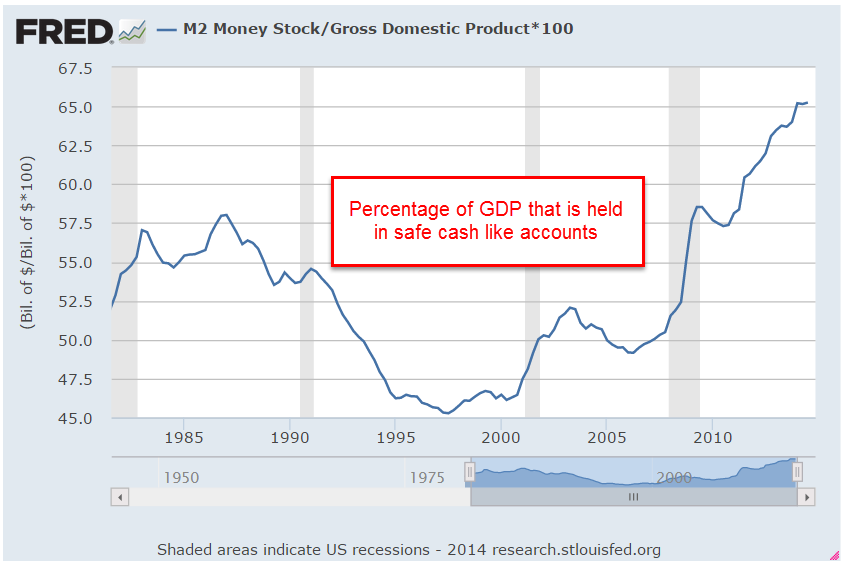
The money supply has characteristics of a pooled good although it is not a natural resource. In circulation it acquires the characteristics of a natural resource, a good that has many access points. A government manages the money supply like a pooled resource. It licenses out the ability to create money to member banks, imposing some regulations and trusting that the discipline of gain and loss will cause banks to act prudently when making loans that increase the money supply. However, banks don’t just loan money to individuals and businesses. They loan money to financial institutions who loan money, thus magnifying the power of the money-creation process.
Money in the economy acts like a magnetic field in a giant turbine. The turbine turns as long as the magnetic field keeps changing. Money has the characteristics of a private good in exchange, then a pooled good in taxation and a toll good in the banking system, and then a private good again. Money can buy public goods and services but can’t assume the characteristics of a public good. Like money, a digital currency like Bitcoin has an exchange power between private parties that relies on the seller’s willingness to accept payment in Bitcoin. But it cannot act as another type of good because the government refuses to accept Bitcoin as a payment for taxes. Doing so would interrupt its control of the money licensing process. Money then becomes an intermediary in a Bitcoin exchange, like the Universal Translator on the original Star Trek TV series. Money is adaptable to each type of good for which it is exchanged. That adaptability gives money power, a power that governments have abused in centuries past, giving people a cause for concern.
///////////////
Photo by Richard Horvath on Unsplash
Keywords: private goods, public goods, toll goods, club goods, private goods. Bitcoin, digital currency.