Homeless

April 20, 2025

By Stephen Stofka

This is part of a series on persistent problems. The conversations are voiced by Abel, a Wilsonian with a faith that government can ameliorate social and economic injustices to improve society’s welfare, and Cain, who believes that individual autonomy, the free market and the price system promote the greatest good.

Abel waited until the waiter had finished pouring the coffee, then said, “This week, Trump is threatening to take away Harvard’s tax-exempt status. This country is becoming a banana republic where those in power use the state to go after their political rivals.”

Cain dribbled a small amount of sugar into his coffee then set the sugar packet on the table. “In his first administration, Trump put an excise tax on the biggest universities (Source). Certainly, there are a lot of religious conservatives who resent the denial of tax-exempt status to religious universities like Bob Jones University.”

Abel argued, “That was a long time ago and the issue was whether Bob Jones was a non-profit institution, not that it was religious. Colorado Christian University in Denver is tax-exempt, for example (Source).”

Cain replied, “Last week you talked about Make America Fair Again. One group of people perceive something as unfair, and that grievance helps bind them together. Another group of people faults the first group for being unreasonable, and the first group circles their wagons, convinced that they are being picked on. Remember when a lot of Tea Party groups were denied tax-exempt status?”

Abel nodded. “The IRS didn’t deny their applications, but put them on hold. Any applications with the words Tea Party or patriots in the name (Source). The agency was overwhelmed with 501(c)(4) applications for the 2010 midterms. One of the reasons they were overwhelmed was that Republicans had cut funding to the agency while they were in power.”

Cain set his cup down. “Perfectly rational explanations. Or a conspiracy? Rebutting a grievance with logical arguments is fruitless, yet we continue to do it. Expressing a grievance is a form of signaling to others. Political parties are built on shared grievances as well as shared principles, perspectives and values.”

Abel smiled. “Good point. This country was founded on shared grievances. ‘Abuses and usurpations’ the Declaration of Independence called them, and most of that declaration is filled with grievances, not the noble sentiments about life, liberty and the pursuit of happiness (Source).

Cain waited as the waiter set the food on the table, then said, “So we were going to talk about collective action problems, something other than the latest abuse by the mad king.”

Abel laughed. “That describes him well. His niece, Mary Trump, warned us in Too Much and Never Enough, the book she wrote about her Uncle Donald.”

Cain sighed. “In his second administration, we are discovering how rash he can be. He’s worse than any Democratic president I can recall for his interference in the economy and the market.”

Abel asked, “Worse than a President Bernie Sanders?”

Cain nodded. “Sure. Bernie has some respect for institutional rules. Trump couldn’t care less. Hey, we were going to talk about something other than Trump this week.”

Abel replied, “Right. I’ve been thinking about homelessness. You are always championing the role of incentives. I thought of a policy that would align incentives to allow more permissive zoning.”

Cain reached for his back pocket. “Let me hold onto my wallet.”

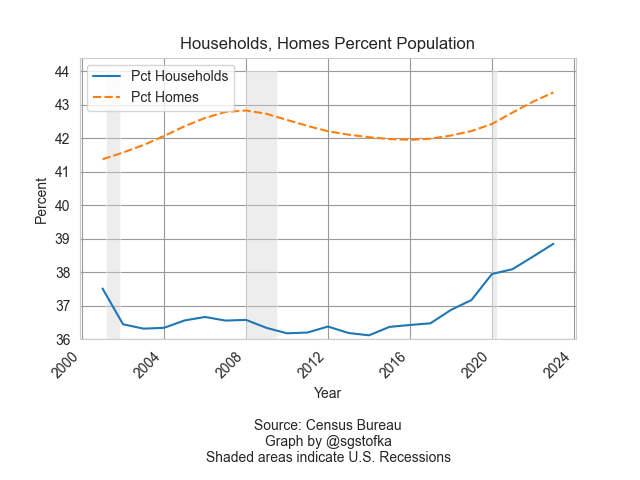
Abel laughed. “There are several characteristics of collective action problems and dealing with the homeless has several of those. People resist multi-family development for fear that it will lower the value of their home. Zoning that permits only single-family housing reduces the opportunities for developers to build more housing. A shortage of housing causes home prices and rents to rise, increasing homelessness.”

Cain interrupted, “Less supply, higher housing costs. Classic supply demand response. But rising home prices are a good thing for an existing homeowner. Naturally, they want policies that preserve the value of their asset.”

Abel nodded. “That’s my point. What’s good for each individual homeowner may not be good for society as a whole. Individual benefit, group loss. Garret Hardin pointed that out in his essay Tragedy of the Commons (Source). Each herder has an incentive to graze their animals on common land, land that no one owns. Together, they overgraze the area and there is no grass for anyone.”

Cain frowned. “Residential land is privately owned.”

Abel argued, “But the zoning is like a common resource. Also, homeowners in single-family zoning are contributing to the homeless problem but paying nothing for the extra city resources needed to deal with the problem. So, they are free riding in a sense, another characteristic of collective action problems.”

Cain finished chewing. Wait. Homeless people are the biggest free riders, but you chose to focus on the hard-working homeowners.”

Abel shook his head. “I’m just pointing out the free-riding aspect of the zoning problem.”

Cain argued, “I hate when liberals say the homeless problem is a zoning problem. Zoning is a relatively small part of the problem.”

Abel replied, “Well, let me finish. Third, there’s the public goods aspect. Presumably, everyone in the city benefits from less homelessness and no one can be excluded from those benefits. Less communicable disease. What else? A sense of pride in the city? And fourth, the homeless detract from people’s enjoyment of public parks, so there’s that aspect of the collective action problem.”

Cain put down his fork. “That’s a nice analysis. Let me come at it from a different angle. Incentives. Look at the incentives to be homeless.”

Abel scoffed, “What? Like free rent?”

Cain argued, “Why do homeless people gather in cities? They like the anonymity. It gives them a sense of independence. They rely on medical services far more than the general population (Source). There are outreach programs available to supply them with food, shelter and clothing. In some cases, inexpensive tents (Source). All of that charity makes homelessness at least more tolerable. One part of the solution is to make it less tolerable.”

Abel interrupted, “What? Put them in jail? Refuse them medical service and let them die? Last week, you said that we should build policies around price incentives. This week, you’re saying let’s build policy on a framework of cruelty?”

Cain smirked. “Give me a break. Last week I said that the price system is thousands of experiments in opportunity costs. Give up this to get that.”

Abel nodded. “The trade-offs act as a counterbalancing mechanism. Homeless people are often beyond the bargaining of trade-offs. In the case of addiction, they’ve already traded their family, their job, their stability for the hamster cage of drug addiction. Those with mental health issues may not be capable of recognizing the choices involved in a trade-off. They may hear voices and imagine conspiracies. Then there are those who are working but are too poor to afford rent in an expensive area. They didn’t voluntarily make a choice to become homeless. Circumstances boxed them in.”

Cain shook his head. “Or there own choices boxed them in.”

Abel argued, “So you’re going to punish them for making bad choices? Isn’t homelessness punishment enough?”

Cain frowned. “Why do homeless people tend to congregate in one area? The police allow it. It attracts more advocates for the homeless who bring food and clothes, the support system that enables their homelessness. The city should prevent such encampments. Why doesn’t it? Policy decisions from liberal politicians who follow Marx’s rule of distributing stuff according to need, not ability. They sacrifice the well-being of their hard-working citizens to tolerate homelessness.”

Abel shook his head. “How many cops want to get involved in restraining and removing people who are not right in the head or on some kind of drug? Cops are likely to quit one police force and join one in a neighboring district where the homeless problem is less acute. It’s a complex problem.”

Cain asked, “So what’s your policy solution?”

Abel shrugged. “Not a solution, but something that would address the zoning aspect of the problem. What if there were a property tax charge for every subdistrict in a city that had single-family zoning? People would then be paying annually for a zoning regulation that they think preserves the value of their property. I would call it an equity insurance fee rather than a tax.”

Cain replied, “I live in a neighborhood that is zoned for single-family homes only. So, I would see a separate charge on my property tax bill for that zoning?”

Abel nodded. “Yes. Connecting the annual cost to the benefit you receive from the zoning.”

Cain raised his eyebrows. “How I would react would depend on the percentage change in my property taxes. If it was another $100 a year, I might not object. But you want to make it cost enough that it would encourage homeowners in a single-family zone to lower their resistance to multi-family development.”

Abel nodded. “That’s the point. I don’t know what percentage increase would do that.”

Cain replied, “Essentially, single-family zoning would become a privilege that only those with higher incomes could afford to pay. Last week, you talked about Make America Fair Again. How fair is that policy to homeowners in older, more established neighborhoods? They are more likely to be retired and on fixed incomes. Already, they resent the increase in their property taxes from higher assessed valuations. Now the city is going to impose yet another fee on them.”

Abel sat back in his seat. “No policy can be fair to everyone.”

Cain objected, “What if there is no visible sign of homelessness in a neighborhood? Homeowners may not see the necessity of such a policy. They will be motivated to vote against it. I like the analysis, though. Shows the complexity of these problems. A viable solution would address all four of those aspects.”

Abel agreed, “You always emphasize the relation between prices and incentives. Homeowners are not incentivized to adopt policies that will increase the supply of housing if it will make the value of their property decline.”

Cain replied, “Exactly. Any policy you put in place will act against that natural tendency. You call it an insurance fee, but since it applies to all homeowners in a district, it acts like a tax. Unlike a price, a tax does not obey the natural forces of supply and demand.”

Abel argued, “A tax raises the price and higher prices reduce demand.”

Cain shook his head. “Yeah, but prices react to something real. They react.”

Abel shrugged. “Can’t see the difference. A tax reacts to something real. In this case, it’s homelessness.”

Cain argued, “The tax you are proposing is an incentive, not a reaction. It is a stimulus you hope will get homeowners to adopt a more lenient attitude toward permissive zoning. Take this, for comparison. A city does not impose a sales tax because they hope it will dissuade people from buying goods. The tax is a reaction to city’s need for revenue to fund the services it provides.”

Abel replied, “So called sin taxes are meant as incentives to get people to buy less.”

Cain laughed. “Don’t try to sell your insurance fee as a sin tax. Owning a home isn’t a sin in anyone’s playbook.”

Abel moved his plate aside. “So, Trump’s tariffs are meant as incentives or punishments and they distort the market.”

Cain nodded. “Before the 16th Amendment, tariffs were the chief source of revenue for the federal government. They served other purposes, yes, but they generated much needed revenue. Today, any tariff revenue would be a drop in the bucket. Trump’s tariffs act as carrots and sticks. That may be the extent of all of Trump’s policies. Carrots and sticks.”

Abel frowned. “There are a lot of carrots and sticks in the income tax code. Tax deductions for college expenses, health insurance, retirement contributions. These are all attempts to get people to do more of something that they would naturally. So how can saving for retirement or going to college distort the market?”

Cain replied, “Tax-advantaged plans were introduced in the 1970s (Source). The financial sector manages trillions of dollars in retirement accounts. That gives it more market share and political power.”

Abel asked, “I take it you’re opposed to any tax whose primary purpose is to influence behavior, not collect revenue?”

Cain drew a deep breath. “I do, but I’m a realist. People get into politics because they want to exert their values, their sense of justice on other people. Now we’ve got someone in the White House who takes that to the limit. I worry for the free market system. I worry for democracy.”

Abel raised an eyebrow. “You weren’t worried last November?”

Cain smirked. “You are more of an institutionalist, but I think I trusted in the institutions that have kept this country together for more than two hundred years. The institutional rules as well as the laws. Seeing long-standing practices fall so quickly has made me question the strength of those institutions. In a political sense, I feel homeless.”

Abel asked, “You think there was insider trading going on while Trump flip-flopped on tariff policy?”

Cain nodded. “Sure. The SEC is not going to investigate. It seems like most of the government is being run by acting commissioners without Senate confirmation. Those of us who complained about the complexity of government are getting a chance to see what it is like when a bunch of loyalists run the government.”

Abel stood up. “I am afraid that we are losing the world’s confidence in American institutions, particularly its currency. I’ll see you next week.”

Cain seemed lost in thought for a minute. “Yeah, next week.”

///////////////

Image by ChatGPT in response to the prompt, “draw an image of a tent with a disheveled person poking his head out of the opening of the tent.”

Make America Fair Again

April 13, 2025

By Stephen Stofka

This is part of a series on centralized power. The debates are voiced by Abel, a Wilsonian with a faith that government can ameliorate social and economic injustices to improve society’s welfare, and Cain, who believes that individual autonomy, the free market and the price system promote the greatest good.

Abel tucked a table napkin into his belt. “Another uneventful week.”

Cain smirked as he cut a bite from his stack of pancakes. “Will the country last four years?”

Abel sighed. “Sometimes I dream that the voting public turns the House and Senate over to the Democrats so they can impeach him.”

Cain laughed. “There would be another January 6th when the new members took their oath of office.”

Abel frowned. “That’s what I worry about. Trump has too many of the same characteristics as other autocrats. Maduro in Venezuela, Erdogan in Türkiye come to mind. They freeze out the opposition party. Laura Gamboa had a piece in Foreign Affairs this month about past incidents (Source).  In 2003, Erdogan and his party began a campaign that either crippled or took over parts of the bureaucracy in Türkiye. Although the opposition stopped some legislation, in the first four years, Erdogan was able to totally seize power in 2007.

Cain gave a soft whistle. “Yeah, in any kind of governing, it’s ‘process over substance.’ I remember some Congressman saying something like, ‘I’ll let you write the substance … you let me write the procedure, and I’ll screw you every time.’” (Source)

Abel smiled. “Yeah, that was John Dingell. Served in Congress for fifty years! Anyway, a good example of that. Trump has extended his powers by declaring an emergency. What’s the emergency? Not a pandemic, or a war, an attack from China. No, it’s the trade deficit. Under the National Emergencies Act, Congress can pass a joint resolution declaring an end to the emergency (Source).”

Cain interrupted, “Yeah, but Trump could still veto the resolution.”

Abel nodded. “True. A higher hurdle to formally end an emergency. The House has a Rules Committee that decides on how legislation is brought to the floor. So, Congress can initiate a declaration ending an emergency declared by the President. It would send a word of caution to the White House.”

Cain raised his eyebrows. “You know, there’s no definition of emergency under the IEEPA, the law that Trump is using [Source].”

Abel nodded. “The IEEPA is another of those laws passed in the 1970s with no definitions. Another example is ‘waters of the United States.’ What does that mean? Courts, including the Supreme Court, have been arguing about it for 50 years (Source). Today, all serious legislation contains definitions.”

Cain replied, “So I didn’t know Congress could undo that. Go ahead.”

Abel continued, “So the Rules Committee just wrote a rule a few weeks ago that prevents any member from raising an objection that lead to a vote to declare an end to the emergency (Source). That tweak of the rules gets little attention but curtails any effective opposition in the House to Trump’s expansion of powers. Republicans in the House don’t want to go on the record opposing Trump. It was that kind of stuff that Gamboa was writing about.”

Cain said, “The slim Republican majority in the House weakens any checks and balances. Like I said last week, Trump has gone rogue.”

Abel argued, “He’s put together a team of rogues. Yes men and yes women. Sycophants who suck up to power and those who cower in the corner, hoping not to attract anger from Trump or Musk. The nominee to head the Bureau of Land Management just withdrew her nomination after it was revealed that she had written a memo criticizing Trump after the 2020 election (Source).”

Cain put down his fork. “I think there are some independent voices, but they are reluctant to come forward. Rumor is that Trump paused the reciprocal tariffs, the really high ones, because some people warned him that the bond market was starting to crack. At first, investors started moving into Treasuries as expected but then the rate on 10-year Treasuries started to rise, indicating that the nosebleed tariffs were causing investors to lose confidence in Treasuries (Source). US debt is like the Titanic was thought to be. Unsinkable.”

Abel frowned. “That’s why mortgage rates shot up half a percent, back up to 6.90% (Source). The mortgage market tends to move with the long-term Treasuries.”

Cain asked, “Just yesterday, mortgage rates broke the 7% threshold. Can the President of the United States cause a financial crisis? Maybe.”

Abel put set his coffee cup down. “Trump’s had several bankruptcies. His dad helped to bail him out of his brash bets on the casino industry in Atlantic City (Source). He was having trouble getting financing, so he ran for President to boost his name recognition.”

Cain sighed. “I think a lot of us voted for someone who could get things done, even he was a little bit crazy and impulsive.”

Abel said, “This last election, Trump attracted people outside of his core MAGA supporters. What does ‘great’ mean? Different things to different people. Some thought Trump would bring down prices. He promised to do that on ‘day one’ of his presidency. Some thought he would end the war in Ukraine because he promised to do that. Some thought he would be pro-business and curb the regulatory state.”

Cain replied, “Yeah, Trump’s a promoter. That’s what politicians do. Different people have different levels of gullibility. Even a skeptic can be convinced if the promises confirm their beliefs and desires. I think a lot of pro-business types bought into Trump’s promise to cut back on regulations. These tariffs are just a different type of big government imposing its will on the market. This is as heavy-handed as the Democrats get, only in a different way. It makes for a lot of uncertainty.”

Abel nodded. “Exactly. You know, AOC and Bernie Sanders have been going around the country to build opposition to Trump. They actually got over 30,000 people in Denver a week or so ago. I was thinking that there is a constituency in the Democratic Party that is like MAFA, Make America Fair Again.”

Cain interrupted, “I like that, but what do you mean ‘again.’ Has America ever been fair?”

Abel replied, “Well, some Democrats look back to the post-war period as an example of more fairness. Sure, there was a lot of prejudice. Jim Crow laws in the south, for example. But union membership was strong, wages grew faster than inflation and taxes were like 70% on the top 1%. Kind of a ‘Father Knows Best’ or ‘Leave It To Beaver’ moment. What’s weird about that is that the MAGA crowd on the right also looks back to that time as an ideal as well. The U.S. was the leading manufacturing country in the world and the supply chain helped support businesses in small and medium sized towns. There were good paying jobs and people could afford to buy a home. So, the MAGA crowd on the right and the MAFA crowd on the left are looking to the same post-war period as their ‘Golden Age.’”

Cain replied, “I like that idea. What’s ‘great?’ What’s ‘fair?’ It can be anything. They are promotional, not substantive words. What’s fair to me might not be fair to you. Let’s say you and I pick apples for a living. We both have the same size ladder, but I get assigned a section of trees where the apples are easier to reach than the trees in your section. I think it’s fair because we both have the same tool, the same length ladder. You don’t think it’s fair because picking apples is more of a challenge for you than it is for me. When we are done, I think I am more productive than you and I deserve the extra money I made. You feel cheated. I think you are just lazy. If you don’t know that my apples were easier to pick, you might become convinced that there is something wrong with you. Some character flaw. You might start believing that you are lazy or dumb or something.”

Abel said, “I remember seeing a cartoon about that once. It was trying to show the difference between equality and equity. Two people might have equal means, but not equal opportunity because one person’s environment is more advantageous. They are more likely to succeed.”

Cain frowned. “Fixing that problem only makes the problem worse. That’s what’s wrong with liberal politicians. They focus on outcomes and reason backwards. If outcomes are not equal, then the environment must be different, so they change some aspect of the environment. Outcomes are still unequal. Why? Because people anticipate policy changes. People are not machines or rats in a lab. There is a field of economics where researchers introduce policy changes into a community and test the effect. Some women in a rural farming community in India are given ducks. It’s random so the researchers can publish their study. The women will be able to raise the ducks so they can feed their families (Banerjee & Duflo, 2011). A neighbor, jealous because they didn’t get ducks, poisons the ducks. Social scientists can’t conduct experiments on people the way that researchers in the hard sciences can. We are sentient beings, not dumb guinea pigs.”

Abel nodded. “At least researchers are trying to develop some empirical data. It’s better than the approach that Aristotle and other philosophers used. Make up shit based on my perspective and declare it so.”

Cain laughed. “Hey, I’ll grant you it’s not easy. The beauty of the price system is that prices are the result of thousands of experiments testing the value of something. The magic of the price system is that it involves trade-offs, some opportunity cost. I need to give up ‘x’ dollars to get ‘y’ good or service. I could spend my dollars on something else or nothing else and save it. A gigantic set of experiments in opportunity costs. That needs to be a fundamental characteristic of policy design. Often, it isn’t.”

Abel argued, “Yeah, but that bottom-up approach doesn’t work for collective action problems. Spend more money on national defense or health care? Public education or more police? People can’t agree on the value of each and the opportunity costs.”

Cain interrupted, “Agreed, but a top-down approach doesn’t work either.”

 Abel stood up. “So, we are left with irresolvable problems, it seems. Maybe that is something we can talk about next week. Please, God, something other than the latest Trump fiasco.”

Cain waved. “That would be nice. See you next week.”

//////////////////////

Image by ChatGPT in response to the prompt, “draw a blue baseball cap with the words ‘Make America Fair Again’ stenciled in white letters.”

Banerjee, A. V., & Duflo, E. (2011). Poor economics: A radical rethinking of the way to fight global poverty. New York, NY: Public Affairs.

A Home Is More Than a Home

March 31, 2024

by Stephen Stofka

This week’s letter is about housing, the single largest investment many people make. The deed to a home conveys a certain type of ownership of physical property, but the price reflects a share of the surrounding community, its economy, infrastructure, educational and cultural institutions. We purchase a chunk of a neighborhood when we buy a home.

These are network effects that influence demand for housing in an area. They are improvements paid for by tax dollars or business investment that are capitalized into the price of a home. Take two identical homes, put them in different neighborhoods and they will sell for different amounts. When elements of this network change, it affects the price of a home. Examples of negative changes include the closing of businesses or an industry, a decline in the quality of schools, the presence of graffiti or increased truck traffic. Positive changes might include improved parks and green zones, better schools and alternative transportation like bike lanes and convenient public transportation.

Zoning is a critical tool of a city’s strategic vision. Zoning controls the population density of an area, the available parking and the disturbance from commercial activities. Many cities have some kind of long-term plan for that vision. Los Angeles calls it a General Plan. In Denver it is called Blueprint Denver (pdf). Homes built in the post-war period in the middle of the twentieth century were often smaller. They feature a variety of building styles whose distinctive character and lower prices invite gentrification. As properties are improved, their higher appraisal values bring in more property tax revenue from that city district and the process of building an improved neighborhood network begins.

A representative for that district can argue for more spending on public amenities to enhance the neighborhood. This further lifts property values and increases tax revenues. Developers get parcels rezoned so that they can convert a single-family property into a two-family unit. This may involve “scraping” the old structure down to its foundation, then expanding the footprint of the structure to accommodate two families. As this gentrification continues, there is increased demand for rezoning an area to allow the building of accessory dwelling units, or ADUs, on a property with a single-family home. Here is a brief account of a rezoning effort in Denver in 2022.

In the past decade, the 20-city Case-Shiller Home Price Index (FRED Series SPCS20RSA) has almost doubled. The New York Fed has assembled a map with video showing the annual change in the index for the past twenty years. Readers can click on their county and see the most recent annual price change. Millennials in their late twenties and thirties feel as though some cruel prankster has removed the chair just as they started to sit down. Analysts attribute the meteoric rise in prices to lack of housing built during and after the financial crisis fifteen years ago.

Each generation faces a set of crises that stifle their ambitions. In the 1970s, just as the first Boomers were entering their late twenties, mass migration from the eastern U.S. to the western states and high inflation doubled home prices in some areas within just a few years. The decade is a comparison tool as in “How bad is it? Well, it’s not as bad as the ’70s.” The 1980s began with high interest rates, the worst recession since the Great Depression and high unemployment. Boomers had to buy houses with mortgage rates over 10%. Following that recovery was another housing scandal and the savings and loan crisis that restricted any home price growth. A homeowner who bought a home in 1980 might have seen no price appreciation by 1990. Gen-Xers who bought a home during the 2000s had a similar experience, leaving some families underwater or with little equity for a decade. Equity growth from homeownership helps support new business start-ups.

Despite the insufficient supply of affordable housing, there are more homes than households. In the graph below are the number of homes (orange line) and households (blue line) as a percent of the population. The difference is only a few percent and contains some estimate error, but represents many more homes than the number of households.

Graph showing homes and households as a percent of the population.

Household formation, the blue line in the graph above, is a key feature of the housing market. In 1960, 3.4 people lived in each household, according to the Census Bureau (see notes). By 1990, that number had steadily declined to 2.6 persons and is slightly under that today. The supply of homes naturally takes longer to adjust to changes in household formation. That mismatch in demand and supply is reflected in home prices.

During the financial crisis household formation declined as unemployment rose. Home prices fell in response to that change in demand for housing and a come down from the “sugar high” of easy credit and sloppy underwriting. The percent change in the Home Price Index, the red line in the graph below, fell below zero, indicating a decline in home prices, an event many homeowners had never experienced. The fall in home values crippled the finances of local governments who depended on a steady growth in the property taxes based on rising home values.

Graph containing two lines: 1) the percent difference between homes and households as a percent of the population, 2) the home price index. There is a large gap where the two series diverge during the financial crisis.

The thirty-year average of  the annual growth in home prices (FRED Series USSTHPI) is 4.5% and includes all refinancing. We can see in the chart above that the growth in home prices (red line) is near that long-term mark. However, rising wages and low unemployment have encouraged more household formation, the rising blue line in the first chart. Those trends could continue to keep the growth in home prices above their long-term average. Millennials with mortgages at 6-7% are anxiously waiting for lower interest rates, a chance to refinance their mortgages and reduce their monthly payments. Strong economic growth and rising incomes will continue to put upward pressure on consumer prices, slowing any decisions by the Fed to lower interest rates. These trends are self-reinforcing so that they take a decade or more to correct naturally. Too often, the correction comes via a shock of some sort that affects asset prices and incomes. Millennials have endured 9-11, the financial crisis and the pandemic. “Go ahead, slap me one more time,” this generation can say with some sarcasm. The challenge for those in each generation is to try harder and endure.

Next week I will look at the cash flows that a property owner receives from their home investment.

////////////////////

Photo by Scott Webb on Unsplash

Keyword: interest rates, mortgages, mortgage rates, housing, households

Notes on series used in the graphs. The total housing inventory is FRED Series ETOTALUSQ176N divided by Total Population Series POPTHM. Total Households is TTLHHM156N divided by the same population series. These are survey estimates so some of the difference between the two series can be attributed to a normally distributed error. The all-transactions Home Price Index is FRED Series USSTHPI. The FRED website is at https://fred.stlouisfed.org/

The Change Changed

November 13, 2022

by Stephen Stofka

October’s CPI report released this week indicated an annual inflation of 7.7%, down from the previous month. Investors took that as a sign that the economy is responding to higher interest rates. In the hope that the Fed can ease up on future rate increases, the market jumped 5.5% on Thursday. Last week I wrote about the change in the inflation rate. This week I’ll look at periods when the inflation rate of several key items abruptly reverses.

Food and energy purchases are fairly resistant to price changes. Economists at the Bureau of Labor Statistics (BLS) construct a separate “core” CPI index that includes only those spending categories that do respond to changing prices. It is odd that a core price index should exclude two categories, food and energy, that are core items of household budgets.

Ed Bennion and other researchers (2022) at the BLS just published an analysis of inflationary trends over several decades. Below is a chart of the annual change in energy prices. Except for the 1973-74 oil shock, a large change in energy prices led to a recession which caused a big negative change in energy prices.

We spend less of our income on food than we did decades ago so higher food prices have a more gradual effect, squeezing budgets tight. Lower income families really feel the bite because they spend a higher proportion of their income on food. In the graph below a series of high food price inflation often precedes a recession. Unlike energy prices, there is rarely a fall in food prices. Following the 2008 financial crisis, food prices fell ½% in 2009. It is an indication of the economic shock of that time.

Let me put up a chart of the headline CPI (blue line) that includes food and energy and the core inflation index (red line) which does not. Just once in 75 years, during the high inflation of the 1970s, the two indexes closely matched each other. Following the 1982-83 recession, the core CPI has outrun the headline CPI.

A big component of both measures of inflation is housing. The Federal Reserve (2022) publishes a series of home listing prices calculated per square foot using Realtor.com data. You can click on the name of a city and see its graph of square foot prices for the past year. You can select several cities, then click the “Add to Graph” button below the page title and FRED will load the graph for you. Here’s a comparison of Denver and Portland. They have similar costs.

The pandemic touched off a sharp rise in house prices in both cities. Denver residents have attributed the big change to an influx of people from other areas. However, Census Bureau data shows that the Denver metro area lost a few thousand people from July 2020 to July 2021 (Denver Gazette, 2022). In the decade after the financial crisis, there simply wasn’t enough housing built for the adults that were already here.

The surge in home buying has not been in population but in demographics. As people approach the age of 30, they become more interested in and capable of buying a home. The pandemic helped boost home buying because interest rates plunged from 5% in 2018 to 2.6% in 2021.

Record low interest rates enabled Millennials in their 20s and 30s to buy a lot more home with their mortgage payment. That leverage caused housing prices to rise. A 30-year mortgage of $320K has a monthly mortgage payment of $1349 at 3%. At 5%, it is $1718 and at 7% it rises to $2129. Ouch!

Rising rental costs and home prices drive lower income families to less expensive areas in a metro area or entirely out of an area. Declining public school enrollment has forced two Denver area counties to announce the closing of 26 schools and transfer them to other schools (Seaman, 2022). As the number of students decreases, the schools infrastructure costs do not change, increasing the per student costs. Buses have to be maintained, drivers paid, schools staffed with guards, cafeteria staff, janitors and administrative personnel. Once schools are shuttered, the building may be sold and converted to other uses, either residential or commercial. The public schooling system is like a large ship that takes some time to change course.

During our lifetimes we experience many changes. They can happen quickly or emerge over time. The effects may be short lived or last decades. Families are still living with the consequences of the financial crisis fourteen years ago. Carelessly planned urban development isolates the residents of a community. The social and economic effects can last several generations. As we grow older, we learn to appreciate William Faulkner’s line, “The past is never dead. It’s not even past.”

/////////////////////

Photo by Davies Designs Studio on Unsplash

Bennion, E., Bergqvist, T., Camp, K. M., Kowal, J., & Mead, D. (2022, October). Why inflation matters. U.S. Bureau of Labor Statistics. Retrieved November 11, 2022, from https://www.bls.gov/opub/btn/volume-11/exploring-price-increases-in-2021-and-previous-periods-of-inflation.htm

Denver Gazette. (2022, March 25). Denver joins big city trend with pandemic population slip. Denver Gazette. Retrieved November 11, 2022, from https://denvergazette.com/news/local/denver-joins-big-city-trend-with-pandemic-population-slip/article_65c6393d-2a4d-5b91-837c-f8c3efce3778.html

Federal Reserve. (2022). Median listing price per square feet:Metropolitan Areas. FRED. Retrieved November 11, 2022, from https://fred.stlouisfed.org/release/tables?eid=1138280&rid=462

Seaman, J. (2022, November 10). Schools targeted for closure in Denver, Jeffco have disproportionately high numbers of students of color, data shows. The Denver Post. Retrieved November 11, 2022, from https://www.denverpost.com/2022/11/10/dps-jeffco-school-closures-students-of-color/

////////////////////

The Big Picture

May 19, 2018

by Steve Stofka

Here is a simple and elegant animation model of the economy in a thirty-minute video from Bridgewater Associates, the world’s largest hedge fund. The video illustrates the spending – income – credit cycle in easy to understand terms. The video includes an insight first noted eighty years ago by the economist John Maynard Keynes, who pointed out that one person’s spending is another person’s income. Sounds obvious, doesn’t it?  I spend money on a pizza which increases the income of the pizza store.

When Keynes explored this simple idea, he revealed a glitch in the traditional model of savings and investment. In a simplified version, money not spent is saved in a bank. The bank loans out those savings to a business.  A business invests that loan into production for future spending. When economists model the whole economy, Savings = Investment. It is an accounting identity like a mathematical definition. The financial industry transforms one into the other.

During the Depression, something was obviously broken, and economists debated various aspects of their models. Keynes asked a question: what happens to the merchant where the money was not spent? Let’s say the Jones family decides not to buy a new TV and puts the money in a savings account at the Acme Bank.  The local Bigg TV store sells one less TV and has a corresponding decline in its income. Because Bigg had less income, they must withdraw money from their Acme Bank savings account to meet payroll. The money that the family saves is withdrawn by the business. The money Saved never makes it to the Investment side of the equation.  There is no increase in investment.

Most of the time, those who are saving and those who are spending funds from saving balances out. But there were times, Keynes proposed, when everyone is saving. Keynes attributed the phenomenon to “animal spirits.” As incomes fall, people start using up their savings to make up for the lost income.

During a crisis like this, Keynes proposed that government increase its spending, even if it needed to borrow, to boost incomes and break the vicious cycle. When the crisis was over, the government could raise taxes to pay back the money it borrowed. In Keynes’ model, government spending acted as a balancing force to the animal spirits of the capitalist economy. In the real world, politicians win votes by spending money but find that raising taxes does not win them favor with voters. Without legislative debt controls, government borrowing to counterbalance declines in income only produces greater government debt.

Turning from government debt to personal debt, the average credit card rate has risen to 15.3%, an eighteen year record. As an economy continues to expand and credit is extended to those with marginal creditworthiness, the default rate grows. The percent of credit card balances that have been charged off in default has risen from 1.5% several years ago to 3.6% in the 4th quarter of 2017.

Mortgage rates have risen to about 4.9% on thirty-year loans, and about a half percent less on fifteen-year loans. That half percent difference is close to the average for the past twenty-five years and adds up to an extra $1.60 in interest paid during the life of the loan on every $100 of mortgage principal. The graph below shows the difference between the two rates.

MortRatesDiff

Because shorter-term mortgages require higher monthly payments, they are more feasible for those with stable financial situations and above average incomes. When the difference in rates is less than average, there is a smaller advantage to getting a short-term mortgage.  At such times, the mortgage industry is reaching out to expand home ownership to lower income homeowners. When the difference is more than average, as it has been since the recession, the finance industry is cautious and not actively reaching out to lower income families.

Mortgages are secured by a physical asset, the house. U.S. Treasury bonds are secured by an intangible asset, the full faith and credit of the country. Just like us, the Treasury usually pays a higher interest rate for a longer-term loan.

A benchmark is the difference between a 10-year Treasury bond and a 2-year bond. As this difference declines toward zero, economists call it a “flattening of the yield curve.” At zero, there is no reward for loaning the government money for a longer term. Knowing only that, a casual investor would sense that something is wrong, and they are right. Periods when this difference falls below zero usually occur about a year before a recession starts. In the graph below, I’ve shaded in pink those negative periods. In gray are the ensuing recessions.

10YRLess2Yr

Before that negative pink period comes another phenomenon. Above was the 10 year – 2 year difference in interest rates. Let’s call that the medium difference. There’s also the difference between two long term periods, the 20-year minus 10-year difference. I’ll call that the long difference. When we subtract the medium difference from the long, we get a difference in long term outlook. In a healthy economy, that difference should be positive, meaning that investors are being paid for taking risks over a longer period. When that difference turns negative, it shows that there are underlying distortions in the risks and rewards of loaning money. That distortion will show first before the flattening of the yield curve.

DiffRates1995-2018

As you can see, the difference today is positive, a welcome sign that a recession is not likely within the year.

//////////////////////////

Tidbits

The actuaries for Social Security and Medicare use an assumption that our average life expectancy will increase .77% per year (Reuters article)  If you are expected to live till 85 this year, then that expectation will grow to 85 years and eight months next year. That’s a nice birthday present!

U.S. lumber mills can supply only two-thirds of the lumber needed by homebuilders. The other third comes from Canada. Recent import tariffs now add about $6300 to the price of a new home (Albuquerque Journal).

Financial Obligations

February 22, 2015

Consumer Debt

On the one hand, the economy continues to grow steadily and moderately.  Sales of cars and light trucks are strong.

Housing Starts of new homes are slow.  While homebuilders remain confident, there is a noticeable decrease in traffic from first time home buyers.

The debt levels of American households have not reached the nosebleed levels of 2007 before the onset of the financial crisis.  However, they are more than a third higher than 2005 debt levels.

Historically low interest rates have enabled families to leverage their monthly payments into higher debt.  As a percent of disposable income, monthly morgage, credit card and loan payments are the lowest they have ever been since the Federal Reserve started tracking this in 1980. As long as the labor market grows at a moderate pace and interest rates remain low, families are unlikely to default on these higher debt loads.

In addition to household debt, the Federal Reserve includes other obligations – auto leases, rent payments, property taxes and insurance – to arrive at a total Financial Obligations Ratio (FOR), currently about 15%. (Explanation here)  The highest recorded FOR was 18% in 2007. The amount of income devoted to servicing the total of these obligations – 15.28% –  is near historic lows.  (Historical table ) In the past, when this rato has climbed above 17% there has been a recession, a stock market crash, or both.

So there are three components of a family’s monthly obligations: mortgage payments – currently less than 5%; credit card and loans, currently 5.25%; and other obligations, also about 5.25%.  Should interest rates rise in the next two years, credit card and loan payments will rise above the current 5.25% but are unlikely to cause a crisis in household finances.  The percentage of home mortgages which are adjustable have been rising in the past few years but the growing number of these mortgages have been so-called jumbo loans to households with larger incomes. (Daily News  and Wall St. Journal ).  Rising rates will put increasing pressure on homeowners with these types of mortgages but are unlikely to generate a crisis similar to 2008.

**********************

Currency Market

When someone says the dollar is strong, what does that mean?  Investopedia has a fairly concise explanation of the foreign exchange market (Forex) and the history of attempts to structure this market, the largest in the world.

**********************

Medicare Spending

Costs for Medicare and private insurance have grown at annual rates more than double inflation since 1969, as shown in a 2014 analysis of 35 years of Medicare (CMS) data by the Kaiser Family Foundation.  The only good news is that Medicare annual growth has been 2% less than private plans.

The majority of the benefits go to a small group of patients.  “Medicare spending per beneficiary is highly skewed, with the top 10% of beneficiaries in traditional Medicare accounting for 57% of total Medicare spending in 2009—on a per capita basis, more than five times greater than the average across all beneficiaries in traditional Medicare ($55,763 vs. $9,702).”

In its 2013 annual report (highlights) CMS noted that Medicare spending for the past five years had grown at a relatively tame 4% or less – almost double the inflation rate.  This is what passes for good news in federal programs – spending that is only slightly out of control.  Medicaid costs are growing at 6% per year.  Congress and CMS know that they have got to improve spending controls but the players in the health care industry spend a lot of money in Washington so elected and non-elected officials tread carefully when proposing any reforms.

Last month, Health and Human Services (HHS) announced that, by 2018, they would like to make half of Medicare payments to doctors based on the quality of care they provide, not the number of procedures they do.  Under the ACA, 20% of Medicare payments are based on outcomes, not fee for service.  Although HHS says it has saved $700 million over the past two years, few provider organizations meet the guidelines to share in the savings as originally designed.

When Medicare Advantage programs were introduced in 2003, Congress approved additional subsidies to health care providers to reimburse providers for promoting the new plans.  Like all “temporary” subsidies, no one wants to give them up. Because of the subsidies, the plans are relatively low cost and provide a good benefit for the dollar.  Uwe E. Reinhardt, a Princeton professor writing in the NY Times economics blog, referred to a 2010 report on the cost of the popular Medicare Advantage (MA) program: “In 2009, Medicare spent roughly $14 billion more for the beneficiaries enrolled in MA plans than it would have spent if they had stayed in FFS [Fee For Service, or regular] Medicare. To support the extra spending, Part B premiums were higher for all Medicare beneficiaries (including those in FFS).”

As the population ages, Medicare will consume an ever larger percentage of total health care spending.  CMS noted that Medicare’s portion of health care spending in 2013 has been relatively steady over the past few years. A pie chart from 2009 spending illustrates the cost breakdown.  In 2013, we spent 17.4% of GDP on health care, a figure that has remained stable for a few years.  In 2001, the U.S. spent a shocking (at the time) 13.7% of GDP on health care (CMS Source).

Then and Now

January 25, 2015

Valuation

Blogger Urban Carmel has written a thorough article on current market valuation, focusing on Tobin’s Q as a metric.  This is the market price of equities divided by the replacement cost of the companies themselves.  During the past 65 years, the median ratio is .7, meaning that the market price of all equities is about 70% of the replacement cost.  At the end of December, the Tobin’s Q ratio was more than 1.1.

Are stocks overvalued?  Valuing the replacement cost of a company might have been more accurate when the assets were primarily land, factories and other durable equipment.  Today’s valuations consist of networks, processes, branding, and other less easily measured assets.  The valuation discussion is not new.  In 1996, before the U.S. shed much of its manufacturing capacity, economists and heads of investing firms argued about valuation, including Tobin’s Q.  You can punch the way back button here and read a NY Times article that could have been written today if a few facts were changed.

Currently, households have 20% of their financial assets in stocks, the same percentage as in 1996.  In December 1996, then Federal Reserve chairman made a comment about “irrational exuberance”  in market valuations.  Prices would continue to rise, then soar, before falling from their peaks in mid-2000.  At that peak, households held 30% of their financial assets in stocks.  At an earlier peak, 1968, households had the same high percentage of their assets in stocks.

On an inflation adjusted basis, the SP500 has only recently closed above the all time high set in 2000 (Chart here).  The Wilshire 5000 is a market capitalization index like the SP500 but is broader, including 3700 publicly traded companies in its composite. On an inflation adjusted basis this wider index is 40% above the peaks of 2000 and 2007.

Long term periods of optimistic market sentiment are called secular bull markets. Negative periods are called secular bear markets. (See this Fidelity newsletter on the characteristics of secular bull and bear markets).   These long-term periods are easier to identify in hindsight.  Some say that we are nearing the end of a long-term bear market, and that there willl be a big market drop to close out this bearish period.  There have been so few long term market moves in 150 years of market data, that it is possible to tease out any pattern one wants to find.  The aggregate of investor behavior is not a symphony, a piece of music with defined structure and passages.

******************************

REIT

As Treasury yields decline, mortgage rates continue to fall.  The Mortgage Bankers Association reported  that their refinance application index had increased by 50% from the previous week.  The refinancing process involves the payoff of the previous higher interest mortgage.  Mortgage REITs make their money on the spread, or the difference, between the interest rate they pay for money and the interest on loaning that money on mortgages.  When a lot of homeowners prepay their higher interest mortgages, that lowers the profits of mortgage REITs like American Capital Agency (AGNC) and Annaly Capital Management (NLY).  Both of these companies have dividend yields above 10% and are trading below estimated book value.

*****************************

Housing

Back in ye olden days, around 1950, the world was a bit different.  The Bureau of Labor Statistics published a snapshot of incomes, housing, and other census data, including the data tidbit that people consumed fewer calories in 1950 than today, 3260 then vs. over 3700 today.

Housing and utilities averaged 27% of income in 1950 vs. 40% today.  Food costs were 33% then, 15% today.  The median house price of $9500 was about 3 times the median household income (MHI) of $3200.  For most of the 1990s, the prices of existing homes were slightly higher, about 3.4 times MHI.

The prices of existing homes rose 6% in 2014 – healthy but not bubbly.  However, the ratio of median price to median income is now at 3.8.  Historically low interest rates have enabled buyers to leverage their income to get more house for their bucks, but the lack of income growth will continue to rein in the housing market.

The ratio of median new home prices to MHI has now surpassed the peak of the housing bubble.

*******************************

Retirement Income

Wade Pfau is a CFA who has written many a paper on retirement strategies and occasionally blogs about retirement income.  Here is an excellent paper on the change in psychology, risk assessment and strategies of people before and after retirement.  Wade and his co-author summarize the critical issues, the two dominant withdrawal approaches, the development of the safe withdrawal rate, and the caveats of any long term planning.  The authors review the strategies of several authors, discuss variable spending rules, income buckets and income layering,  annuities, and bond ladders.  You’ll want to curl up in an armchair for this one.

Yield Curve

If you casually listen to financial news, you may hear about a “steepening” or “flattening” yield curve and wondered what the heck that is.  It graphs the difference in yield or interest rate for U.S. Treasury bonds of various maturities.  At the left side of the graph is the yield for Treasury bonds that mature in 3 months.  At the right side of the graph is the yield for 30 year bonds.  In a normal environment with anticipated moderate growth in the years ahead, there will be a difference of about 3% between the short 3 month rate and the long 30 year rate. (Click to enlarge graph in separate tab)

The mutual fund giant, Fidelity, has a brief summary of the different types of curves and what each says about investors’ expectations of future economic conditions.  On the page is an interactive movie of the yield curve for the past 30+ years.

For those of you who have devoted a lot of money to bond funds, you may have noticed the recent 10% drop in the value of any longer term bond funds you have.  From October 2009 to April 2010, long term bonds stayed fairly stable in price.  This summer, as doubts about the recovery emerged, prices for these long term bonds increased rather dramatically – about 16% – as investors became more risk averse and were willing to pay more for long term maturities. Investors were willing to accept lower yields or interest rates on their money.  As interest rates on Treasuries dropped, so too did rates on 30 year fixed mortgages which neared 4% during the summer.  The current downward slope in long term bond prices signals a returning confidence in the economy’s recovery.  We have also seen an increase in 30 year mortage rates to near 5%.

From the Fidelity page cited above, I compared the yield curve now with the curve in mid 2003.  In October 2002, the stock market fell to its low point after the bursting of the internet bubble and the 2001 – 2002 recession.  It see-sawed for several months until the spring of 2003 when it began a steady rise for a year.  The orange line in the graph is today’s yield curve, almost exactly what it was 7-1/2 years ago, suggesting that investors have the same expectations for continuing growth in the economy now as what they did in 2003.