May 19, 2018
by Steve Stofka
Here is a simple and elegant animation model of the economy in a thirty-minute video from Bridgewater Associates, the world’s largest hedge fund. The video illustrates the spending – income – credit cycle in easy to understand terms. The video includes an insight first noted eighty years ago by the economist John Maynard Keynes, who pointed out that one person’s spending is another person’s income. Sounds obvious, doesn’t it? I spend money on a pizza which increases the income of the pizza store.
When Keynes explored this simple idea, he revealed a glitch in the traditional model of savings and investment. In a simplified version, money not spent is saved in a bank. The bank loans out those savings to a business. A business invests that loan into production for future spending. When economists model the whole economy, Savings = Investment. It is an accounting identity like a mathematical definition. The financial industry transforms one into the other.
During the Depression, something was obviously broken, and economists debated various aspects of their models. Keynes asked a question: what happens to the merchant where the money was not spent? Let’s say the Jones family decides not to buy a new TV and puts the money in a savings account at the Acme Bank. The local Bigg TV store sells one less TV and has a corresponding decline in its income. Because Bigg had less income, they must withdraw money from their Acme Bank savings account to meet payroll. The money that the family saves is withdrawn by the business. The money Saved never makes it to the Investment side of the equation. There is no increase in investment.
Most of the time, those who are saving and those who are spending funds from saving balances out. But there were times, Keynes proposed, when everyone is saving. Keynes attributed the phenomenon to “animal spirits.” As incomes fall, people start using up their savings to make up for the lost income.
During a crisis like this, Keynes proposed that government increase its spending, even if it needed to borrow, to boost incomes and break the vicious cycle. When the crisis was over, the government could raise taxes to pay back the money it borrowed. In Keynes’ model, government spending acted as a balancing force to the animal spirits of the capitalist economy. In the real world, politicians win votes by spending money but find that raising taxes does not win them favor with voters. Without legislative debt controls, government borrowing to counterbalance declines in income only produces greater government debt.
Turning from government debt to personal debt, the average credit card rate has risen to 15.3%, an eighteen year record. As an economy continues to expand and credit is extended to those with marginal creditworthiness, the default rate grows. The percent of credit card balances that have been charged off in default has risen from 1.5% several years ago to 3.6% in the 4th quarter of 2017.
Mortgage rates have risen to about 4.9% on thirty-year loans, and about a half percent less on fifteen-year loans. That half percent difference is close to the average for the past twenty-five years and adds up to an extra $1.60 in interest paid during the life of the loan on every $100 of mortgage principal. The graph below shows the difference between the two rates.
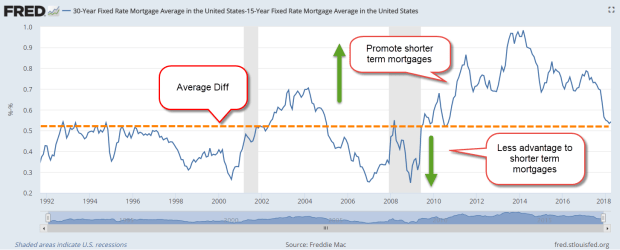
Because shorter-term mortgages require higher monthly payments, they are more feasible for those with stable financial situations and above average incomes. When the difference in rates is less than average, there is a smaller advantage to getting a short-term mortgage. At such times, the mortgage industry is reaching out to expand home ownership to lower income homeowners. When the difference is more than average, as it has been since the recession, the finance industry is cautious and not actively reaching out to lower income families.
Mortgages are secured by a physical asset, the house. U.S. Treasury bonds are secured by an intangible asset, the full faith and credit of the country. Just like us, the Treasury usually pays a higher interest rate for a longer-term loan.
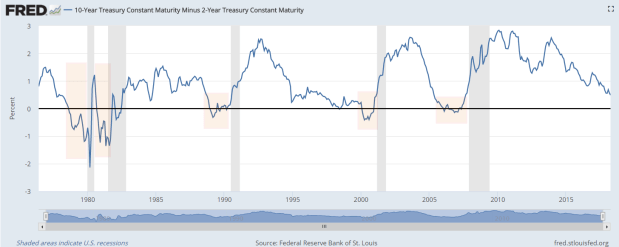
A benchmark is the difference between a 10-year Treasury bond and a 2-year bond. As this difference declines toward zero, economists call it a “flattening of the yield curve.” At zero, there is no reward for loaning the government money for a longer term. Knowing only that, a casual investor would sense that something is wrong, and they are right. Periods when this difference falls below zero usually occur about a year before a recession starts. In the graph below, I’ve shaded in pink those negative periods. In gray are the ensuing recessions.
Before that negative pink period comes another phenomenon. Above was the 10 year – 2 year difference in interest rates. Let’s call that the medium difference. There’s also the difference between two long term periods, the 20-year minus 10-year difference. I’ll call that the long difference. When we subtract the medium difference from the long, we get a difference in long term outlook. In a healthy economy, that difference should be positive, meaning that investors are being paid for taking risks over a longer period. When that difference turns negative, it shows that there are underlying distortions in the risks and rewards of loaning money. That distortion will show first before the flattening of the yield curve.
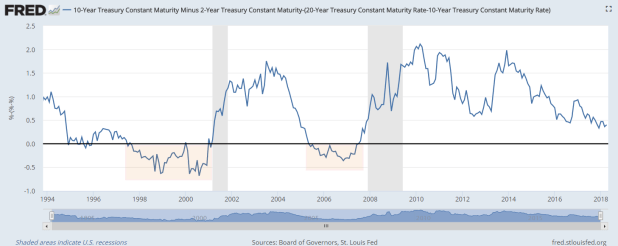
As you can see, the difference today is positive, a welcome sign that a recession is not likely within the year.
//////////////////////////
Tidbits
The actuaries for Social Security and Medicare use an assumption that our average life expectancy will increase .77% per year (Reuters article) If you are expected to live till 85 this year, then that expectation will grow to 85 years and eight months next year. That’s a nice birthday present!
U.S. lumber mills can supply only two-thirds of the lumber needed by homebuilders. The other third comes from Canada. Recent import tariffs now add about $6300 to the price of a new home (Albuquerque Journal).
