May 7, 2017
Later in this article I’ll take a long term look at connector jobs and how they can help us understand the swings in the economy as a whole. Last week I mentioned that I might figure and graph a 20 year CAPE ratio for the past few decades. I will post that up next week. First let’s look at the whole economy.
The initial estimate of first quarter GDP was released this week. Another quarter of meager growth. Here’s a chart of real, or inflation-adjusted, GDP growth per capita. During this recovery there has been only one quarter when annual growth has crossed the healthy benchmark of 2.5%.

A working paper by economists at the NBER estimates a 2.1% growth rate in OECD countries (which includes the U.S.) for the next few decades. An aging population is the major contributor to the the 25% decline from the 2.8% growth of the post-WW2 era. Promised benefits to those in OECD countries will stretch national budgets in a lower growth environment.
The Trump administration has one mandate – stronger growth – and will be judged by how well it can maintain its focus on that goal. This current second quarter of a new administration is the first one that voters count. Voters and investors will be keenly watching to see if Republicans have anything of substance behind the campaign rhetoric.
///////////////////////
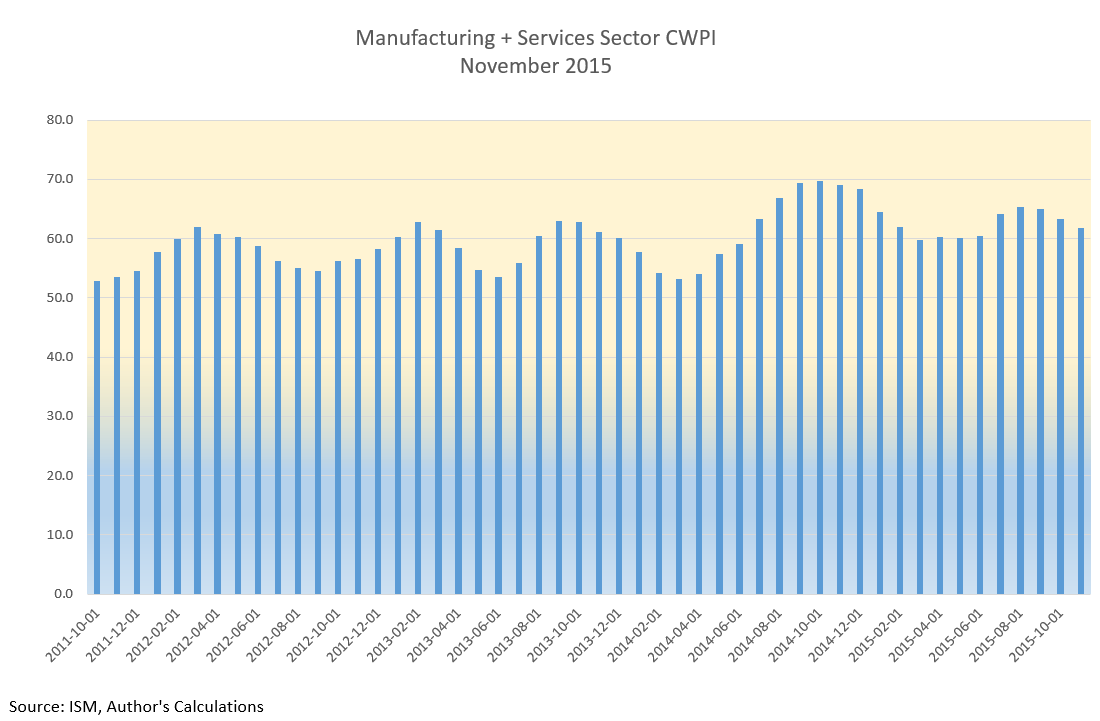
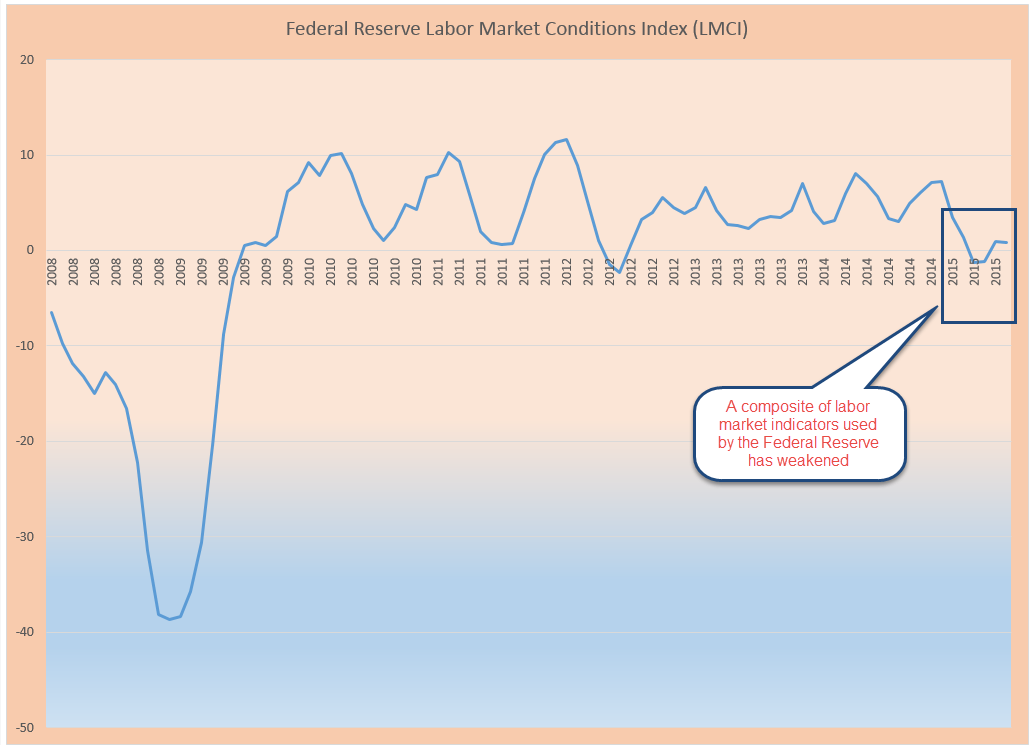
Labor Report
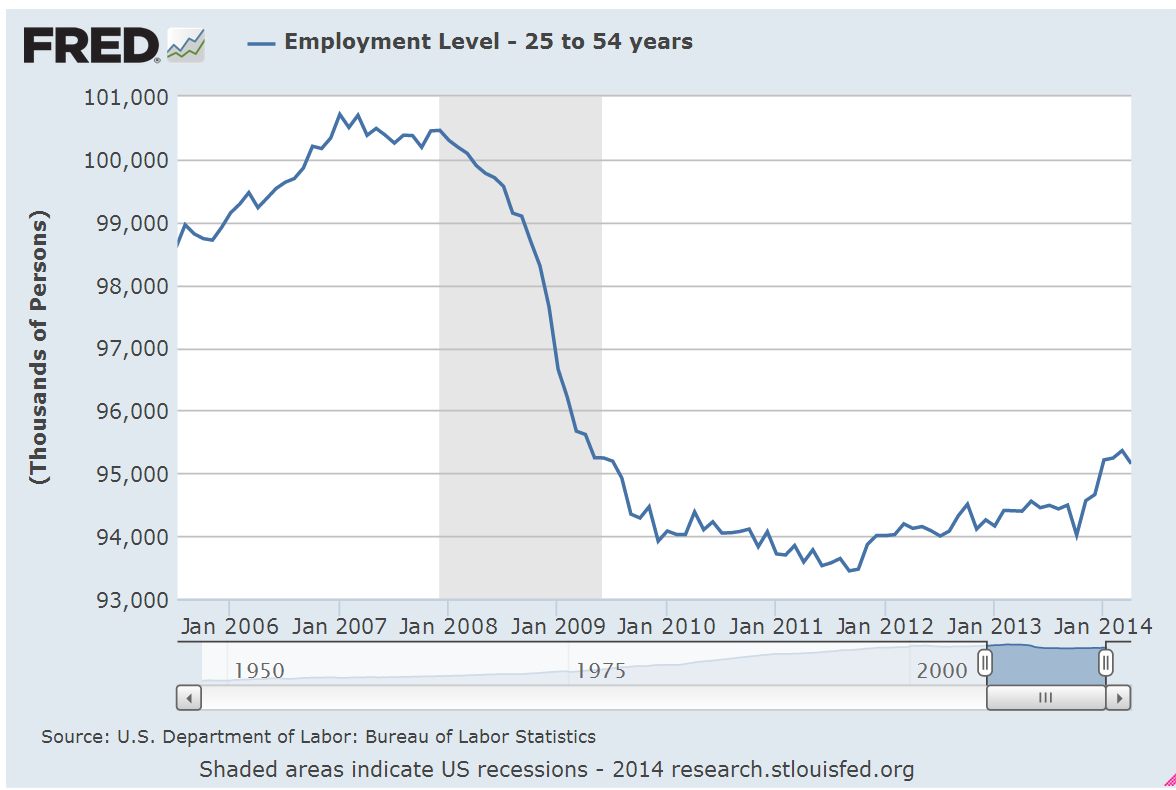
In contrast to the slow GDP growth comes the news that payroll growth is strong. The average of the BLS (includes government jobs) estimate and the ADP (private only jobs) was a 203,000 gain in April.
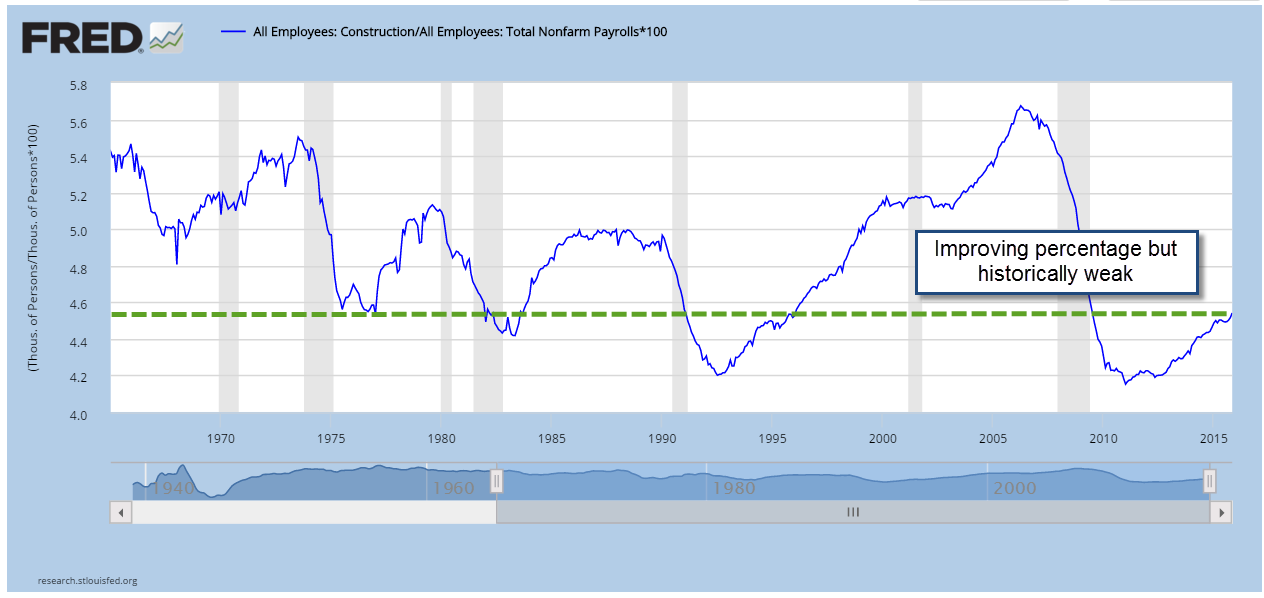
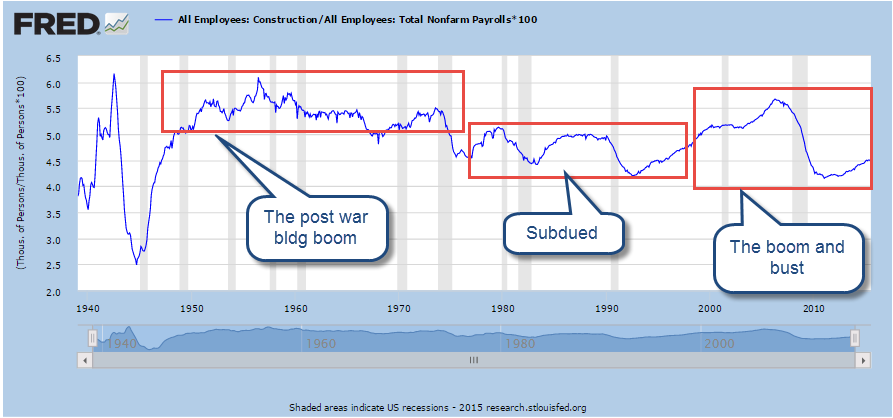
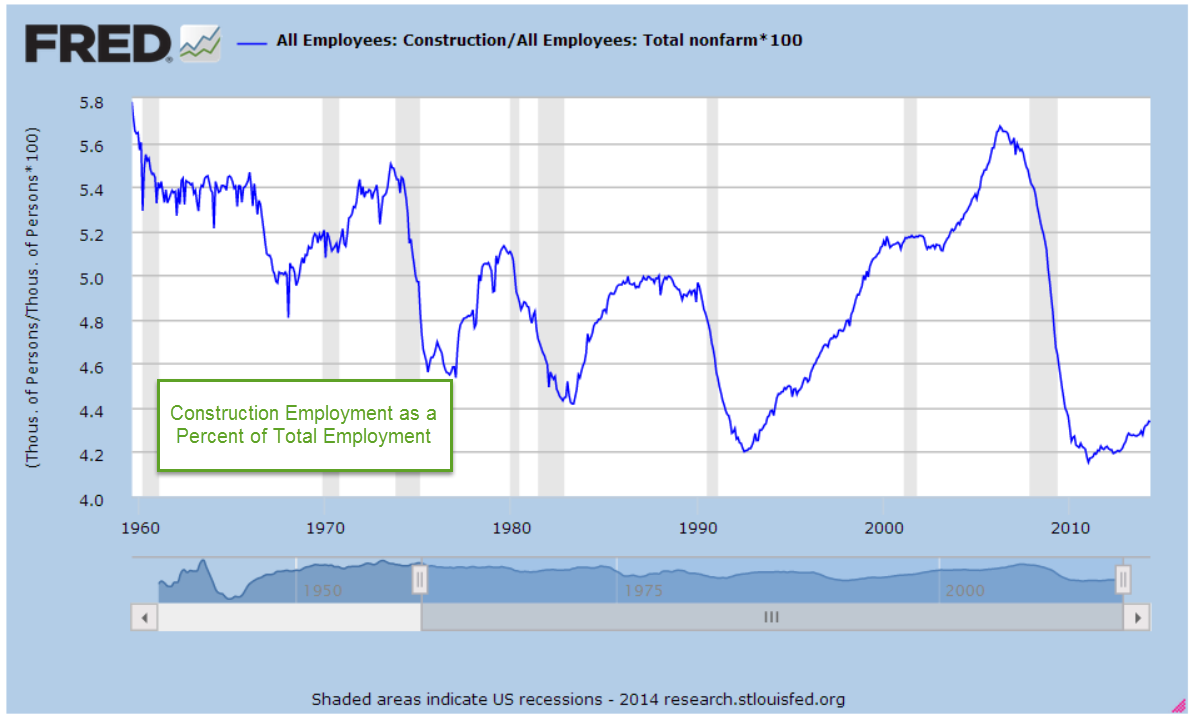
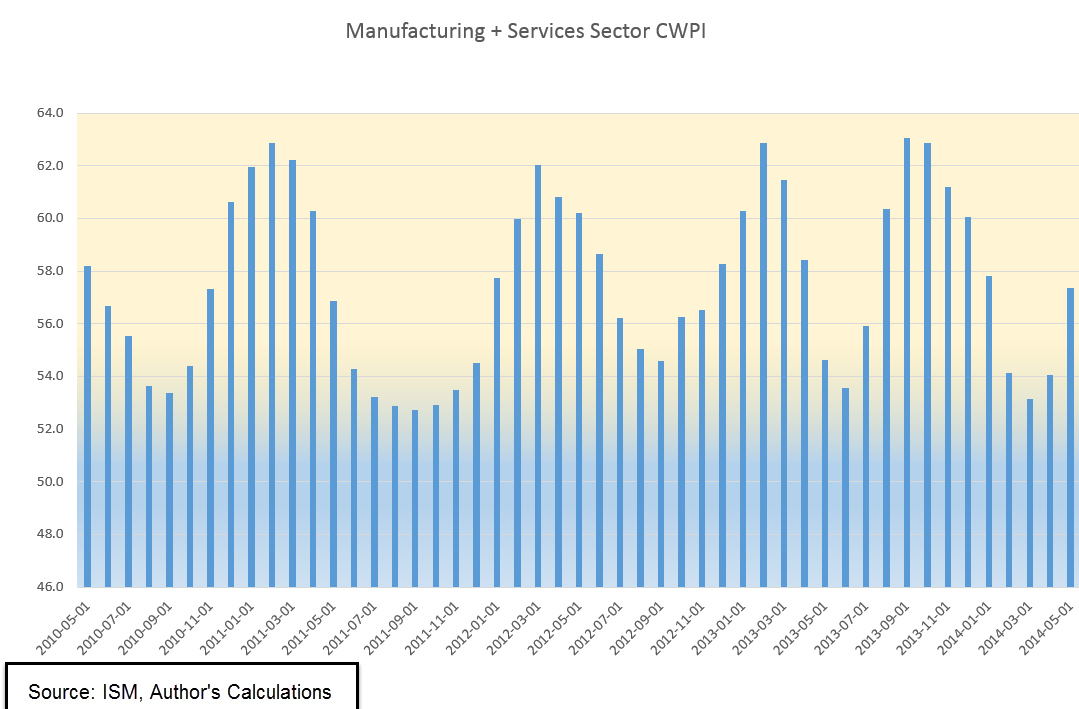
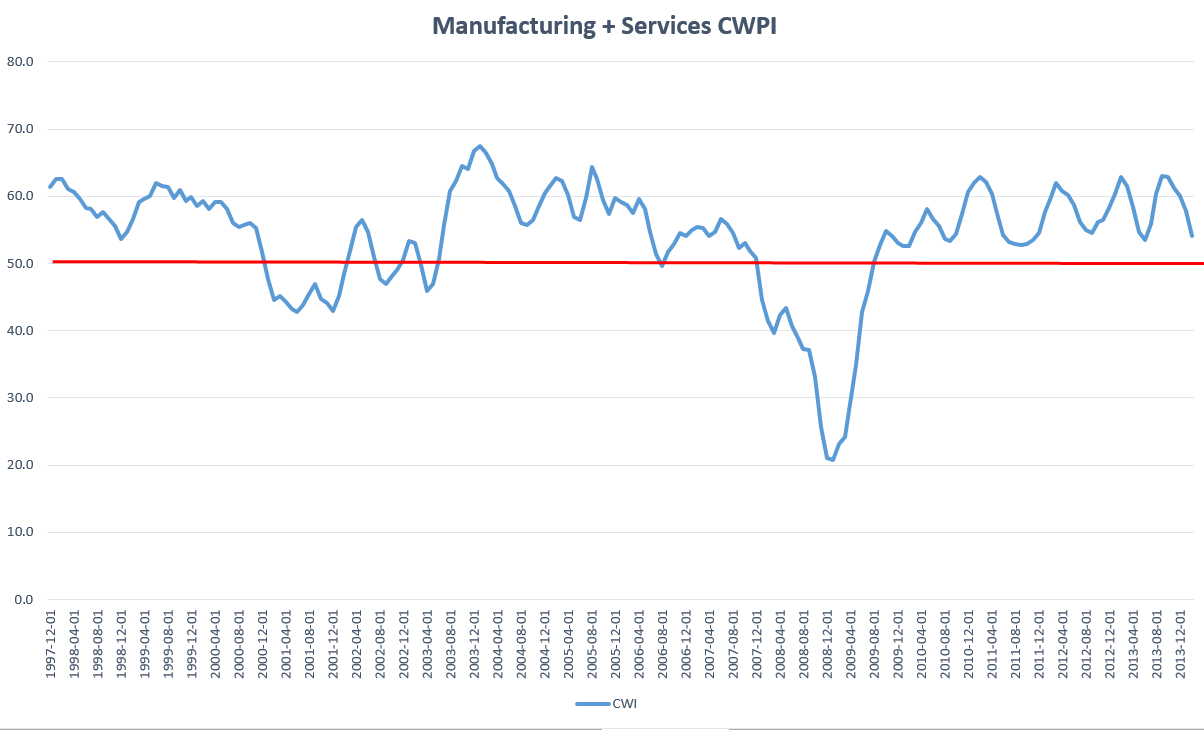
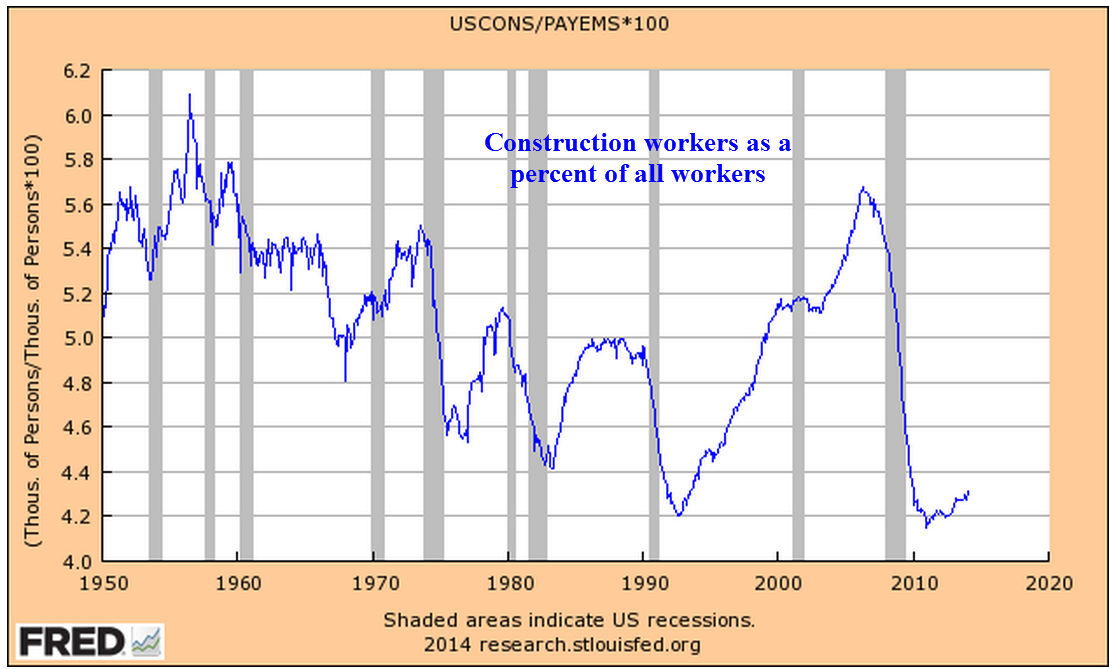
Here’s an indicator that has proved to be reliable for six decades. As long as the growth in construction jobs is greater than the percentage growth of all jobs, the economy is healthy. An investor who reduced their equity holdings when construction job growth declined faster than overall employment (blue line crossing below declining red line) and overweighted equities when construction job growth was faster (blue line crosses above rising red line) would have done quite well.

This might seem like a puzzle to those who do not work in real estate or construction. How does such a small part of the economy – less than 5% – provide such a key indication of the health of an economy? Because construction jobs are connector jobs. Remember Tinker Toys? Construction jobs are the round hubs with the holes in them.
They connect working people who are buying and renting homes.
They connect businesses leasing offices and stores.
They connect politicians and taxpayers to build and repair infrastructure.
They connect investment money and businesses wanting to expand.
When construction jobs decline, we can guess that new home sales are weakening, that demand for office and retail space is slackening, that tax collections are diminishing and government budgets tightening. Factory, retail and office building construction decline as caution plays a stronger hand among institutional investors.
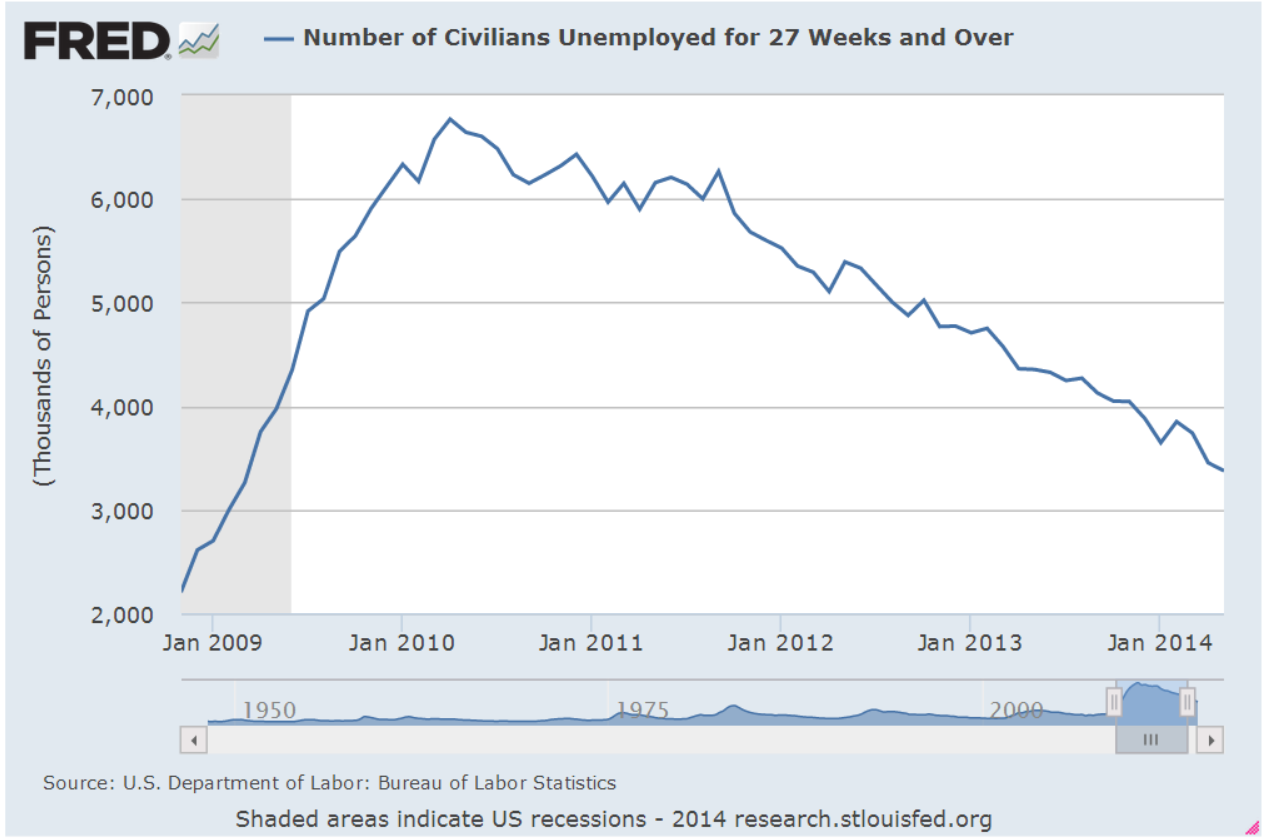
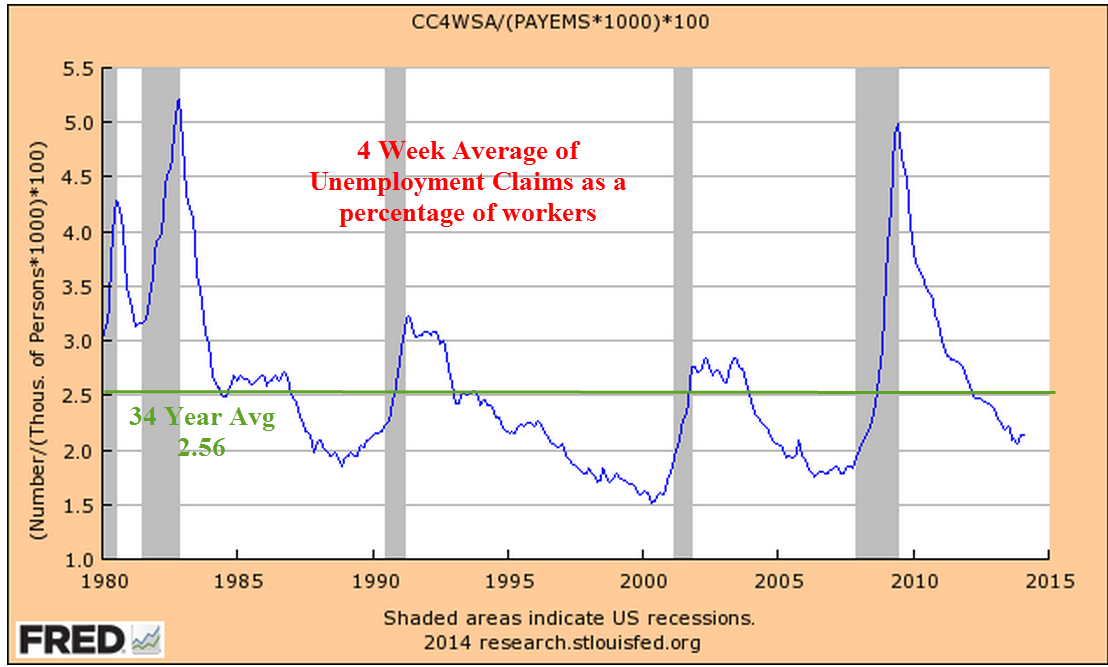
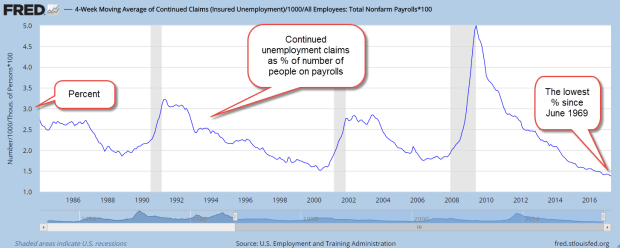
New unemployment claims remain at historic lows. Continuing claims for unemployment insurance have not been this low since June 1969.
The number of people voluntarily qutting their jobs for another job (the quit rate) is near the highs seen in 2005 through 2007.
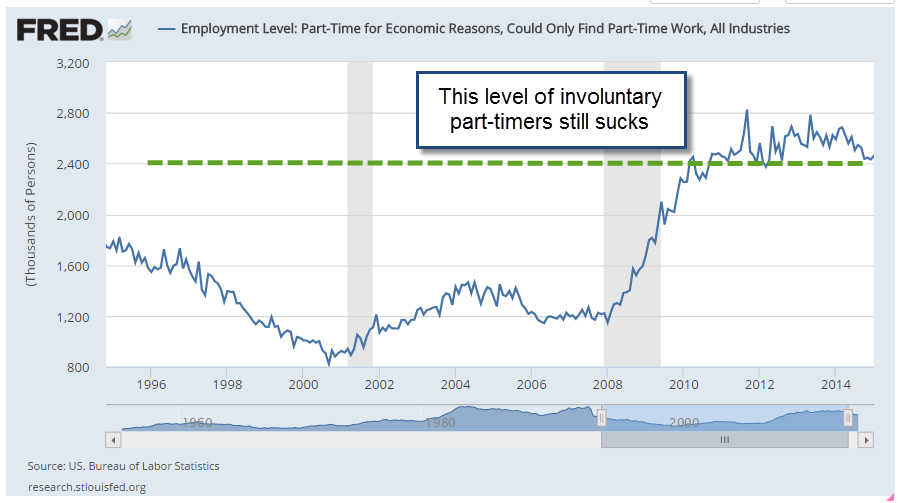
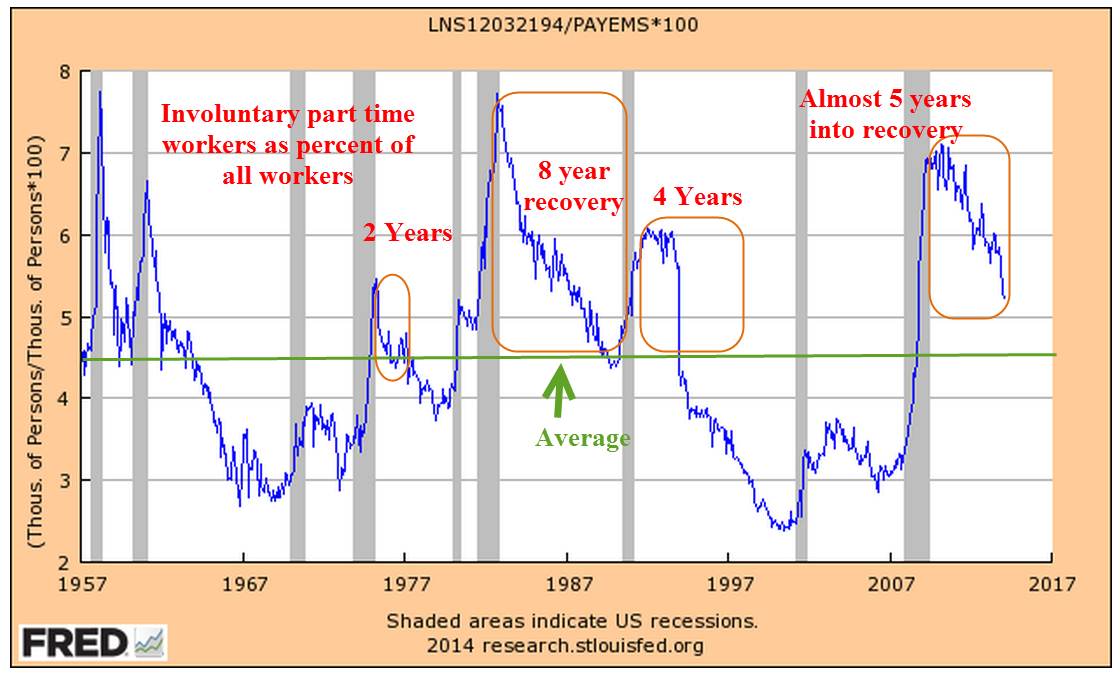
People working part time jobs because they can not find full time work have declined since their peak in September 2011 but are still high. Many employers in retail and restaurants use part time employees to meet daily peaks and ebbs in the customer flow. Benefit costs for part time employees are less than full time. Even in a booming economy like Denver, people in their 20s with a college or two year degree may have to put together two or more part time jobs to make ends meet.
Throughout most of this recovery the weekly earnings of non-government employees has struggled to grow at more than a 2.5% annual pace, far below the plus 4% growth of the middle of the 2000s. On an even more sobering note: the median real weekly earnings of full time black workers is 20% less than all full time workers.
For decades to come, both the financial crisis and the recovery will be studied and written about. Scholars will try to understand the trend to part time jobs and the slackening wage growth. The total cost of an employee includes benefit costs and mandated payroll taxes. As medical insurance premiums continue to rise faster than inflation, the total cost of an employee has increased faster than inflation. Employers have compensated by reducing the growth of the wage component of total cost. Secondly, they have reduced benefit costs by employing more part timers where possible.
Trump was elected on the campaign promise that this so-so rate of growth would not be the “New Normal” under his administration. Walking that talk may be much harder than he thought, or that anyone thought.
///////////////////////////
Today I heard some one say, “I’m afraid that if I don’t buy a house soon, I will be priced out of the market.” When have I heard that before? It was 2006, at the height of the housing boom.