The Role of Government

March 3, 2024

by Stephen Stofka

This week’s letter is about the federal government, its expenses and the role it plays in our lives. As originally designed in 1787, the federal government was to act as an arbiter between the states and provide for the common defense against both Indians and the colonial powers of England, France and Spain. James Madison and others considered a Bill of Rights unnecessary since the powers of Congress were clearly set forth in Article 1, Section 8 of the Constitution. However, they agreed to attach those first ten amendments to the ratification of the Constitution to soften objections to a more powerful central government (Klarman, 2016, p. 594). After the Civil War, the federal government was given a more expanded role to protect citizens from the authoritarianism of the states. The authority to do so came from the amendments, particularly the recently ratified 13th, 14th and 15th additions to the Constitution (Epstein, 2014, p. 15).

After the Civil War, the Congress awarded pensions to Union soldiers, their widows, children and dependent parents. In 2008, there were still three Civil War dependents receiving pensions! (link below). This program indebted future generations for the sacrifices of a past generation. Aging soldiers sometimes married young women who would help take care of them in return for a lifetime pension until they remarried. The provision of revenues for these pensions provoked debate in Congress. In the decades after the Civil War, the federal government’s primary source of revenue was customs duties on manufactured goods and excise taxes on products like whiskey. Farmers and advocates for working families complained that this tax burden fell heaviest on them, according to an account at the National Archives. There were several attempts to enact an income tax, but these efforts ran afoul of the taxing provision in the Constitution and courts ruled them invalid. Fed up with progressive efforts to attach an income tax to legislation, conservatives in Congress proposed a 16th amendment to the Constitution, betting that the amendment would not win ratification by three-quarters of the states. Surprisingly, the amendment passed the ratification hurdle in 1913. In its initial implementation, the burden of the tax fell to the top 1% so many disregarded the danger of extending federal power. Filling out our income tax forms is a reminder that our daily lives are impacted by events 150 years in the past.

In the decade after the stock market crash of 1929, the government extended its reach across the generations. Under the Franklin D. Roosevelt (FDR) administration, the newly enacted Social Security program bound successive generations into a “pay-go” compact where those of working age paid taxes to support the pensions of older Americans. The government assumed a larger role in the economy to correct the imbalance of a free-market system which could not find a satisfying equilibrium. This expanded role of government and the writing of John Maynard Keynes (1936) helped spawn a new branch of economics called macroeconomics. This new discipline studied the economy as a whole and a new bureaucracy was born to measure national output and income.

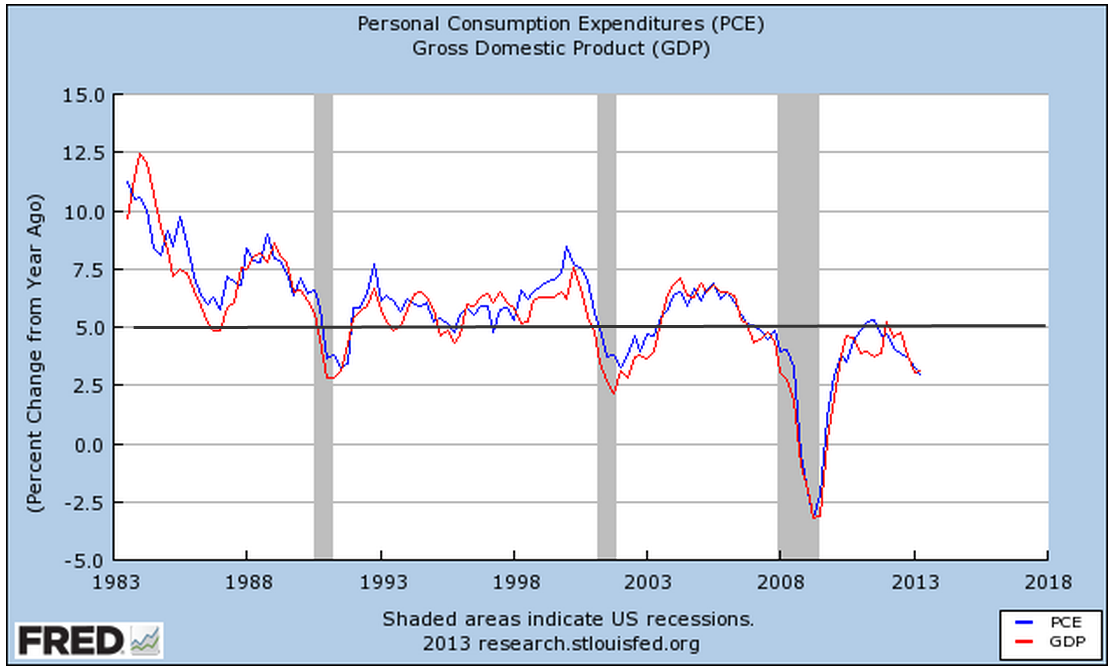
Students in macroeconomics learn that the four components of output, or GDP, are Consumption, Investment, Government Spending and Net Exports. In its simplest definitional form, GDP = C+I+G+NX. In the American economy each of these four components has a fixed portion of output. Net exports (FRED Series NETEXP) are a small share of the economy and are negative, meaning that America imports more goods and services than it exports. The largest share is consumption (PCE), averaging 67% over the past thirty years. Government spending and investment (GCE) and private investment (GPDI) have averaged an 18% share during that time. Because these two components have an equal share of the economy, more government spending and taxes will come at the expense of private investment. This helps explain the intense debates in Congress over federal spending and taxes. Federal investment includes the building of government facilities, military hardware, and scientific R&D. I have included a link to these series in the notes.

The Social Security program is as controversial as the pensions to Civil War veterans and their survivors. The long-term obligations of the Social Security program are underfunded so that the program cannot fully meet the promises made to future generations of seniors. The payments under this program are not counted as government spending because they are counted elsewhere, either in Consumption or Investment. They are treated as transfers because the federal government takes taxes from one taxpayer and gives them to another taxpayer. The taxpayer who pays the tax has less to spend on consumption or saving and the person who receives the tax has more to spend on consumption or saving. However, those transfer payments represent already committed tax revenues.

The chart below shows total transfer payments as a percent of GDP. Even though they are not counted in GDP, it gives a common divisor to measure the impact of those payments. The first boomers born in 1946 were entitled to full retirement benefits in 2012 at age 66. In the graph below those extra payments have raised the total amount of transfers to a new level. After the pandemic related relief transfers, total transfers are returning to this higher level of about 15% of GDP. I have again included government spending and investment on the chart to illustrate the impact that the federal government alone has on our daily lives. In one form or another, government policy at the federal level steers one-third of the money flows into the economy.

For decades, the large Boomer generation contributed more Social Security taxes than were paid out and the excess was put in a trust fund, allowing Congress to borrow from the fund and minimize the bond market distortions of government deficits. Outgoing payments first exceeded incoming taxes in 2021 and Congress has had to “pay back” the money it has borrowed these many years. To some it seems like a silly accounting exercise of the right pants pocket borrowing from the left pocket, but the accounting is true to the spirit of the Social Security program as an insurance program. Paul Fisher, undersecretary of the Treasury, quipped in 2002 that the US government had become “an insurance company with an army” but the quip underscores public expectations. Workers who have been paying Social Security taxes their entire working life expect the government to make good on its promises.

We are mortal beings who create long-lived governments that act as a compact between generations. We argue the terms and scope of that compact. What is the role of government? The founding generation debated the words to include in the Constitution and even after the words were on the page, they could not agree on what those words meant. The current generations are partners in that compact, still debating the meaning of the text of our laws and the role of government in our lives.

///////////////////

[20240303Government.jpg]

Photo by Samuel Schroth on Unsplash

Civil War pensions – a National Archives six page PDF https://www.archives.gov/files/calendar/genealogy-fair/2010/handouts/anatomy-pension-file.pdf

Data: a link to the four data series at FRED https://fred.stlouisfed.org/graph/?g=1hxIK. There is a small statistical discrepancy, and that series is SB0000081Q027SBEA.

Social Security: Notes on the adoption of a 75-year actuarial window used by the trustees of the Social Security funds to assess the ability of the program to meet its obligations. https://www.ssa.gov/history/reports/65council/65report.html. In 2021, the Congressional Research Service published a three-page PDF explainer for the choice of a 75-year term.

Epstein, Richard Allen. (2014). The classical liberal constitution: The uncertain quest for limited government. Harvard University Press.

Keynes, J. M. (1936). The general theory of employment interest and money. Harcourt, Brace & World.

Klarman, M. J. (2016). The Framers’ Coup: The Making of the United States Constitution. Oxford University Press.

Budget Perspective

June 2, 2019

by Steve Stofka

How does your spending compare with others in your age group? Working age readers may compare their budgets with widely published averages that are misleading because they include seniors as well as those who are still living at home with their parents or are going to college. Let’s look at spending patterns classified by working age consumers 25-65 and seniors whose spending patterns change once they retire.

The Bureau of Labor Statistics collects data on consumer behavior by conducting regular surveys of household spending (Note #1). These surveys provide the underlying data for the computation of the CPI, the Consumer Price Index. Social Security checks and some labor contracts are indexed to this measure of inflation.

The BLS also provides an analysis of consumer purchasing by household characteristics, including age, race, education, type of family, and location (Note #2). Spending and income patterns by age contained some surprises (Note #3). The average income of 130,000 people surveyed in 2017 was $73K. Seniors averaged $25K in Social Security income. Younger workers aged 25-34, the mid-to-late Millennials, earned $69K, near the average of all who were surveyed. Following the Great Financial Crisis, this age group – what were then the early Millennials in 2010 – earned only $58K, so the growing economy has lifted incomes for this age group by 20% in seven years.

Home ownership is around 62% for the whole population, but far above that average for older consumers. 78-80% of people 55 and older own their own homes. More than 50% of those have no mortgage but too many seniors do not have enough savings. In many states, property taxes are the chief source of K-12 education funding and older consumers have the fewest children in school. Older consumers on fixed budgets resist higher property taxes to fund local schools and they vote in local elections at much higher rates than younger people. Since 2000, per pupil spending has grown more than 20% but most of that gain came in the 2000s.  In the past twelve years, real per pupil spending has barely increased (Note #4). Below is a chart from the Dept. of Education showing per pupil inflation adjusted spending.

Graph link: https://nces.ed.gov/fastfacts/display.asp?id=66

Saving is an expense and working age consumers aged 25-65 are saving 9-12% of their after-tax income, twice as much as the 5.6% average. Wait – isn’t saving the process of not spending money? How can it be an expense?  Call it the imaginary expense, as fundamental to our life cycle as i, the imaginary square root of -1, is to the mathematics of cyclic phenomena. Let’s compare today’s savings percentage with the panic years of 2009-10 just after the financial crisis. Workers in the 25-34 age group – who should have been spending money on furniture and cars and eating out – were saving 20% of their after-tax income (Note #5). That age group will probably carry the lessons – and caution – learned as they began their working career after the financial crisis.

Workers 25-65 spend 28-32% of their after-tax income on housing. Until they are 65, people spend a consistent 12% of their income on food, both at and away from home. Seniors spend less on food but most of that change is because they spend less money eating out at restaurants. Working age consumers spend more on transportation than they do on food – a consistent 15% of after-tax income.

People 65 and older are entitled to Medicare but they spend more on health insurance than working people and the dollar amount of their spending on health care rises by 50%. As a percent of after-tax income, seniors spend 15% while people of working age spend about 6%. Ouch. I’m sure many seniors are not prepared for those additional expenses.

Those of working age should compare their budget averages to other workers, not to the national averages, which include older people and those under 25. Summing up the major expense categories: workers are averaging 30% for housing, 15% for transportation, 12% for food, 11% for personal insurance, pensions and Social Security contributions, 10% for savings and 6% for healthcare.

As Joey on the hit TV show Friends would often say, “So how you doin’?”

///////////////////

Notes:

  1. Explanation of Consumer Expenditure Survey
  2. Consumption patterns – list Table 1300
  3. The most recent detailed analyses available are for 2017.
  4. Dept of Ed data
  5. Spending and income levels for those aged 25-34 2009-2010.

A Pause On the Road

August 30, 2015

For the past few weeks, the volatility in the stock market has been front and center.  I finished last week’s blog with a note that the market would be conducting a vote of confidence in the coming weeks.  In the opening minutes last Monday morning, the Dow Jones index dropped a 1000 points, almost 6%.  No doubt many investors had spent the weekend worrying and put their sell orders in the night before.  By Friday’s close, however, the SP500 had gained almost 1% for the week.

A few weeks ago the Dow Jones index, composed of just 30 large company stocks, marked a death cross. The death cross is the crossing of the 50 day price average below the 200 day average.  See last week’s blog if you are unfamiliar with this.  This week the broader SP500 index, composed of the largest 500 U.S. companies, marked it’s own death cross.

Two weeks ago, I noted the attitude of one Wall St. Journal reporter to the dreaded death cross. In one word: blarney.  In two words: hocus-pocus.  So why do some investors and the press give this any attention?  Used as a trading system in the broader SP500 the death cross (sell) and it’s companion golden cross (buy) signal have produced a winning trade 4 out of 5 times.  Where do I sign up?, you might be thinking.  In an almost sixty year period of the SP500, however, the extra annual return is slight – about  8/100ths of a percent, or 8 basis points  – over no timing strategy, i.e. buy and hold.  To the average small investor, taxes and other fees more than offset this negligible advantage.

In contrast to any technical stock market price indicators, the fundamentals of the U.S. economy are mostly strong or expanding. Consumer Confidence rose above 100 this past month, surpassing the optimism of the benchmark set in 1985.  The second estimate of GDP growth released this past week was above some of the high estimates.  After inflation, real GDP growth continues at 2.65%.

Corporate profits are growing at 7.3%, home prices are up 5%.  Real, or inflation-adjusted, consumption spending and income is  growing at more than 3%, equaling the heights of pre-recession spending and income growth in early 2007.

Housing prices are increasing for a good reason.  Inventory of homes for sales is relatively low.  In the middle of the 2000s, prices rose even though inventory of homes for sale were going up, a sign of a speculative bubble.  Ah, things look so clear in the rear view mirror.

New jobless claims remain at historically low levels and job growth has been consistently solid.  There are more involuntary part-timers than we would like to see and the participation rate is low.  Gloom and doomers will tend to focus on the relatively few negative points in an otherwise optimistic economic panorama.  Gloom and doomers think that those who disregard  negative signs are Pollyannas.  Eventually, years later, the gloom and doomers are right.  “My timing was off but, see, I was right!” they exclaim. The lesson of the death cross and the golden cross are this: a person can be right most of the time.  The secret to successful investing is knowing when we are wrong and acting on it.

For the individual investor, signals like the death cross can be calls to check our assets and needs.  Older investors may depend on some stability in their portfolio’s equity value for income, selling some equities every quarter to generate some cash.   Financial advisors will often recommend that these investors keep two to five years of income in liquid, low volatility investments.  These include cash, savings accounts, and short to medium term corporate bonds and Treasuries.  Younger investors may see this price correction as an opportunity to put some cash to work.

Sales, Employment, Social Security

March 15th, 2014

Small business

The monthly survey of small businesses showed an abrupt decline in sentiment, below even the lowest of expectations,  and the sixth report since the beginning of the year to come in below the consensus range.  Two factors led the downward change: lowered sales expectations and hiring plans. The majority of business owners surveyed are reducing, not adding to inventory.  The steady but slowly improving sentiment during 2013 has now weakened.

This reading of optimism among small business owners is indexed to 100 in 1986.  The current survey reading of 91.5 is far above the pessimistic level of 80 that the index sank to in the early part of 2009.  In 2006, sentiment broke below the 95 level and has not risen above that since – eight years of below par sentiment among small business owners.

The lackluster small business report early in the week dampened market activity until the release of February’s retail sales report on Thursday.  The retail sales and employment reports that are released each month probably elicit the most response from the market.  A fall in February’s retail sales might have driven the market down at least 1%.  Instead, the report showed an annualized growth rate of 3.6%, offsetting the weakness in January and December.  Excluding auto sales, which accounts for about 20% of retail sales, total sales have formed a plateau.  Even auto sales were up this past month in spite of the extreme bad weather in parts of the country.  Some see this resilience in the face of the extraordinary weather this winter as an indication of an ever strengthening consumer base, a harbinger of solid economic growth.

The reason for the reduction in inventories indicated by the small business survey was revealed by Thursday’s report of the inventory-sales ratio for January.  Inventories rose at a 4.8% annualized rate versus a 7.2% annualized decline in sales.  January’s ratio of inventory to sales is at the same level as the beginning of the recovery in 2009.  Businesses will be cautious buyers this spring until excess inventories are reduced.

****************************
Employment

The number of unemployment claims declined again this week, bringing the four week average down to approximately 330,000, considered by many to be in the healthy range.  As a percent of the workforce, new unemployment claims are near all time lows.  Enacted in 1993, NAFTA had some small effect on employment but the more consequential impact was the admittance of China into the WTO.  As the relatively more volatile manufacturing employment decreased, so too did the surge in unemployment claims.  Note the reduced volatility of the work force today compared to the 1980s.

As a rule, employees quit jobs when they feel confident that another job is readily available.  The Quits rate has been rising since the official end of the recession in the summer of 2009 but is still relatively weak and declined in January.  The current level is at the lows of the recovery from the recession of the early 2000s.

As a percent of the workforce, however, the level of quits has not even reached the lows of that previous recession.

***************************
Income

Now for a disturbing trend: the decline in disposable income below 1% has always marked the start of a recession.  This annual report from the Bureau of Economic Analysis (BEA) covers the period till the end of 2013 and was not affected by the recent cold weather.

Recent price increases in basic food commodities like milk and cereal nibble away at consumers’ pocketbooks.  An ETF that tracks agricultural commodities is up almost 20% in the last six weeks.

Whenever the growth in real, or inflation-adjusted, personal consumption has declined below 2.5%, the economy has always  gone into recession within the year.  In 2013, consumption growth fell to 2.0%.

Well, maybe this time is different.  Eternal hope, persistent denial. Those of us living in the present too often believe that we belong to an elite club with special rules that those in the past did not enjoy.

**************************

Social Security

Several years ago, the Social Security administration (SSA) estimated that 10,000 people would qualify for benefits each day.  Republican Congressman Eric Cantor and Democratic Senator Ron Wyden are two politicians on opposite sides of the political aisle who mention the 10,000 a day factoid.  The actual number of new retirees per day is actually higher.  Using recent data from the SSA, PolitiFact reported that 11,000 new retirees each day qualify for Social Security.  No one mentions the 4,300 who die and drop off the Social Security rolls (2008 data from the Census Bureau).  This number is likely to increase another 15% as the Boomer population swells into old age; the 1.6 million a year who die is likely to grow to 1.8 million who leave the Social Security system while 4 million become eligible for retirement benefits.  The result is an approximate net increase of 2.2 million beneficiaries each year of the next decade.

For now, let’s leave out the growth in the disability and Medicare programs and focus only on retirement and survivor’s benefits, or OASI.

At an average yearly benefit of $14K the benefits paid by the Social Security Administration rise by $31 billion this year, a 4.6% increase on the approximately $670 billion in Social Security and Survivor’s benefits paid out in 2013 (CBO report).  The relatively small deficit of $60 billion last year will grow into hundreds of billions within the decade.  Congress argues at length over $3 billion; efforts at tackling the really big deficits of Social Security are too often met with blowhard rhetoric, not serious negotiation.

The SSA estimates that “By 2033, the number of older Americans will increase from 45.1 million today to 77.4 million.” (SSA Basic Facts) At an inflation rate of 2.5%, less than the 3% average of the past 50 years, the average $14K annual benefit will grow to $23K by 2033.  Multiply that by 77 million people and the total of benefits that will be paid to seniors in 2033 is close to $1.8 trillion, almost triple the benefits paid in 2013.  

The current elderly count of 45 million people is 14% of today’s population of approximately 313 million.  In 2033, 77 million elderly will be 20% of an estimated population of 382 million.  More people getting paid while fewer people will be paying.  The SSA estimates that a little over 40% of the population who are working will be supporting the 20% of the population that is collecting SS benefits.
Independent Senator Bernie Sanders is fond of reassuring us that the Social Security Trust Funds have plenty of money to pay benefits over the next two decades.  What the trust funds have are I.O.U.s from the U.S. Government’s pool of tax revenues.  Where will the money come from?  Increased taxes. 
Politicians rarely lead.  The art of politics is to look like one is a leader, to position oneself at the front of the herd as it flees the pursuing lions.  In this case, the lions are demographics, and decades of promises, unrealistic assumptions and political cowardice.  The question is whether voters will force the leaders to lead before the lions attack.

Up, Down, Round and Round

November 10th, 2013

Friday’s release of the monthly employment situation showed strong net job gains of 204,000 jobs and big upward revisions to the previously reported gains in August and September. The market should have reacted negatively to these positive numbers (yeh, go figure) in anticipation of the Fed tapering their stimulus program of monthly bond purchases.

But first we must go back to Thursday. The first estimate of real GDP growth in the third quarter came in above even the most optimistic forecasts at 2.8%, about a full percentage point above second quarter growth.  The primary reason for the gains though was the continuing build in inventories.  Inventory building is good in anticipation of robust sales but, as I’ll cover later, consumer spending has not been so robust.  The market reacted to the report with it’s largest daily loss in a few months.

On Friday, the employment report was released an hour before the market opened.  Trading began at the same level as Thursday’s close with little response to the strong job gains.  We can imagine that traders were twittering furiously to each other in the opening hour, trying to gauge the sentiment.  Buy in on strength in the employment numbers or sell on the strength in the employment numbers?  After the initial hesitation, the main index gained continuing momemtum throughout the day, with a final spike at the closing bell.

After digesting some of the numbers in the report, I think that traders realized how weak some of its components were, dimming the probability that the Fed will ease up on the gas pedal.  The Consumer Sentiment Survey, released a half hour after the opening bell, showed a continuing decline.  Within minutes, the market started trading higher.

The first number popping in the employment report is the 702,000 people who dropped out of the labor force.  To put that number in perspective, take a look at the chart below which shows the monthly changes in the labor force for the past ten years.  This is the second worst decline after the decline in December 2009, shortly after the official end of the recession.

This month’s .4% steep drop in the Civilian Force Participation Rate ties the record set in December 2009 when the economy was still on its knees.  The rate has now fallen below the 63% mark, far below the 66% rate of several years ago.

Employment in the core work force aged 25 – 54 actually dropped this past month.  Classifications of employment by age, sex, and education come from the survey of households, not employers, and may have been affected somewhat by the goverment shutdown. But the numbers of the past years show that there has been no recovery for this segment of the population.  In each lifetime, there are stages that last approximately twenty years.  This time of life should be  about building careers, building families, building assets and growing income.  I fear that for too many people in this age group, the slowly growing economy has not been kind.  This affects both a person’s current circumstances and dampens prospects for the future.

The headline job gains and classification of the types of jobs come from a separate survey of employers called the Establishment Survey.  Employers report their payroll count as of the 12th of each month.  Because they received paychecks, federal employees furloughed during the government shutdown in the first two weeks of October were still counted as employed in October.

There were some strong positives as well in this report.  Retailers added 44,000 jobs, above the average gains of 31,000.  This year’s gains have been the strongest in fifteen years.

The gains are about half of the eye-popping gains of the past fifty years, but they indicate a confidence among retailers.  Retail jobs are often the first job of many younger workers, who have endured persistently high unemployment during this recession. Here’s a glance at yearly job gains in the retail sector for the past fifty years.

As the holiday shopping season gets underway, all eyes will turn to the retail sector as an indicator of the consumer’s mood.  The U. of Michigan Consumer Sentiment Survey, released Friday, showed a continuation of an erosion in consumer confidence.  After peaking during the early summer at 85, this index has declined to 72, about the same levels as late 2009 when the economy was particularly weak.  The Expectations component of this survey, which reflects confidence in employment and income, has declined to about 63.  Gas prices have been declining, inflation has been near zero, and stock and home prices have been rising but this survey shows a steady decline in confidence.  The government shutdown probably had some effect on the consumer mood but the budget battles are not over.  This is the 7th inning stretch and few are standing up to sing “America The Beautiful.”

Professional Services and Health Care have been consistent leaders in job growth for the past few years but gains in these sectors have declined.  The unemployment rate notched up to 7.3% from 7.2%.

In a catch up effort after the recent government shutdown, the Dept of Commerce released data on factory orders for both August and September.  While the manufacturing sector as a whole has been strong, the weakness in new orders in these two months indicates a tempering of industrial production in the near future.

When adjusted for inflation, the level of new orders is still below the levels of mid-2008.

If we zoom out ten years, we can see that we at about the same levels as late 2005.

ISM released their monthly non-manufacturing survey, showing sustained and rising strong growth at just over 55, up a point for the previous month.  I’ve updated the CWI that I’ve been tracking  since June of this year.  A three year chart shows that even the troughs are part of a sustained growth pattern.  Furthermore, the span of the troughs keeps getting shorter, indicating a structural growth in the economy.

Let’s look back six years and compare this composite index of economic activity with the market.

The monthly report of personal income and spending released Friday showed less than 1% inflation on a year over year basis.  For the second month, incomes increased at an annualized rate of 6%, yet consumer spending remains sluggish.  The chart below shows the year over year growth in spending for the past twenty years.

A longer term graph shows the current fragility in an economy whose primary component is consumer spending.

Both the manufacturing and non-manufacturing portions of the economy continue to expand.  Employment has risen consistently at a level just above population growth.  Inflation is tame but so is consumer spending.  Income is rising.  Budget battles loom.  Expectations for holiday retails sales increases are modest.  Will the Fed ease or not ease?  The medium to long term outlook is positive, but with a watchful eye on any further declines in the momentum of consumer spending growth. The short term outlook is a bit more chaotic.  We can expect further wiggles in the stock market as traders rend their garments, struggling  with Hamlet’s dilemma: To buy or not buy?  To sell or not sell?

Jobs, Spending and Income

October 27th, 2013

Before I take a short look at the delayed release of the employment report this week, let’s look at the growth in personal income and spending, which move in tandem.  This is the y-o-y percent change in nominal after tax income and spending.

Income growth can be a bit more erratic than spending, bouncing around the more stable trend of spending.

The anemic growth in both income and spending has dampened hopes of a strong rebound of consumer spending.  The ratio of an ETF composite of retail stocks versus the overall SP500 market index shows the recent doubt.  Retail stocks have not participated in the larger market rebound.

A wholesale clothing sales rep I spoke with a week ago has noticed the caution in her buyers since mid-August.  In September, some in the industry laid the blame at the prospect of a government showdown.  For those of us in private business, the political shenanigans only muddy the water and make it difficult to read the consumer mood.  Reports of sales at major retail centers – about 10% of retail sales – showed strength this week after a month of lackluster growth.  Maybe it was the government shutdown.

However, the U. of Michigan Consumer Sentiment Index released this past Friday showed a sizeable drop in sentiment.

Was this decline in confidence due primarily to the shutdown or is this a forewarning of less than cheery holiday shopping season?  The knuckleheads in Washington are like people who stand up at a concert, blocking the view of those seated behind them.  The business community in general must plan around the politicians on both sides of the aisle in Washington who relentlessly pursue an anti-job agenda.  Politicians can puff and posture on their principles – like so many in government service, they are not subject to the constraints and discipline of profit and loss.  Sure, there are some whose intentions are good, who give their best effort but, unlike private business, their efforts and intentions are voluntary – a sense of personal virtue.  Most will not lose their jobs because of a lack of performance.  There are few incentives to improve efficiency.  In fact, it is the reverse.  The incentives are to promote more regulations, more layers of bureaucracy, as a program of job security and job growth in Washington at the expense of the rest of the country. Many of us in the private sector have the same sense of personal virtue but we also have that profit and loss whip.

Since the temporary resolution of the government shutdown and the raising of the debt ceiling, the market has shot up over 6% in twelve trading days.  The late release of September’s labor report showed less than expected net job gains of 148,000, which dashed any further fears that the Fed might ease their bond buying program this year.  The trends of employment growth have been fairly stable, with a few exceptions – health care, for one.

After six months of little growth, employment in construction rose by 20,000 this past month.

The rise in construction jobs helped the labor force participation rate for men, reversing a decline.

But the participation rate for the core labor force, those aged 25 – 54, shows no signs of reversing the decline of the past four years.

Demographic changes, combined with persistent job weakness among younger workers, is silently eroding the foundations of the Social Security system.  The older half of the population, particularly the Woodstock generation, are growing faster than the younger population, as this table from the Census Bureau shows.

From the Census Bureau report: “the population aged 65 and over also grew at a faster rate (15.1 percent) than the population under age 45.”  At the end of 2012, the Federal Government owed the Social Security trust fund $2.7 trillion (SSA Source)

The number of workers in the core labor force has declined by 5 – 6 million.

Let’s do some math.  [5 million fewer workers paying into Social Security each year] x [$8000 guesstimated combined annual contribution] = $45 billion per year not  collected.  This is just the Social Security taxes, not including the income taxes, on a portion of the population that represents two thirds of the work force.  That $45 billion represents the benefits paid to over 3 million people in 2012. (SSA Source) To put that figure in perspective, Congress is arguing over the medical device tax clause of Obamacare which is projected to raise just $29 billion over the next ten years.

It will take five to ten years for the crisis of funding to develop.  In the meantime, the budget debates will grow more contentious, politicians will pontificate at their podiums with more frequency and the clouds of these dusty debates will make it more difficult for business people to plan ahead.

Labor and Money Flows

September 1st, 2013

On this Labor Day weekend, I’ll review some things that caught my attention this past week.

The employment picture has shown steady but slow improvement.  The weekly survey of new unemployment claims continues to show downward movement.  In a survey that is about 13 years old, called the JOLTS, the BLS gathers data on Job Openings, Layoffs and Turnovers.  A component of this survey includes the number of employees who have quit their jobs, referred to as the “JOLTS quit rate.” In the aggregate, it indicates a hive intelligence, the estimation of millions of people about the prospects of getting another job.  Decades ago, researchers asked a number of people to estimate the number of jelly beans in a jar.  Each estimate has very small chances of getting close to the actual number, but the average of all estimates was found to be almost exactly the number of jelly beans in the jar.  I don’t know whether this experiment has been replicated but it is interesting.

After recent months of surging new orders for durable goods, July’s report, released Monday, showed signs of caution and a “return to the mean” of a positive upswing this year.

Although this past month’s data was negative, industrial production shows a clear uptrend.

In an analysis released a few months ago, the Federal Reserve examined data from the 2010 triennial (every 3 years) survey of households and estimated that inflation adjusted net worth per household (green line in the graph) has just climbed back to the level it was almost ten years ago.


On the positive side, average net worth is not less than it was ten years ago.  On the negative side for those nearing retirement, it is not more that it was ten years ago.

On Friday, the Personal Consumption and Expenditures (PCE) report showed a 1.4% year over year percent gain, indicating the tepid growth in household spending.  Below I’ve charted the percent gain in PCE vs the percent gain in GDP for the past thirty years.

We are still below the low points of the 1980s, 1990s and early 2000s.  The Federal Reserve is projecting GDP growth of 3 – 3.5% in 2014 but this may be another in a string of rosy forecasts by the Fed, who have repeatedly revised earlier rosy forecasts.  If the Fed were a contractor, it would be out of business due to poor estimating.  A $16 trillion economy is not a kitchen remodel by any means, but it does illustrate how difficult it is for the best minds to make even short term predictions of the economy from the vast amounts of sometimes conflicting data.  Consider then the folly of the Government Accountability Office (GAO), the economic watchdog created by Congress and mandated by Congress to come up with ten year estimates of economic growth and the consequences of existing and proposed legislation.  Those in Congress continue to trot out these fantasy numbers to support or criticize policy and legislation.

Washington continues to vacuum in money and talent from the rest of the country.  Of the richest counties in per capita income in the U.S., the Washington metro area has two of the top three.  The other county in the top three is a stone’s throw from the metro area.  As Washington politicians convince the rest of us that they have the solutions, lobbyists and graduates flock to the concentration of power, jobs, money and influence.
 
Bond yields have increased more than 1% since the spring, meaning that the prices of the bonds themselves have fallen dramatically.  Most of this change has been a reaction to forecasts for stronger growth and a tapering of the Fed’s stimulus program called Quantitative Easing.  Washington is sure to get in the way of stronger growth for the economy as a whole.  Policy out of Washington is designed to promote strong economic growth for Washington.

The market research firm Trim Tabs regularly monitors money flows into and out of the stock and bond markets.  They  reported today that outflows from the stock market in August were half of the record inflows in July.

The blood spilled this year has been in the bond market.  Trim Tabs reports that outflows from bond funds and ETFs have totalled more than $123 billion in the past three months.  Flows into bond funds and ETFs were about $750 billion in 2012, almost a doubling from the $400 billion invested in 2011. (Fed Flow of Funds tables F.120, F.121)

While the prospect of higher rates may have been the trigger that caused a reversal of bond inflows, the underlying current is also an overdue correction of the surge of investment in bonds in 2012.

Households continue to shed debt in one form or another so that total liabilities continue to decline. However, every man, woman and child in this country is carrying, on an inflation adjusted basis, 2-1/2 times the amount of debt they carried thirty years ago.  This level of household liability will continue to put downward pressure on growth.

This next week will kick off with the ISM manufacturing report on Tuesday and finish the week with the monthly employment report.  Year over year percent gains in employment have been steady and guesstimates are for maybe 200,000 net job gains.  150,000 net jobs are needed to keep up with population growth.

The Fed meeting is coming up in mid-September so this employment report will be watched closely to guess the next steps the Fed will take.