September 1st, 2013
On this Labor Day weekend, I’ll review some things that caught my attention this past week.
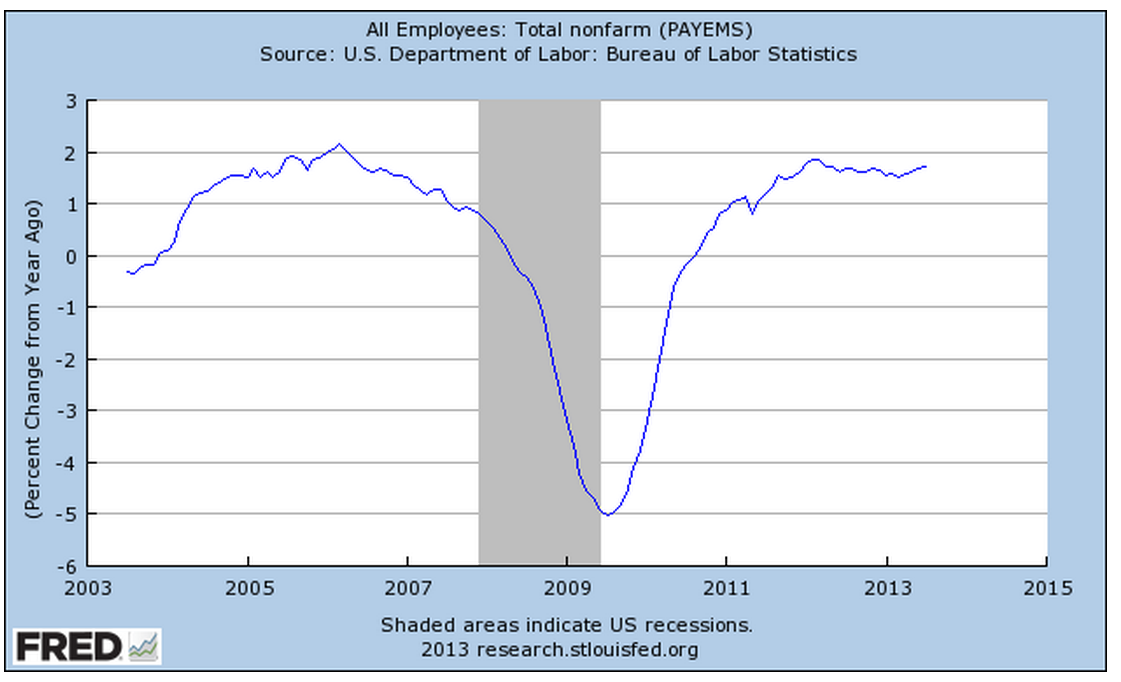
The employment picture has shown steady but slow improvement. The weekly survey of new unemployment claims continues to show downward movement. In a survey that is about 13 years old, called the JOLTS, the BLS gathers data on Job Openings, Layoffs and Turnovers. A component of this survey includes the number of employees who have quit their jobs, referred to as the “JOLTS quit rate.” In the aggregate, it indicates a hive intelligence, the estimation of millions of people about the prospects of getting another job. Decades ago, researchers asked a number of people to estimate the number of jelly beans in a jar. Each estimate has very small chances of getting close to the actual number, but the average of all estimates was found to be almost exactly the number of jelly beans in the jar. I don’t know whether this experiment has been replicated but it is interesting.

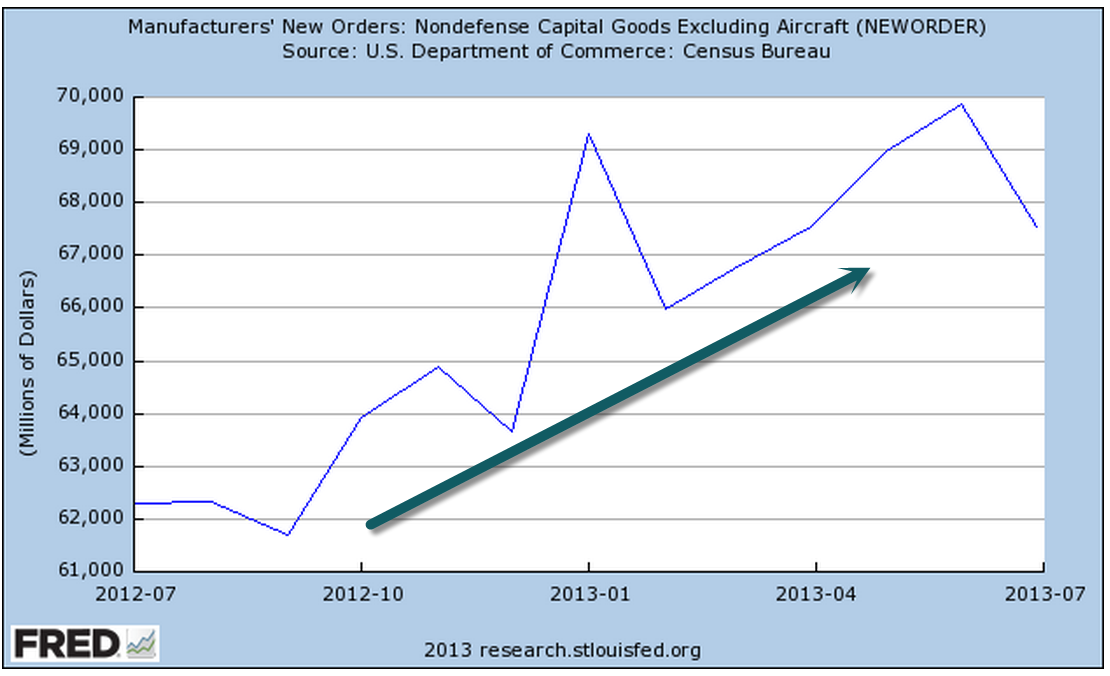
After recent months of surging new orders for durable goods, July’s report, released Monday, showed signs of caution and a “return to the mean” of a positive upswing this year.
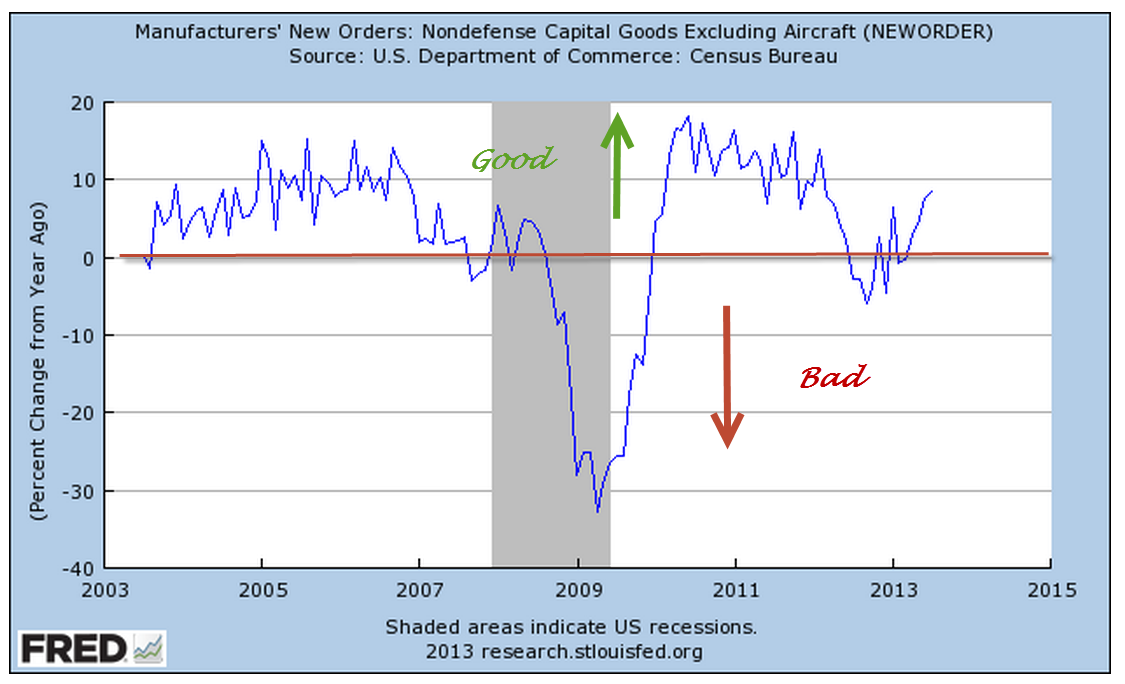
Although this past month’s data was negative, industrial production shows a clear uptrend.
In an analysis released a few months ago, the Federal Reserve examined data from the 2010 triennial (every 3 years) survey of households and estimated that inflation adjusted net worth per household (green line in the graph) has just climbed back to the level it was almost ten years ago.
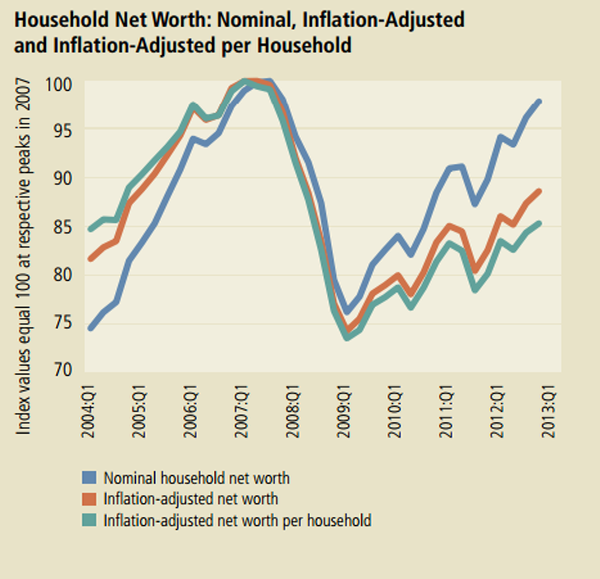
On the positive side, average net worth is not less than it was ten years ago. On the negative side for those nearing retirement, it is not more that it was ten years ago.
On Friday, the Personal Consumption and Expenditures (PCE) report showed a 1.4% year over year percent gain, indicating the tepid growth in household spending. Below I’ve charted the percent gain in PCE vs the percent gain in GDP for the past thirty years.
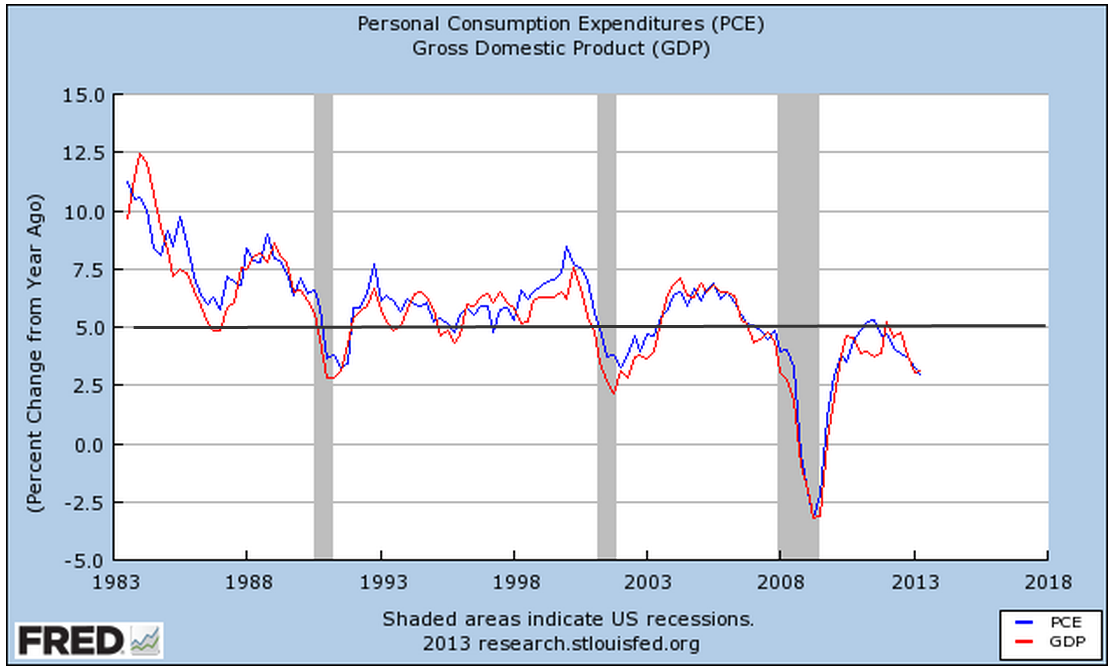
We are still below the low points of the 1980s, 1990s and early 2000s. The Federal Reserve is projecting GDP growth of 3 – 3.5% in 2014 but this may be another in a string of rosy forecasts by the Fed, who have repeatedly revised earlier rosy forecasts. If the Fed were a contractor, it would be out of business due to poor estimating. A $16 trillion economy is not a kitchen remodel by any means, but it does illustrate how difficult it is for the best minds to make even short term predictions of the economy from the vast amounts of sometimes conflicting data. Consider then the folly of the Government Accountability Office (GAO), the economic watchdog created by Congress and mandated by Congress to come up with ten year estimates of economic growth and the consequences of existing and proposed legislation. Those in Congress continue to trot out these fantasy numbers to support or criticize policy and legislation.
Washington continues to vacuum in money and talent from the rest of the country. Of the richest counties in per capita income in the U.S., the Washington metro area has two of the top three. The other county in the top three is a stone’s throw from the metro area. As Washington politicians convince the rest of us that they have the solutions, lobbyists and graduates flock to the concentration of power, jobs, money and influence.
Bond yields have increased more than 1% since the spring, meaning that the prices of the bonds themselves have fallen dramatically. Most of this change has been a reaction to forecasts for stronger growth and a tapering of the Fed’s stimulus program called Quantitative Easing. Washington is sure to get in the way of stronger growth for the economy as a whole. Policy out of Washington is designed to promote strong economic growth for Washington.
The market research firm Trim Tabs regularly monitors money flows into and out of the stock and bond markets. They reported today that outflows from the stock market in August were half of the record inflows in July.
The blood spilled this year has been in the bond market. Trim Tabs reports that outflows from bond funds and ETFs have totalled more than $123 billion in the past three months. Flows into bond funds and ETFs were about $750 billion in 2012, almost a doubling from the $400 billion invested in 2011. (Fed Flow of Funds tables F.120, F.121)
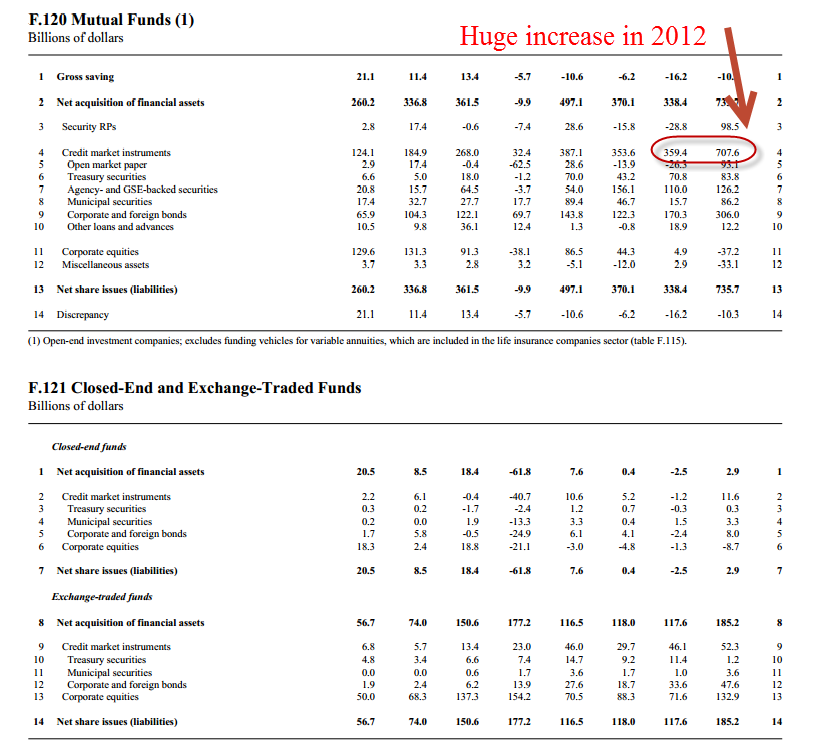
While the prospect of higher rates may have been the trigger that caused a reversal of bond inflows, the underlying current is also an overdue correction of the surge of investment in bonds in 2012.
Households continue to shed debt in one form or another so that total liabilities continue to decline. However, every man, woman and child in this country is carrying, on an inflation adjusted basis, 2-1/2 times the amount of debt they carried thirty years ago. This level of household liability will continue to put downward pressure on growth.

This next week will kick off with the ISM manufacturing report on Tuesday and finish the week with the monthly employment report. Year over year percent gains in employment have been steady and guesstimates are for maybe 200,000 net job gains. 150,000 net jobs are needed to keep up with population growth.