The Spread

May 22, 2022

by Stephen Stofka

Consumer spending during the pandemic and in the post-pandemic recovery has been strong. Inflation adjusted retail sales have averaged 5.6% annual growth since December 2019 (FRED, 2022a). However, the disruptions caused by the once-in-a-century pandemic have made the annual growth rates erratic, particularly those in the spring months when the pandemic hit. In spring 2021, retail sales numbers showed an annual increase of 48% over the previous year. Older Americans had been getting vaccines in the first months of 2021, shops were reopening and people were spending money. The economy was recovering but the size of the recovery was a “base effect.” Retail figures in 2021 were compared to retail sales in March and April 2020 when the economy was largely shut down. The American economy is so large that it is not capable of producing 50% annual growth in real sales.

Because the spring 2021 numbers were so strong, the numbers this spring look shaky. When the April retail numbers were released this week, traders began to mention the word recession and the market sank several percent. When people swarmed into stores in the spring of 2021, Target (Symbol: TGT) reported an increase of 22% in same store sales. A realistic portrayal of a customer behavior trend? No, it was an artifact of the pandemic disruption. In the first quarter of this year, the company reported a slight decline compared to those year-ago numbers. The reaction? The company’s stock fell 25%, an overreaction in a thinly traded market, and its worse loss since October 1987 when the broader stock market fell more than 20% in one day.

The stock market gets all the headlines each day but it is small in size relative to the bond market where the world’s lifeblood of debt and credit is traded. Over time the differences in interest rates between various debt products indicate trends in investor sentiment. These differences are called spreads. A common spread is a “term spread” between a long-term Treasury bond – say ten years – and a short-term Treasury of three months (FRED, 2022b). Short-term interest rates are usually lower than long-term rates because there is less that can go wrong in the short-term. When that relationship is turned upside down, it indicates a recession is likely in the near-term like a year or so. Why? Financial institutions are now expecting the opposite – that there is more that can go wrong in the short term than in the long term. They will be less likely to extend credit for new investments, business or residential.

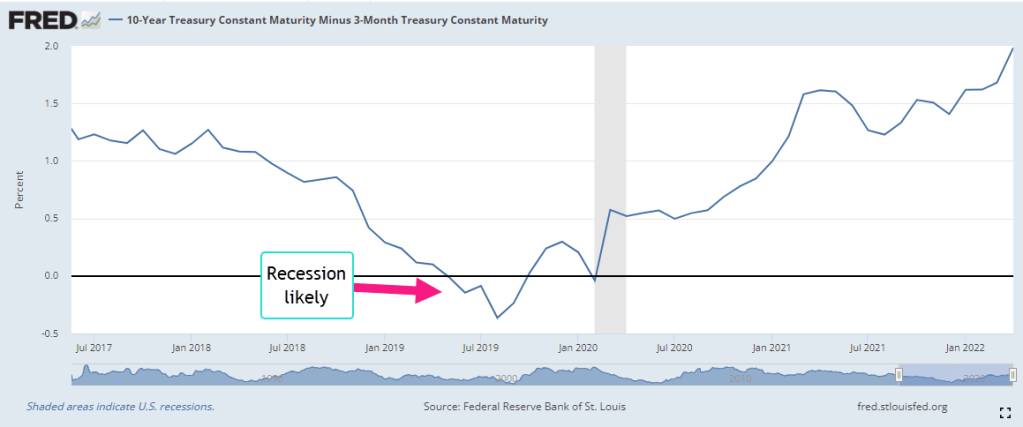
For the past forty years, this spread has been a reliable predictor of recessions and it does not confirm the market’s recent concern about a recession. There are a few shortcomings with this indicator. With a wide range of several percent over five years, it has a lot of data “noise” that might obscure an understanding of the stresses building in the bond market and economy. Secondly, Treasury bonds are a small part of the bond market and carry no risk of default. We would like a risk spread between the rates on corporate bonds and those on Treasury bonds. Thirdly, the Federal Reserve has much less influence over corporate bond rates than it does on Treasury bond rates. Comparing corporates and Treasuries would give us a better sense of the broader market sentiment.

Moody’s Investors Service, a large financial rating company, computes the yield, or annualized interest rate, of an index of highly rated corporate bonds in good standing with a term longer than one year. The yield spread between corporate and long-term Treasury bonds usually lie in a range or channel of 1-1.5%. Like the lane markings on a highway, channels help us navigate data. The upper bound of 1.5% indicates a stress point. Let’s call that the long spread (FRED 2022c).

The Fed Funds rate is an average of rates that banks charge each other for overnight loans and the Federal Reserve tightly manages the range of this rate. For most of the past decade it has been below 1% and has often been close to zero. Let’s call the difference between the yield on corporate debt and the overnight rate the short spread (FRED, 2022d). Most of the time, the short spread is larger than the long spread. Just as with our first indicator of term spread, this relationship flips in the near term preceding a recession. Importantly, they continue to move in opposite directions for a while. The short spread keeps getting smaller while the long spread goes higher. In the graph below is the short recession after the dot-com bust.

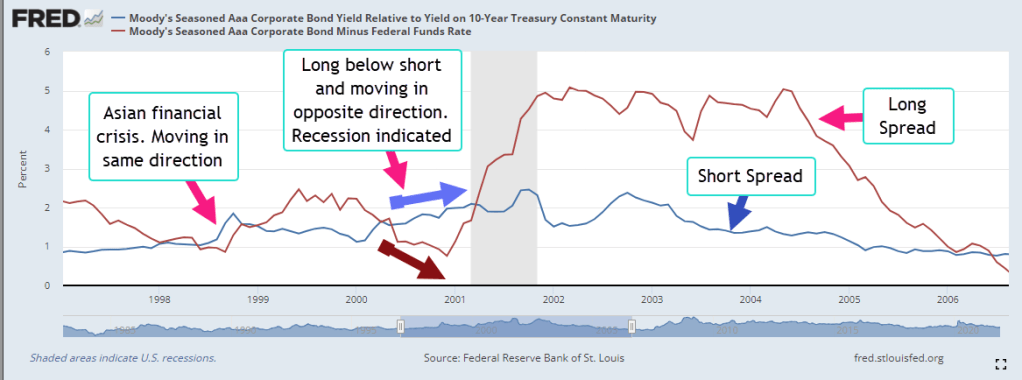
In the right side of the graph the pattern will telegraph the coming recession in 2008. The graph below highlights the years after the financial crisis. The short term spread remained elevated above 1.5%, an indication of the persistent stress in the bond market. During Obama’s two terms in office, the short spread fell only once into the “everything is OK” range. Helped by the prospect of tax cuts in 2017, the spread declined to a lasting lull.

In the last half of 2019, the conjunction of these two time-risk spreads indicated a coming recession. The term spread we saw in the first graph also indicated a recession. They suggest that a 2020 recession was likely even if there was no pandemic. The Fed had been raising rates through mid-2019 to curb inflationary trends, then eased back a bit in the final months of that year. Were they seeing signs of economic stress as well?

How would the 2020 Presidential campaign have evolved if there had been no pandemic but a short recession lasting six to nine months? The Republican tax cuts enacted at the end of 2017 would have been shown to be a bust, doing little more than transferring wealth to the already wealthy. Mr. Trump would have certainly blamed the recession on Jerome Powell, the Chairman of the Fed, whom he had appointed. Powell would have been characterized as a Democratic stooge, part of an underground political plot to get Donald Trump out of the White House. The stories of what could have happened are entertainment for a summer’s campfire.

//////////////

Photo by Nadine Shaabana on Unsplash

FRED. 2022a. Federal Reserve Bank of St. Louis, Advance Real Retail and Food Services Sales [RRSFS], retrieved from FRED, Federal Reserve Bank of St. Louis; https://fred.stlouisfed.org/series/RRSFS, May 18, 2022.

FRED. 2022b. Federal Reserve Bank of St. Louis, 10-Year Treasury Constant Maturity Minus 3-Month Treasury Constant Maturity [T10Y3M], retrieved from FRED, Federal Reserve Bank of St. Louis; https://fred.stlouisfed.org/series/T10Y3M, May 19, 2022.

FRED. 2022c. Federal Reserve Bank of St. Louis, Moody’s Seasoned Aaa Corporate Bond Yield Relative to Yield on 10-Year Treasury Constant Maturity [AAA10Y], retrieved from FRED, Federal Reserve Bank of St. Louis; https://fred.stlouisfed.org/series/AAA10Y, May 19, 2022. The “long” spread.

FRED. 2022d. Federal Reserve Bank of St. Louis, Moody’s Seasoned Aaa Corporate Bond Minus Federal Funds Rate [AAAFF], retrieved from FRED, Federal Reserve Bank of St. Louis; https://fred.stlouisfed.org/series/AAAFF, May 19, 2022. The “short” spread.

Long-Term Trends

January 7th, 2018

by Steve Stofka

This week I’ll look at a few long-term trends in the marketplace for goods and labor.  Millennials born between approximately 1982 – 2002 are now the largest generation alive. Their tastes will dominate the marketplace for the next twenty years at least.  In the first eighteen years of the new century, change has been a dominant theme.

Some businesses drowned in the rush of change. A former member of the Dow Jones Industrial Average, the film giant Eastman Kodak is a shadow of its former self after it emerged from bankruptcy in 2013.

Some in the music business complain that the younger generations don’t want to pay for music. Much of YouTube music is pirated material and yes, Google, the site’s owner, does remove content in response to complaints. There’s just so much of it. Album sales revenue in the U.S., both digital and physical, fell 40% in the five years from 2011 to 2016. Globally, the entire music business has lost 40% in revenues since the millennium and is just now starting to grow again (More).

Some in the porn industry make the same complaint as those in the music business. As online demand for porn grew, the industry helped pioneer digital payment security. Now there is too much free porn on the internet. Producers and distributors pirate each other’s content. Who wants to invest in good production values only to see their work ripped off? (Atlantic article/interview on the porn industry) Will the lack of quality reduce demand? ROFL!

An ever-diminishing number of city newspapers struggle to survive. Some complain that people don’t want to pay for local news. Local reporters have long been the bloodhounds who sniff out the corruption in city halls and state capitols around the country. There are fewer of them now.  Think that corruption has been reduced?  ROFL!

Surviving bookstores glance over their shoulders at Amazon’s growing physical presence in the marketplace. This year Amazon became the 4th largest chain of physical bookstores. The large book publishing houses try to preserve their hegemony as readers turn to a greater variety of alternatively published books.

As online sales grow, brick and mortar stores struggle to produce enough revenue growth to sustain the costs of a physical store.  During the past three years, an ETF basket of retail sector stocks (XRT) is down almost 10%.

Hip-hop music was a fad of the ‘80s and ’90 until It wasn’t. Rock ‘n Roll was a fad that has lasted sixty years. In the early 60s, the Beatles were told to make it rich while they could, and they worked hard to capitalize on their success before it fizzled. Never happened.

How are we going to predict the future if it is so unpredictable? Some standards fade while some fads become standards. We face the past, not the future, as the future sneaks up on us from behind.

//////////////////////////////

Employment

A few notes on what was the weakest employment report of the past year. Job gains were only 150K as reported to government surveyors but the percentage of businesses responding to the survey was particularly low. Expect the BLS to revise those job gains higher next month when more of the survey forms come in. I have long used an average of the BLS numbers and ADP’s estimate of private job gains. That average was 200K – a healthy number indicative of a growing economy.

The long-term trend remains positive. The annual growth of total employment should be at 1.5% or above. We are currently holding that threshold despite the loss of jobs to automation and the growing number of Boomers retiring.  Growth in construction jobs  remains at or above the growth in total employment – another healthy sign.

ConVsPayemsGrowth

The employment market faces a long-term challenge as the largest generation of workers in history is retiring. In January 2000, 69 million adults were out of the labor force. That figure now stands at 95 million. As a ratio, there were 53 adults not in the labor force for every 100 adults with a job. Now there are 65 adults for each 100 workers.

NotInLabForceVsPayems

Although growth in hourly wages is at 2.5%, weekly paychecks have grown 3% as part-time workers get more hours or find full-time jobs. Look for inflation to approach that growth in paychecks.

WeeklyEarnVsInflation

When inflation rises above paycheck growth, workers struggle more than usual to balance their income with spending.  I’ll use that same chart to highlight some stress points during the past decade.

WeeklyEarnStressPoints

As the economy continues to improve, the Fed is expected to continue increasing interest rates either two or three times in the coming year.  After a decade of zero interest rates (ZIRP), those with savings accounts may have noticed that their bank is paying 1% or more in interest.  It is still a far cry from the 4% to 5% rates paid on CDs in the ’90s and 2000s.  This past decade has been particularly worrisome for older folks trying to live off their savings.

River Rafting

July 15, 2017

After a good year of snowfall in the Rockies, the rivers run strong. A popular spot for rafting is the Colorado River as it runs through the dramatic scenery of the Glenwood Canyon in western Colorado. Investing is a lot like rafting. We can’t control the amount of snowfall, the change in elevation, where the rocks are or the streams that feed into the river.

Our individual and group behavior on the river can help or hinder our progress. In a good year, rafting companies charge more for a rafting adventure. As more people come onto the river, we must pause in quiet water at the river’s side to give a safe distance between rafts. This crowding effect is made worse by stretches of river that require more caution to navigate. We can steer right or left to avoid some rocks but we are largely at the mercy of the river and each other.

Since the budget crisis in the late summer of 2011, the stock market has enjoyed a fairly strong run, more than doubling since that time. The financial crisis nine years ago was like a winter of extraordinarily deep snowfall. The Fed has kept interest rates abnormally low to thaw that snow, and equity investors have had a wonderful ride.

The Federal Reserve has committed to a series of gradual rate increases. Despite the low rates, people continue to pour their extra money into savings accounts and CDs. Wells Fargo is paying almost 1% below the Fed discount rate on their savings accounts. Why? As long as their customers are willing to accept savings rates of .3%, Wells Fargo has no incentive to raise rates. Discover, Goldman Sachs, American Express, Ally and Synchrony are paying about 1.15%, the Fed rate. (Bankrate) Savings account balances are near $9 trillion, more than double the balances in late 2007 before the recession began. The fear lingers.  Many people stand on the shore, too cautious to ride the river’s tumble and flow.

Until 2015, retail sector stocks (XRT) have been on a fast raft, quintupling from the market lows of March 2009. Over the past two years they have drifted into a side pool, losing about 20%. This year the stocks have been quite volatile as investors gamble on the future of the retail industry. Will Amazon continue to take sales from traditional brick and mortar stores?

June’s retail sales (RSXFS) were disappointing. Year over year growth was 3%, less than the 5 year average of 3.3%, and far below the near 5% growth of the 1st quarter. Excluding auto sales and auto parts (RSFSXMV), annual growth was only 2.4%, a 1/2% below the five year average and half of the 1st quarter rate.

The Trump administration and the Republican Congress have aimed for 3% real – inflation adjusted, that is – GDP growth. In an economy that depends so heavily on consumer sentiment, slowing retail sales will make that growth goal difficult to achieve.

For now, the sun is shining, the river is running strong and I am enjoying myself.  As long as I don’t look around the next bend in the river, everything looks fine!


Market Bumps

January 26th, 2014

In a holiday shortened week, the market opened higher than the previous Friday but fell a bit more than 3% by week’s end.  On this same week in 2012, the market lost 2.5% in 3 trading days.  As I mentioned last week, there were few economic reports this past week to detract from the focus on corporate earnings.

IBM opened up the week by beating profit estimates but missed revenue estimates by $1 billion, or about 3%, and were about $1.5 billion less than the final quarter of 2012.  The 4th quarter is usually IBM’s strongest quarter each year; lower revenues from this giant indicate a cautious business investment outlook.  IBM is selling for the same price now that it did in mid 2011, a price earnings ratio of 12.

The following day, China announced that the country’s industrial production has fallen just below the neutral mark.   The reaction to the news was exaggerated by sharp declines in some emerging market currencies, which started a cascade of selling. See SoberLook blog for some charts. Similar weakness out of China last summer prompted a much more subdued reaction.

On Thursday, McDonald’s reported weak sales growth, which added to concerns.  After a run up of 30% last year, many traders were on high alert for any negative news.  The U.S. stock market has enjoyed a tail wind from Federal Reserve stimulus policy, but a global economy is largely outside of the Fed’s influence.

A 14 month support trend line that has been in place since November 2012 sets a mark at about 1760.  Dropping below that would signal a short to mid term shift in market sentiment.  The SP500 index closed at 1790 on Friday, 1.7% above that support trend line.  The 10 month average of the index is 1700.  A drop below that mark would signify a change in mid to long term sentiment. A few weeks ago, I noted that the market was close to 10% over its 10 month average.  This week’s decline puts that percentage at a bit over 5%.

******************************

Existing home sales notched up a bit in December but the yearly percent gains were relatively flat.  The 4 week average of new claims for unemployment declined to 331,000.  Several weeks ago it was close to the psychological 350,000 mark.  Mitigating the decline in new claims, continuing claims have been rising lately and are approaching the 3 million mark.

To put that 3 million people in historical perspective, take a look at the chart below.

The number of long term unemployed is ever a concern.

*************************

In early October I noted the relative sluggish performance of retail stocks vs the larger market index of the SP500 ahead of the Christmas buying season.  Below is an updated chart of a retail index ETF vs the larger market.

Shortly after that post, renewed hopes for a strong Christmas season led to higher prices for the group.  Disappointing sales gains announced as the season ended deflated that balloon.  Since the new year began, a composite of retail stocks has lost 8%.

Typically retailers report their earnings in mid to late February.  Traders have already priced in a rather disappointing earnings season for the retailers.  In the context of a longer time frame, retail stocks are still up 25% year over year.  If an investor had bought this composite on this date seven years ago when the economy was strong and retail stocks were at a high, she would still have doubled her money, easily outpacing the 38% gains in the larger market since then.  The resilience of consumer demand, despite an extremely severe downturn when unemployment and falling house prices put a brake on consumer spending, has helped make this sector a sure footed long term winner.  

Trends and Bubbles

November 17, 2013

This week the department store Macy’s reported sales growth that was above forecast.  Same store sales rose 3.5%, about 50% better growth than expected.  Macy’s attracts a higher income customer than Target, J.C. Penney or Wal-Mart.  On Thursday, Wal-Mart announced that their sales had declined for a third quarter in a row.  The holiday season depends on lower and middle working class folks, the kind who shop at Wal-Mart, to open their pockets.  Investment firm Morgan Stanley expects this retail season to be the worst since 2008 when the country was deep in recession. (Source)
What can we learn from a bird’s eye view of the growth in consumer credit?  At 5.6% year over year, it is stable.

Note the response time lag in this series.  The growth in consumer credit did not decline below 5% till months after the recession started.  Despite the loss of hundreds of thousands of jobs in the beginning of 2008, this net job loss represented less than 1% of the work force in mid-2008.  The job loss would mount into the millions but jobs are “sticky,” meaning that a downturn in the economy has a minor effect on most people most of the time.  After the fact, it is easy for us to point at some chart, arch our eyebrows in a knowing glance, and say “We can see the breakdown of the economy beginning here.”

On a long term chart, we can see a reduction in growth swings over the past thirty years.  Relatively flat income growth for a majority of workers has dampened the swings.  While good for household balance sheets, it means that we can expect less economic volatility but also muted growth for the next decade.

Expectations for the holiday season are not reflected in the price of retail stocks.  A basket of retail companies has grown about 40% this year and is up about 70% over two years.  It may be time to take a bit off the table in this sector.

The Consumer Financial Protection Bureau (CFPB) was created a few years ago to act as a watchdog over the credit practices of the largest banks.  On Tuesday, Richard Cordray, Director of the agency appeared before a Senate committee.  He confirmed that the agency collects a lot of anonymized data on 900 million credit card accounts each month as part of its supervisory role.  Questions should be raised whenever any government agency collects data on us.  How is the data protected?  Who has access to the data?  What about my privacy?

Mr. Cordray noted that several other agencies as well as private industry collect this data.  Because the data is anonymized, we are little more than a number to  the agency, but there are several concerns.  Federal agencies have a great deal of legal power, enabling them to get a warrant to access  the data on anyone.  Cordray repeatedly assured the committee that no one at the agency is interested in our personal data but left off one adverb – “now.”  In the aftermath of 9-11, anti-war protestors found themselves turned away at airports or flagged for additional screening.  How did federal agencies know the travel plans of many protestors?  It does not take a team of FBI agents to trace the activities of any citizen when several federal agencies have our monthly financial activity at their fingertips.  Secondly, there is the matter of security.  How many parties does our data go through on its way to the agency?  Where and at what stage in the process of data aggregation is the anonymizing done?  Is our personal credit card info transmitted first to a separate third party anonymizer before being transmitted to the various agencies?  Is the raw data being transmitted to an agency which then anonymizes the data using a third party program or process?  In any case, it was clear that our monthly card transactions are making the rounds in both private industry and various government agencies.

The stock market continues to rise, prompting talk of a bubble.  If you have access, try to read “Is This A Bubble” by Joe Light in this weekend’s edition of the Wall St. Journal.   It is both informative and measured in its assessment.

 In February 2012, I mentioned the Golden Cross which had occurred in late January.  This long term indicator of market sentiment is a crossing of the 50 day moving average of stock market prices above the 200 day average.

Since then the market has risen about 40%.  Man, if I had only taken my own advice and moved all my investments and money into the stock market!  As the market continues to rise, more and more investors catch the “if only” disease and start moving money from safer investments into stocks.  This is why many of us tend to buy high and sell low.  Instead we should stay with the fundamentals of diversify, diversify, and lastly – diversify.  A long term indicator like the Golden Cross is not a signal to dump all of our savings into stocks – unless we are in our 30s and have lots of time before we need the money.  A more sensible approach is to adjust allocation upwards towards stocks and this depends on a person’s age, needs, and fears.  If a person has a 50% stock allocation, with the remaining 50% in bonds and cash (I’ll leave alternate investments out for right now), that indicates a moderate tolerance for risk.  They might shift the allocation to 55% stocks or 60% when they see a Golden Cross.   A person who has a 70% allocation to stocks, indicating a high tolerance for risk, might start adjusting to an 85% to 90% allocation.  Using this more moderate approach, a person would have lightened up their stock allocation in December 2007 when a reverse Golden Cross happened.

So what if someone has been very scared of the stock market and has only 10% of their savings in stocks?  Should they move some money into the market now?  That depends.  If the thought of making even a slight change leads a person to lose sleep, then no.  Should someone change their allocation of stocks from 10% to 50% now?  That is a major allocation change and should be done using dollar cost averaging.  This is a process where one takes money from one investment basket every month and puts it in another investment basket. There is also a psychological advantage to this approach.  As a person’s allocation percentage becomes a bit riskier, they can adjust to the additional risk in a measured way.

Tolerance for risk is a composite of several components:  psychological or emotional, future liquidity needs, age, and assets as well as income sources.  Too often, people think of tolerance for risk as an emotional response only.  While it is true that our emotions can cloud our measured response to risk, it is important to keep in mind that it is only one of the components.

**************

In answer to calls from his own party members, President Obama announced an administrative change to the Affordable Care Act (ACA) that allows those with policies in the individual health care market to retain their policies even if the policies don’t meet the minimum standards of the ACA.  Politicians, pronouncements and podiums – stir them together and voila!  The President’s pronouncement was little more than political cover at this late stage in the transition to Obamacare.  Only if the states allow it and companies decide to offer the plans will an individual policy holder be able to “keep their plan,”  as the President promised on numerous occasions in the past few years.

On Friday, the Energy and Commerce Committee released emails subpoenaed from CMS, the agency that administers Medicare and the ACA.   The emails contradict previous testimony by both CMS head administrator Marilyn Tavenner and HHS Secretary Kathleen Sibelius that only routine problems with the healthcare.gov web site were anticipated before the launch of the web site.  Ms. Tavenner testified that there were enough problems that they decided to delay the implementation of the small business plans on the web site but it appears that the problems went much further and top officials were alerted.

Henry Chao, the deputy CIO at CMS, was made aware of many major security, transactional and design problems with the web site during the summer but decided – or was pressured to decide – that the site would go live on October 1st regardless.  President Obama’s repeated selling point has been what he calls “smart” government. The rollout of the federal health care website has  revealed – once again – that the government in Washington has become too big and too top down to be smart, or effective.  To keep their campaign coffers filled, too many in Washington must placate those companies which fund those coffers, including special favors and bailouts for the elite on Wall Street.  To get the votes, they must placate the poor with programs and promises.

A conflict of interests and a clash of incentives makes most of the Washington crowd ineffective.  Turn on C-Span and watch the faces of the House and Senate Budget Conference (House and Senate).  These are intelligent, committed people who feel the pull of these different puppet masters, those political interests that keep them in their respective seats.   Each one of them earnestly wants to fix the problem – and that is the problem.  Much of the time, they are fixing the previous fixes they implemented.  This approach makes Congress feel important. I would suggest that they do little more than enact incentives and let their constituents craft the solutions.  Sure, the solutions will not be crafted with the superior technical expertise that Washington promises. Instead, they will emerge in a stumbling, hodge-podge way that will disenchant those who believe in the romantic notion of omniscient experts who engineer elegant solutions to social and economic problems.  I hope that one day the Washington elite will let Main St. try to figure out the solutions to some of these problems. We can do better.