Paradoxes in Savings

March 12, 2023

by Stephen Stofka

Paradoxes in Savings

The week’s letter is about the relationship between savings and inflation. On Tuesday, Jay Powell, the Chairman of the Fed, announced that they would continue raising rates to get inflation under control. The market dived a few percentage points. There are no shortage of explanations for persistent inflation. Despite an inflation rate above 5% for the past year, the employment market remains strong, a puzzle to economists. I will take a look at how changes in savings affect inflation.

There are times when we coordinate our behavior for apparent reasons. The weather and seasons synchronize the activities of farmers. The harvest comes at a particular time and farmers need to rent more harvesting equipment, storage capacity, rail cars and trucks for transporting their crops. Suppliers are on a different time schedule than their customers.  Supplying anything takes planning, investment and time.

Suppliers rely on the fact that buyers coordinate their buying decisions according to the seasons. Clothes, gardening and Christmas gifts are easy examples. Forty percent of homes are sold during the spring months. Except for big purchases, a buying decision takes less planning and this can create anomalies that suppliers are not prepared for. Sometimes it is a popular toy at Christmas or a clothes style made popular by a celebrity.

What causes asset buyers to coordinate their behavior? The economist John Maynard Keynes was particularly interested in that question. He attributed the phenomenon to “animal spirits,” an infectious rush of pessimism or optimism that affects the prices of assets first, then spreads to the purchases of goods. Normally, some of us are saving more than usual for something, while some of us are spending that savings, or borrowing to buy things. There is a balance of savers and borrowers. However, sometimes a general prudence causes everyone to save more than average and what emerges is a paradox, the Paradox of Saving. If everyone saves, then economic activity declines, unemployment rises, people spend down their savings and the economy finds a new equilibrium at a much lower growth rate.

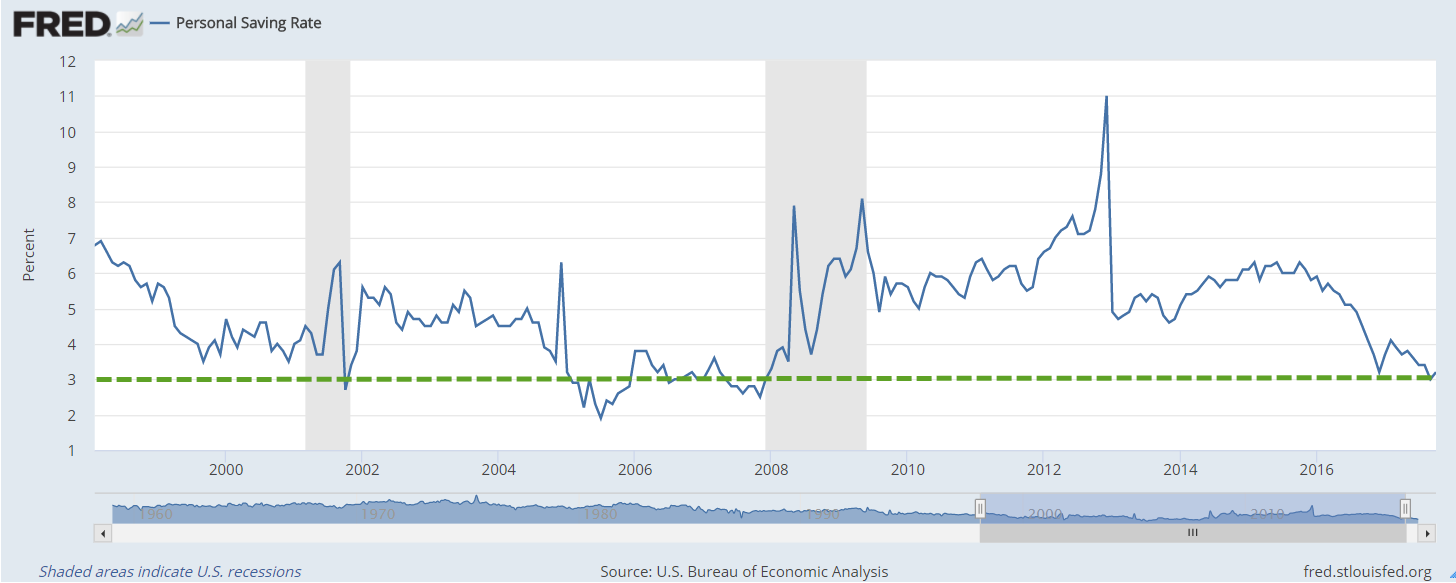
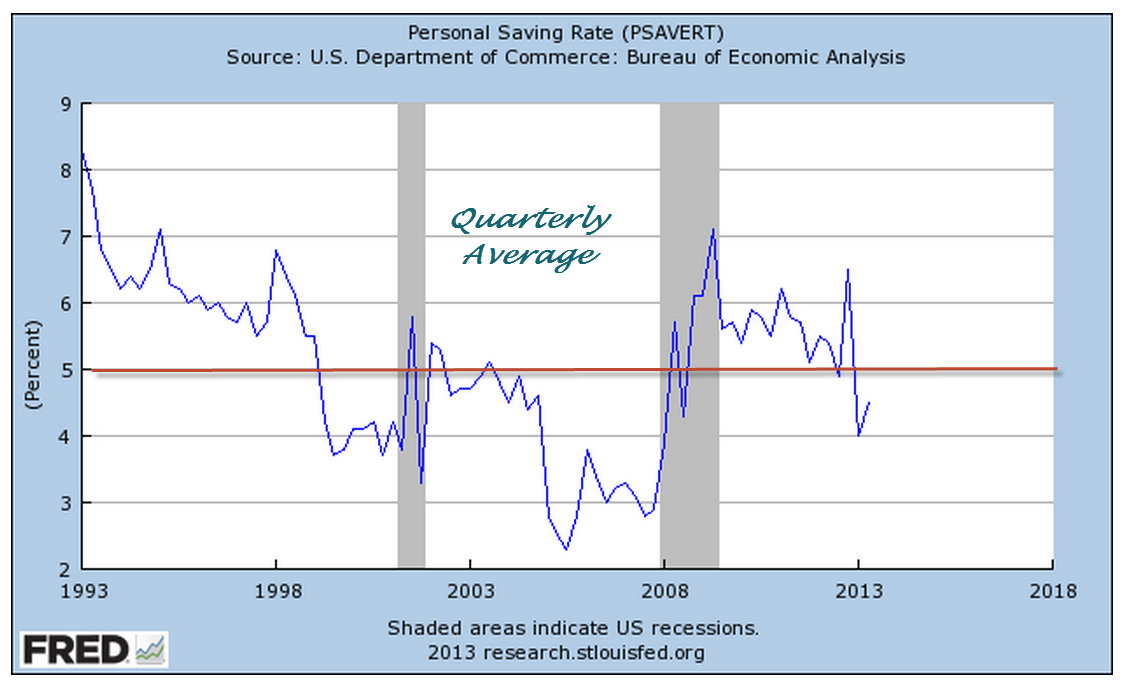
In the spring of 2020, a surge of Covid deaths in Italy and New York City prompted the closing of many businesses. City morgues were overwhelmed, forcing hospitals to rent refrigerated trucks to store the bodies. The NY health department supervised several mass burials. Residents in rural areas who were unable to catch their breath were flown to distant hospitals with the equipment and personnel capable of bringing the patients some relief. Because many workers had abruptly lost their income, the government issued relief payments to households throughout the country. With many entertainment venues closed, many of us increased our rate of savings. Below is a graph of the quarterly change in the personal savings rate.

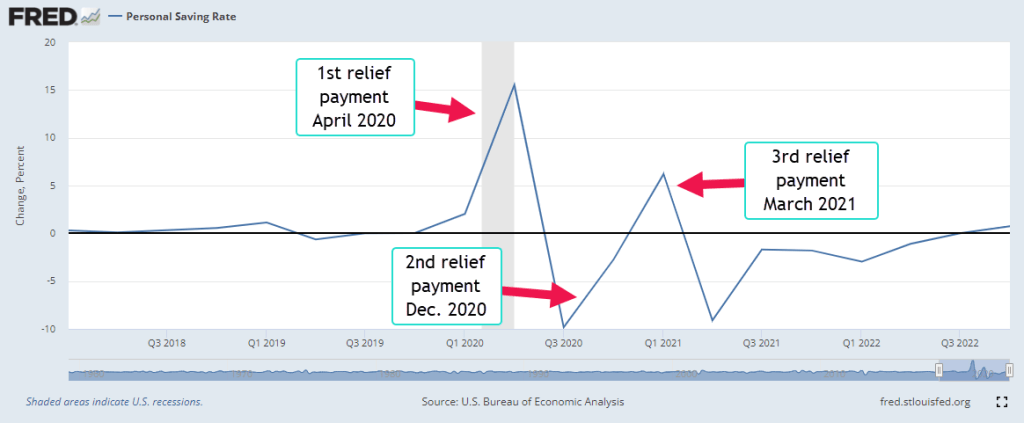
The savings rate shot up 15%, a historic rise. Even during the high inflation of the 1970s, the savings rate rose by only 2.5% in 1975. Such an abrupt change in savings did have an effect on prices. When the change in the savings rate is negative, people are buying stuff with their savings. Companies could take advantage of supply chain bottlenecks and raise prices. This helped make back what they had lost in profits in 2020. The quarterly change in prices began to rise, as the red line in the chart below indicates. Note that inflation is the annual, not quarterly, change in prices.

Look on the right side of that chart and you will see the blue savings line turning positive. A steadily higher savings rate should exert some calming effect on prices. I then ran a statistical regression on the annual change in both prices, i.e. inflation, and the savings rate for the past 35 years. The effect of a 1% rise in the savings rate is about a 1% decrease in the inflation rate and explains 21% of the movement in inflation.

What can you do with this information? Quick erratic changes in savings have an effect on prices. Immediately after 9-11 there was an abrupt rise and fall in savings but the change was much less than the pandemic shock, which was truly historic. In 2008 came another shock, an abrupt shift in savings and an accompanying rise in prices in the summer of 2008 before the Lehman meltdown in September and the economy tanked in the 4th quarter of 2008. These changes in savings rates don’t occur very often, but when they do we should pay attention.

////////////////////

Photo by Johannes Plenio on Unsplash

A Virtuous Cycle

August 7, 2022

by Stephen Stofka

July’s employment survey (BLS, 2022) reported a half-million job gains and marked a milestone – the recovery of all the jobs lost during the pandemic. In addition, earlier employment gains were revised higher by 28,000. The BLS survey indicated that only 7.1% of employees worked remotely, a surprising contrast to the amount of attention that the media gives teleworking. Last week, I discussed the dating of recessions. With this report, it is unlikely that the dating committee at the NBER will dub this a recession. Consumption, income, employment and investment are the pillars of this economy and they are doing well, contributing to the current inflationary trends.

Annual gains in private investment topped 18% in the second quarter, besting the 16% gain in 2012:Q1 a decade ago (series notes at end). Businesses invest in people, driving up employment gains. In the graph below, I multiplied the annual gain in employment by 4 to show the correlation between investment and employment.

Higher employment leads to higher incomes. Just as employment has returned to pre-pandemic levels, real (inflation-adjusted) disposable incomes are now at pre-pandemic levels. Disposable income includes government transfers like social security and pandemic stimulus checks. The last stimulus checks went out in March/April 2021, more than a year ago. It’s a good bet that these are sustainable income numbers produced by economic growth, not the result of special  transfer payments.

Higher incomes lead to higher spending. Real (inflation-adjusted) consumption spending marked an annual gain of 1.57% in June and is now up 4.5% over pre-pandemic levels. Consumers have made an abrupt shift from buying goods to buying services. Real sales at restaurants are now 10% above pre-pandemic levels.

To keep up with high demand for goods and clogged shipping ports during the pandemic, Target and Wal-Mart ordered extra and now have more inventory than they would like. Their loss is the travel and leisure industry’s gain. Marriott Hotels (2022) reported a surge in demand this year. In the U.S. and Canada, their leisure traffic is 15% above pre-pandemic levels and their revenue per room is about the same as in 2019.

Higher incomes usually lead to higher savings. In the decade before the pandemic, households saved 6-7% of disposable income. In 2020 and 2021, the savings rate averaged a whopping 20% and 12%. Most of that higher savings was done by households with higher incomes. Congress could have passed a CARES act that sent stimulus payments only to those with lower incomes, but they chose not to. Those additional savings became investment and that brings us full circle to the higher investment and employment – a virtuous cycle that Adam Smith wrote about more than two hundred years ago.

////////////////////

Photo by Markolf von Ketelhodt on Unsplash

BLS. (2022, August 5). Employment situation summary – 2022 M07 results. U.S. Bureau of Labor Statistics. Retrieved August 5, 2022, from https://www.bls.gov/news.release/empsit.nr0.htm

Marriott Internatonal. (2022, August 2). Marriott International Reports Outstanding Second Quarter 2022 results and resumes share repurchases. Marriott International Newscenter (US). Retrieved August 5, 2022, from https://news.marriott.com/news/2022/08/02/marriott-international-reports-outstanding-second-quarter-2022-results-and-resumes-share-repurchases

U.S. Bureau of Economic Analysis, Gross Private Domestic Investment [GPDI], retrieved from FRED, Federal Reserve Bank of St. Louis; https://fred.stlouisfed.org/series/GPDI, August 5, 2022.

U.S. Bureau of Economic Analysis, Real Personal Consumption Expenditures [PCEC96], retrieved from FRED, Federal Reserve Bank of St. Louis; https://fred.stlouisfed.org/series/PCEC96, August 4, 2022.

U.S. Bureau of Economic Analysis, Real Disposable Personal Income [DSPIC96], retrieved from FRED, Federal Reserve Bank of St. Louis; https://fred.stlouisfed.org/series/DSPIC96, August 4, 2022.

U.S. Bureau of Economic Analysis, Personal saving as a percentage of disposable personal income [A072RC1Q156SBEA], retrieved from FRED, Federal Reserve Bank of St. Louis; https://fred.stlouisfed.org/series/A072RC1Q156SBEA, August 4, 2022.

U.S. Census Bureau, Advance Retail Sales: Food Services and Drinking Places [RSFSDP], retrieved from FRED, Federal Reserve Bank of St. Louis; https://fred.stlouisfed.org/series/RSFSDP, August 5, 2022. Note: I adjusted for inflation using the CPI.

 U.S. Bureau of Labor Statistics, All Employees, Total Nonfarm [PAYEMS], retrieved from FRED, Federal Reserve Bank of St. Louis; https://fred.stlouisfed.org/series/PAYEMS, August 5, 2022.

Prices Rising

November 14, 2021

by Steve Stofka

Put a bunch of people in a crowded theater, then yell “Inflation!” and no one runs for the exits. Instead they all turn to each other and start arguing. The recent rise in prices has prompted much discussion on the dynamics and causes of inflation. In the first six months of this year, the Fed cautioned us to compare 2021 prices to those of 2019 to get a more accurate picture of inflation. That longer term perspective began at 2.0% in January and slowly rose to 3.0% in June (BLS Series CUUR0000SA0). However, it keeps inching up and topped 3.7% in October. The one-year inflation rates have topped 6%. There are several causes including supply bottlenecks and higher demand but how long will it last? Is it temporary or more permanent? What should the Fed do? Is this the return of 1970s inflation?

This will be a two-parter so that I don’t strain anyone’s attention. First some background. Inflation is an increase in the overall price level. Why do prices go up? Because buyers buy stuff. How do people get the money to buy stuff? By working. In the 1950s, a British economist William Phillips studied a seventy year period of data and established an inverse relationship between unemployment and inflation. If more people are not working, they don’t have the money to buy stuff and prices don’t go up much. During the 1960s, unemployment declined more than 3% to 3.4% and inflation rose from 1% to 5%. This interplay confirmed Phillips’ hypothesis and policymakers believed that they could make a tradeoff between unemployment and inflation, balancing the two to produce an optimal economy. In the 1970s, high inflation and high unemployment dashed those hopes. Later, the Phillips hypothesis was revised, matching the relationship of the change in the inflation rate to unemployment.

Still other revisions included the role of the public’s expectations of inflation. I’ll take a real life example from the late 1970s. The price of a stereo with turntable and speakers is expected to go up in price by 20% next year. A store is offering credit with a 20% interest rate. If a consumer buys it now rather than saving up until next year, the amount of interest equals the change in price. A consumer gets to use the stereo for a year for free! Consumers start moving their future buying decisions toward the present and this ratchets up demand and inflation. 

Let’s go back to the definition of inflation as an increase in the overall price level. Where does that start? It may be the price of a commodity that we all use every day. During the 1970s, the sharp increase in the price of oil certainly had an effect. However, there was a sharp increase in oil in the summer of 2008 and there was not a prolonged bout of inflation. In fact, it may have contributed to the ongoing job loss that began in 2007 and added fuel to the developing housing crisis. Every time people think they got inflation figured out, it ducks and weaves like a boxer.

Without any change in policy, inflation automatically transfers income around the economy. Real, or inflation-adjusted, wages may remain the same but workers pay higher taxes on the nominal gains in wages. Economists call this seigniorage. The price of goods is higher so sales taxes are higher. Older people with savings earn higher interest income but those who want to borrow pay more in interest. Banks bank more profits on the difference, or spread, in the interest they pay on deposits and what they charge for loans. At higher mortgage rates, people can buy less house with their money because mortgage payments in the early years of a mortgage are mostly interest.

At higher rates of interest businesses cut back expansion plans and unemployment increases. This may help curb price pressures but people begin to adopt coping strategies than can prolong or exacerbate inflation. This creates a tug of war over the direction of prices. Next week I’ll review some of these behaviors and data trends from the past decades.

////////////////

Photo by Vicky Ng on Unsplash

Free Stuff

January 21, 2018

by Steve Stofka

I like the 21st century. I get a lot of free stuff. Opinions, news and information, and directions to anywhere on the planet. Free apps and games for my phone. Free porno and free sermons.

I get so much free stuff that I can afford to pay for fancy coffee and smart phones, television and internet access. I can now afford a personal guru to align my chakras. My personal assistant, Alexa, listens to me and answers my questions.

Goodbye and good riddance to the 20th century with its clunky records, cassettes and DVDs. I say “Alexa, play me blankety-blank song,” and millions of tiny electrons do my bidding, and out comes my song!

My real personal income has doubled since 1973 (Average per capita income ) so I got all this extra free money. I’m getting paid more at work than 45 years ago. My total compensation has gone up 44% (Total real compensation per employee ). My employer provided benefits have doubled (Real employee benefits ). My employer kicks in more free money into my retirement program, and into my health care insurance. That’s real dollars, after inflation.

I got so much extra free money coming in that I’m living like royalty. My income has gone up 100% in 45 years, but my spending has increased 137% because I’m a first class 21st century person that banks want to loan money to.

Outlays1973-2017

Since 2000, I eat out a lot more – like 75% more (Real restaurant sales ). I deserve it cause I’m making all this extra money and I’m too busy to cook. In 2000, I was spending $11.50 a day for shelter but I needed more personal room and modern conveniences. Now I got more room but I’m spending $16 a day.

HousingCostRealPerCap2000-2017

Living first class means that I’m saving a lot less of my free extra money.  45 years ago, I was saving 12% of my income.  Now it’s 3%. But there’s an easy fix to that. More free stuff!
//////////////////////////////

Farming Communities

This past summer, my wife and I joined the many thousands of solar eclipse watchers who visited western Nebraska, where the totality and length of the eclipse was near its peak.  At hotels, shops and restaurants we were greeted with a cordiality that is typical of Nebraskans.  They worked extra hours to accommodate the influx of visitors. At one restaurant, our waitress remarked that the extra business would make up for the slack earlier in the year.  The reason?  Not the food and service, which were both excellent. The locals weren’t eating out as much. And why was that?

Last week, I wrote about the seven-year downturn in commodity prices that has affected many rural communities.  Although agriculture contributes about 6% to GDP (USDA) the changing fortunes of the people who produce our food gets little attention in urban areas.

A few hundred miles away, Denver is booming.  Gentrification and rising housing costs have stressed the pocketbooks of some families.  In Nebraska, it is declining prices that have caused stress fractures in the community (Denver Post ). Land values declined 4% in 2015, and another 9% in 2016 (U. of Nebraska-Lincoln report).

Despite a strong export market for corn, soybeans and other agricultural products, Iowa has had falling land prices for three years. In a recent survey, 40% of responding Iowa farmers reported lower sales in 2017.  However, there was a slight uptick in land values this past year and the hope is that the Iowa agricultural community may be turning a corner.

As land values decline, banks lower lending limits, refinancing terms become more strict.  Families sit at the kitchen table and try to pay higher bills with less money.  Property taxes decline so that there is less money for schools and other public infrastructure.  Seeing the stress that their parents face, younger folks are attracted to urban areas where there is more economic opportunity.  Farms that have been in the family for several generations get sold to large farm management companies.

The governors of western states must understand that they serve all the people of their state.  As people concentrate in the urban centers, they demand more resources from the state.  Those in rural areas feel as though they are being left out.  They will form elective coalitions within state legislatures to offset the growing urban power.

To those in the dense population centers of the coastal states, the shifting political and economic alliances in the fly-over states might earn a shrug.  Our federalist system of voting was a grand bargain to offset the dominance of high population states.  The 2016 election was a good lesson in the power of electoral federalism.  State and federal politicians must build a bridge that crosses the divide between the fortunes of those in urban and rural areas.

Expectations

by Steve Stofka

December 3, 2017

What can I expect from my portfolio mix? Portfolio Visualizer has a free tool  to analyze an asset mix. We can also get a quick approximation by looking at a fund with that mix.
An investor with a 40/60 stock/bond mix might go to the performance page of Vanguard’s Wellesley Income fund VWINX. It’s 50-year return is close to 10% but that includes the heady days of the 1970s and early 1980s when both interest rates and inflation were high. The ten-year performance of this fund includes the financial crisis and is close to 7%.

An investor with a slightly aggressive 65/35 stock bond mix could look to Vanguard’s Wellington Fund VWELX, which has a similar weighting. It’s 90-year return is 8.3% but that includes the Great Depression and WW2. It’s 10-year return is – wait for it – close to 7%.

Two funds – a conservative 40/60 and a slightly aggressive 65/35 – both had the same ten-year returns. All it took was one bad year in the stock market – 2008 – to even up the returns between these two very different allocations. On a year-by-year comparison of the two funds we see a trend. During the two negative years of this fifteen period, I charted the absolute value to better show that trend. Also, compare the absolute values of the returns in 2008 and 2009. The collapse and bounce back was about the same level.

VWELX-VWINXComp

During this fifteen year period, the cautious mix earned 88 cents to the $1 earned by the slightly aggressive mix. Looking back thirty years, cautious made only 75 cents. In the past fifteen years, the difference between positive and negative years was important. In good years, cautious earned 20 cents less. But in negative years, like 2002 and 2008, cautious made 73 cents more by losing that much less.

////////////////////////

Personal Saving Rate

The savings rate is near all-time lows. We’ve seen a similar lack of caution in 2000 and 2006. As housing and equities rise, families may count those gains in their mental piggy bank. Asset gains are not savings. Asset prices, particularly equities, will decline during a recession. Jobs are lost. Without an adequate financial cushion, families struggle to weather the downturn. The rise in bankruptcies and foreclosures further exacerbates the downturn.
SavingsRate1998-2017

///////////////////////////////

Annuity

A good explanation of the various types of annuities.  The graphics that the author presents might help some readers understand the role of annuities, and the advantages of deferred vs. immediate annuitues.  I have also posted this on the Tools page for future reference.

http://www.theretirementcafe.com/2017/11/income-annuities-immediate-and-deferred.html

Saving Trends

May 1, 2016

Macroeconomists define saving as Income Less Consumption and Taxes.  There are two distinctions – public, or government savings, and private, or household, savings.

From 1986 to 2000 inclusive, a 15 year period, gross private savings grew 78%.  In the same length of time, from 2001 to 2015, it grew 112%.  So why the higher savings rate?

Lower interest and inflation rates have persisted during this later period.  One would think that consumers would be more likely to save when interest rates were higher in the earlier period.  However, the reverse is true.  Households respond to lower interest rates by saving even more.  Why?  Because their savings will grow more slowly at lower interest rates, they must save more, which only keeps interest rates low.  Like so much of human activity, the process is self-reinforcing.

What else contributes to higher savings rates?  80 million Baby Boomers is more than a third of the population.  As they neared retirement age, they saved more of their income.  In 2012, the first boomers turned 66, a high point in the chart of savings below.

Richard Koo is the chief economist at Nomura, a gigantic Japanese financial holding company similar to Goldman Sachs.  He introduced the idea of a balance sheet recession instigated by a large number of people and businesses paying down their debts to repair their balance sheets.  Here is a recent paper.

Because trends in savings are affected by the decisions of mutiple generations, the primary causes can be difficult to establish.  As the Boomers begin to spend down their savings in retirement, the equally large Millennial generation will start saving but it is unlikely that they will completely offset the spending rate of the Boomers.  The glut of savings will be slowly draw down until new investment puts enough demand for savings, which will spur interest rates higher.

///////////////////

Cadillac Purchasing Power

Last week, I looked at the relative purchasing power to buy a Ford F-150 pickup.  In a trip to a car museum lately, I learned that a new 4 door Cadillac model cost $2000 in 1913.  The average hourly wage was $2 per hour per the NBER, so it took the average person 1000 work hours, about half a year, to buy that Cadillac.  A 2016 Cadillac 4 door ATS Sedan costs about $40,000, an amount that would take 1573 hours, about nine months, at an average $25.43 per hour (BLS).

//////////////////

College Bound

A recent BLS study found that 70% of 2015 HS grads enrolled in college.  Recent NAEP results show that only 37% of test takers are prepared for college reading and math.

//////////////////

Investment, Savings and Income

August 18th, 2013

Gross Private Domestic Investment (GPDI) consists of capital spending on factories and equipment, improvements in rental properties, and changes in inventory.  Changes in GPDI reflect expectations by the business community.  Companies and landlords continue to increase investment after the precipitous fall of 2008.  Below is the long term view.

Let’s zoom in on the past five years to show some comparisons.  In 2010 there was a slight decline in investment.  In 2011 and 2012 came short periods of a levelling off of investment.  So far this year, the trend is upward.

l

Declines in investment accompany recessions but do not consistently precede recessions.  However, declines in the year over year (y-o-y) percent change do signal an aggregate caution among businesses.  The attentive investor would do well to notice these signals.  Investment growth remains positive.

Percentage changes in investment and the market loosely track each other, as we can see below.  Both investment and the market ride on anticipation of future business conditions but the market reacts and overreacts much more than investment. I dampened the percent change of the market to show a bit more clearly both the correlation and the divergences.

The y-o-y gain in investment has been positive since the latter part of 2009, indicating that business owners and managers have enough confidence in future business to increase their investment. A key component of the business landscape is the willingness of consumers to buy.  This past Tuesday came the monthly report on Retail Sales showing a .2% monthly gain for total retail sales, including food services.  At an annualized growth rate of 2.4%, sales  are positive but annualized gains of 3% or more would indicate strong consumer demand.  So far this year, earlier forecasts of negative real retail sales growth in response to sequestration policies have proved unfounded.  Below I’ve excluded the food services component which accounts for approximately 10% of retail sales.

When we look at retail sales as a percent of GDP, the total economic activity of the country, retail sales excluding food is still below 20 year averages.

Adjusting for inflation and population, we can see that it is food services that continues to show strong growth over a two decade period.  While the recession put a dent in that growth, it is more than 25% higher than it was two decades ago.

Each month the U. Of Michigan releases a consumer sentiment survey.  This past Friday’s report showed a surprising fall in sentiment from 85 to 80.

In the U.S. we can take a rough reading of the willingness of consumers to spend by looking at savings patterns – we don’t save as much.

We are down below a 5% savings rate again, indicating that people are confident enough to spend most of their income.  That is one reading.  Another is that many households have responded to the increase in the Social Security tax this year by reducing their savings.  The lack of savings by Americans has a long history.  Before the Social Security Act was passed in the 1930s, George Washington Carver wrote: “We have become ninety-nine percent money mad. The method of living at home modestly and within our income, laying a little by systematically for the proverbial rainy day which is due to come, can almost be listed among the lost arts. ”  Perhaps that is why some felt that Americans had to be put on a mandatory retirement program called Social Security.

The upward spike in savings at the end of 2012 has been attributed to higher dividend payouts and bonuses in anticipation of the “Fiscal Cliff” in 2013.  Per capita Disposable Personal Income continues its subdued but steady march upward, also rising dramatically in the last part of 2012 as a one time anomaly before the onset of higher taxes and sequestration.

On an inflation-adjusted basis, we are 10% higher than we were ten years ago.

But a longer term picture is a bit more sobering.  The decades longs rising trend of real income has clearly plateaued since the recession began at the end of 2007, over five years ago.

The recession has been a sobering experience for everyone, including the business community. While the growth signs are mildly positive, an underlying watchfulness seems to be the order of the day.