by Steve Stofka
December 3, 2017
What can I expect from my portfolio mix? Portfolio Visualizer has a free tool to analyze an asset mix. We can also get a quick approximation by looking at a fund with that mix.
An investor with a 40/60 stock/bond mix might go to the performance page of Vanguard’s Wellesley Income fund VWINX. It’s 50-year return is close to 10% but that includes the heady days of the 1970s and early 1980s when both interest rates and inflation were high. The ten-year performance of this fund includes the financial crisis and is close to 7%.
An investor with a slightly aggressive 65/35 stock bond mix could look to Vanguard’s Wellington Fund VWELX, which has a similar weighting. It’s 90-year return is 8.3% but that includes the Great Depression and WW2. It’s 10-year return is – wait for it – close to 7%.
Two funds – a conservative 40/60 and a slightly aggressive 65/35 – both had the same ten-year returns. All it took was one bad year in the stock market – 2008 – to even up the returns between these two very different allocations. On a year-by-year comparison of the two funds we see a trend. During the two negative years of this fifteen period, I charted the absolute value to better show that trend. Also, compare the absolute values of the returns in 2008 and 2009. The collapse and bounce back was about the same level.
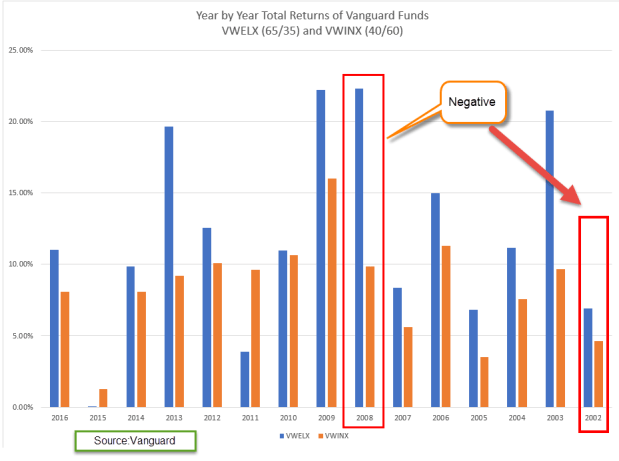
During this fifteen year period, the cautious mix earned 88 cents to the $1 earned by the slightly aggressive mix. Looking back thirty years, cautious made only 75 cents. In the past fifteen years, the difference between positive and negative years was important. In good years, cautious earned 20 cents less. But in negative years, like 2002 and 2008, cautious made 73 cents more by losing that much less.
////////////////////////
Personal Saving Rate
The savings rate is near all-time lows. We’ve seen a similar lack of caution in 2000 and 2006. As housing and equities rise, families may count those gains in their mental piggy bank. Asset gains are not savings. Asset prices, particularly equities, will decline during a recession. Jobs are lost. Without an adequate financial cushion, families struggle to weather the downturn. The rise in bankruptcies and foreclosures further exacerbates the downturn.

///////////////////////////////
Annuity
A good explanation of the various types of annuities. The graphics that the author presents might help some readers understand the role of annuities, and the advantages of deferred vs. immediate annuitues. I have also posted this on the Tools page for future reference.
http://www.theretirementcafe.com/2017/11/income-annuities-immediate-and-deferred.html
