July 13, 2025
by Stephen Stofka
Sunday morning and another breakfast with the boys as they discuss world events and persistent problems. The conversations are voiced by Abel, a Wilsonian with a faith that government can ameliorate social and economic injustices to improve society’s welfare, and Cain, who believes that individual autonomy, the free market and the price system promote the greatest good.
Abel sat back in his seat as the busser poured some coffee. “I wonder how much Trump’s tariffs on Brazil will raise coffee prices.”
Cain waited a moment until the busser left. “I wish Senate Republicans would challenge him on that. I mean, we export more to Brazil than we import. Congress just cowers in the corner while Trump engages in all these petty political vendettas.”
As soon as the busser left, the waitress arrived to take their orders. Abel tucked his table napkin into his belt. “A few weeks ago, we were talking about inequality before and after taxes. Last week, Paul Krugman wrote about the growing inequality since the 1980s. He mentioned a paper where the authors recommended a 73% top marginal income tax rate, more like the rates this country had in the period after World War 2 (Source). There was more equality, and we paid down the war debt.”
Cain tilted his head slightly. “An accountant will tell you that it’s the effective tax rate that counts more than the marginal rate. That’s the bottom line. So, in the 1950s and 1960s, there were high marginal tax rates, but the rich had so many tax write-offs available to them that it reduced their effective tax rate to about 30 – 35% (Source).”
Abel argued, “Well, that’s still higher than the current effective rate, about 25% (Source). I mean, back in 1980, the top 1% got about 10% of all the income in the country. Now, they get like 20% (Source, Slide 11).”
Cain raised his eyebrows. “And how much has their share of taxes gone up? The Tax Foundation analyzed income tax data from the IRS for 2022. The top 1% had 22% of adjusted gross income but paid 40% of income taxes. The bottom 50% had 10% of the income but paid only 3% of the tax (Source). So, the top half are paying almost all of the income tax burden but liberals like AOC and Bernie Sanders don’t think they are paying their ‘fair share.’”
Abel argued, “Well, the earned income tax is a refund of taxes to those families in the bottom 10%. That distorts the figure for the lower half of incomes. I’ll bet if the earned income tax credit were excluded the bottom half pay a lot more than 3%.”
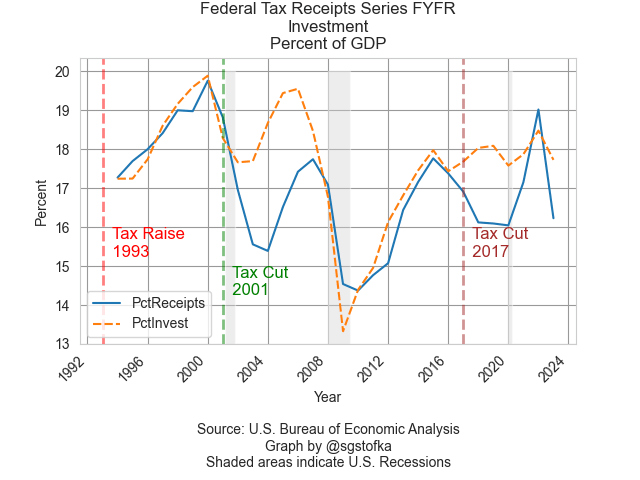
Cain shook his head. “The credit is about 2% of income taxes collected (Source). That will make only a slight difference in the percentages. The fact remains that the top half are carrying all of the burden already. And another thing. The federal government collected 20% of GDP in 2022. That’s already more than 10% above the long-term average. The government is already taking a big chunk of taxpayer money and still running up big deficits. The problem is spending, not taxes.”
Abel rolled his eyes. “The problem is inequality. Higher taxes help tackle that problem.”
Cain shook his head. “Economic growth and higher productivity helps tackle the problem. Hey, change of subject. I wanted to ask you about the abortion decision by the Wisconsin Supreme Court a few weeks ago. Did you have a chance to dig into that?”
Abel looked into the distance as he tried to recall. “Oh, yeah. That state’s Supreme Court held that an 1849 law banning abortion had been implicitly repealed by subsequent laws. I had never heard of ‘implied repeal’ of a law. It’s when a legislature doesn’t expressly repeal a law but passes a number of laws afterward that can only be valid if the first law is assumed to be void. Therefore, an implicit repeal.”
Cain smirked. “Declaring a law void seems to me like the judiciary was overstepping its bounds.”
Abel nodded. “It was a 4-3 decision and boy, the dissent from the conservative minority made that point very passionately. The majority used a 1941 decision from that same court and, wait, I’ve got it here. Back in 1941, the court said that it had a duty to treat conflicts in separate laws as though both were operative, ‘if possible.’ Note the ‘if possible’ part. So that court stressed that implied repeals should only be recognized, another quote, ‘when the intent of the legislature clearly appears’ (Source).”
Cain sighed. “Let me guess. The conservatives didn’t think that the subsequent laws demonstrated the clear intent of the legislature.”
Abel shrugged. “Right. Those subsequent laws were passed after Roe v Wade. So, of course, the legislature treated the 1849 law as moot because the Roe decision said those abortion laws were unconstitutional. Would those laws have been passed if the Roe decision had not been handed down? Like so many things in this life, it’s not so clear.”
Cain frowned. “The Roe decision sparked a resistance movement among conservatives. A decade later, John Leo founded the Federalist Society (Source). To the conservative justices on the Wisconsin Supreme Court, the Dobbs decision to overturn Roe basically invalidated, or lessened the significance of those laws passed after Roe.”
Abel said, “The majority quoted a Pro Publica article that sepsis cases were up 50% since Texas outlawed abortion after Dobbs. Maternal deaths were up by a third (Source). So the majority was also considering the consequences of their decision. A few weeks ago, I was talking about Justice Breyer’s book Reading the Constitution. He wrote about the struggle in judicial interpretation. Rules or values. Breyer chose values. Conservatives prefer rules. Breyer would consider whether the consequences of a decision undermined the values a law protected. Conservatives preferred rules with less regard for consequences. Breyer and Scalia would often debate in public on these types of interpretation.”
Cain smirked. “In last year’s presidential immunity cases, the conservatives were all about consequences. In oral arguments, Gorsuch said he was looking past the actions of Trump because the court was writing ‘a rule for the ages’ (Source). What pomposity. Like they were handing down the Ten Commandments.”
Abel rolled his eyes. “Yes, but only conservative decisions are rules for the ages. Apparently not the Roe or Casey decisions that validated a right to have an abortion. Not guns laws or campaign finance laws. These conservative justices demonstrate such a lack of consistency and clarity in their decisions. Anyway, I wanted to get your feedback on the Big Bogus Bill, as you call it.”
Cain replied, “Well, I hate this kind of legislation no matter which party pushes it through. Reconciliation bills are a grab bag of legislative candy. Who invented the reconciliation process? Democrats, of course. My biggest objection is that the bill increases the deficit when the economy is good.”
Abel interrupted, “The federal debt gets larger every year, the rich buy that debt, and the federal government pays those rich people interest on the money it didn’t tax them. It’s a reverse tax, like an unearned income tax credit for rich people.”
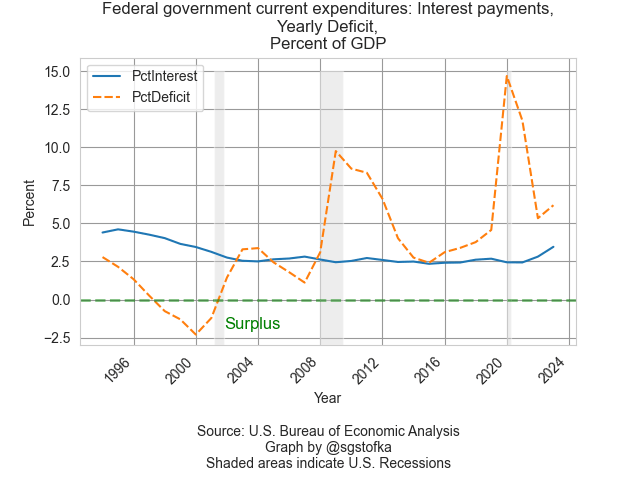
Cain smiled. “That’s one way of looking at it. But remember that, when Trump left office in 2020, the interest on the debt was 15 cents for every dollar the federal government collected. When Biden left in 2024, it was 22 cents of every dollar (Source).”
Abel argued, “Well, the interest on the debt was relatively a lot worse under Reagan, Bush and most of Clinton’s term. What’s happened since then? Twenty years ago, Republicans started giving away tax cuts to rich people.”
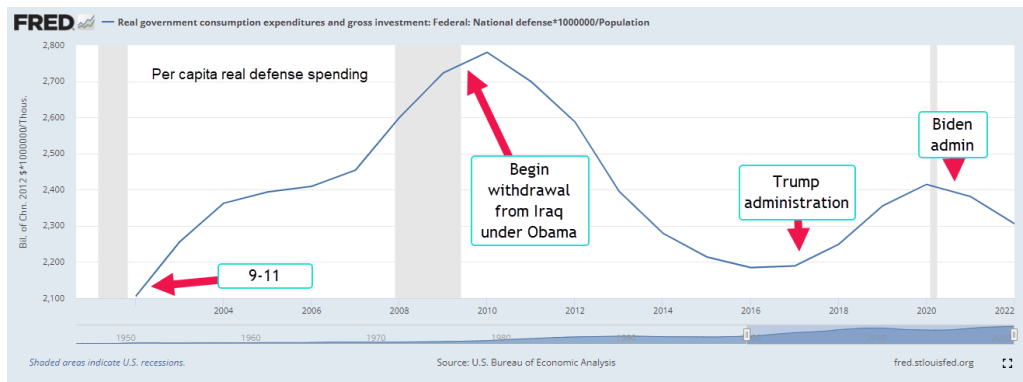
Cain replied, “Whoa, there, pardner. All the entitlement programs that liberals passed have been the main contributor to the debt, if you ask me. We talked about this last week. Medicaid spending is up to a trillion by now. That’s more than 3% of the country’s GDP. In 1990, we spent five times as much on defense as on Medicaid. Now they are almost equal (Source). This country needs to have a conversation about our priorities.”
Abel sighed. “Health care is an implied right. Life, liberty and the pursuit of happiness is not possible without health care.”
Cain argued, “Defense is an explicit right. The founders stated that in the first sentence of the Constitution (Source).”
Abel interrupted, “And the general welfare was in that same sentence. Health care is a key component of the general welfare.”
Cain shook his head. “They meant the common welfare, the welfare common to everyone.”
Abel showed exasperation. “We argued about this last week and how many times before that? What does ‘general welfare’ mean? So, didn’t you like about the bill?”
Cain replied, “I thought it was dumb that they are cutting back on incentives for wind and solar energy. I’m an ‘all of the above’ guy when it comes to energy. So is Texas, a red state.”
Abel rolled his eyes. “The White House says that they are reducing energy costs by expanding fossil fuel production (Source).”
Cain smirked. “Fine, but why hobble wind and solar production? It’s stupid. It’s just vindictive politics. I’m sick of this childish shit from people who are supposed to be the leaders of this country. This is the kind of stuff kids in middle school do.”
Abel replied, “Seniors get an extra tax break. An older couple can deduct almost $48,000 (Source). According to the Census Bureau’s Supplemental Poverty Measure, 14% of seniors were poor, so this might help reduce that. Help them pay for medical expenses (Source).”
Cain shook his head. “I liked the simpler deduction in the 2017 so I’m glad they kept that. The extra deduction for seniors won’t help poorer seniors much. This deduction basically eliminates income taxes for seniors in the bottom 50% who barely pay income taxes as it is (Source). Poor seniors won’t get a refund if their taxable income is negative. It’s seniors in the top half who will benefit most from the extra deduction. This government already gives plenty to seniors. Too much, if you ask me.”
Abel asked, “Did you see anything you liked?”
Cain replied, “I like the ability to fully expense short-term capital investment. Better allowances for depreciation which is pretty high in tech industries. The Tax Foundation has an article and video explaining some of the good, bad and ugly in the bill (Source).”
Abel asked, “What about the work requirement? Like half the people who are aged 50-64 and on Medicaid are disabled (Source). Ok, maybe some can work. Can they work 20 hours a week to stay on the program? Who knows?”
Cain nodded. “I liked the discipline of it, but they went overboard. Do the states have the resources to monitor all these requirements? No. Does the law give the states some flexibility or specific funding to carry out the law? No. This is another one of those unfunded federal mandates. It’s sad to see Republicans using the Democrats’ playbook.”
Abel said, “I wish Murkowski had not buckled to pressure and just voted no on that bill. She said she didn’t like the bill but hoped that the House would change some provisions. What kind of spineless response is that? The Tax Foundation estimated that continuing these tax cuts will add $4.5 trillion to the debt over a ten-year window (Source). A bunch of old people in Congress passing laws that benefit the rich and the old, then sticking our kids with the bill.”
Cain smiled as he glanced at his watch. “That reminds me. I can’t remember whose turn it is. I got to go help my daughter with something.”
Abel replied, “Yours. Hey, I hear people like the new Superman movie. A story about someone who acts on principle rather than political expediency.”
Cain laughed as he slid out of his seat. “Most of us try to live up to our principles. Yet we have leaders who pay more attention to political expediency than principles.”
Abel looked up at Cain. “The saying goes, ‘you can’t govern if you don’t win.’ Unfortunately, our political system and news cycle focuses on the contest, the winning, rather than the principles.”
Cain nodded as he turned to leave. “Hmmm, something to think about. I’ll see you next week.”
//////////////
Image by ChatGPT