March 10, 2024
by Stephen Stofka
This week’s letter continues my analysis of the many roles of the federal government, comparing spending, tax revenues and the federal debt that has accumulated since 9-11. Governments accumulate debt by spending more than they collect in tax revenues. Farmers, businesses and households appreciate the subsidies and support from government but resist paying the taxes to fund those programs. The private marketplace depends on government funding of nascent technologies that may take decades to commercialize. Examples include the internet, the development of semiconductors, lithium batteries and the funding of pharmaceutical research. Investment in military readiness has spurred advancements in aerospace and satellite technology, the GPS that connects our phones and the Kevlar clothing that protects our soldiers and police officers. Critics may ridicule a government investment in solar manufacturer Solyndra, but it was also heavy government funding that provided the cash flow for SpaceX and Tesla.
In last week’s letter I showed that private investment and government spending and investment both averaged about 18% of GDP over the past three decades. A closer look at those two series shows how they complement and compete with each other. In the graph below, private investment dipped from 19% of GDP in 2006 to below 14% in 2009. As a percent of GDP, government spending and investment took up some of the slack.

As many people lost their jobs, they became eligible for Medicaid or food stamps. Both of these programs are included in government spending because the programs directly or indirectly provide people with goods or services. The graph above does not include increased unemployment insurance payments during the recession. These are included in government transfers since this is money, not services, transferred from the government to individuals. Policymakers refer to this combination of support programs as automatic stabilizers, providing assistance to households during hard economic times.
A recent analysis by the Congressional Budget Office (CBO) found that these automatic stabilizers were not “key drivers of debt over the long-term.” The federal debt was growing because government spending was increasing at a faster pace than revenues. The chart below shows spending and revenues for the past thirty years in a natural log form to portray the trends of change more clearly.

For most of the past three decades, revenue growth, the orange dashed line in the graph above, lagged government spending, the blue line. Note that this revenue series (FRED Series FYFR) does not include Social Security taxes. The growth in government spending showed some moderation only during Obama’s term and that was the worst time to slow the growth of government spending and investment. The Great Recession of 2007-2009 was the worst economic downturn since the 1930s Depression, surpassing the pain of the back-to-back recessions of the early 1980s.
Biden was vice-President during that recovery and was determined not to repeat that mistake in the aftermath of the Covid-19 pandemic. Although the Democratic majorities in the House and Senate were slim, unified government helped the effort to pass the Inflation Reduction Act and the CHIPS Act. Both pieces of legislation committed government funds to support investment in clean energy development and semiconductor manufacturing. Such commitment spurred private investment in the energy industry. In 2023 field production of crude oil surpassed 2019 levels, according to the Energy Information Administration (EIA). They report that natural gas output was up 2% in the first year of Biden’s term, then accelerated to 5% growth in 2022 and 2023 following Russia’s attack on Ukraine.
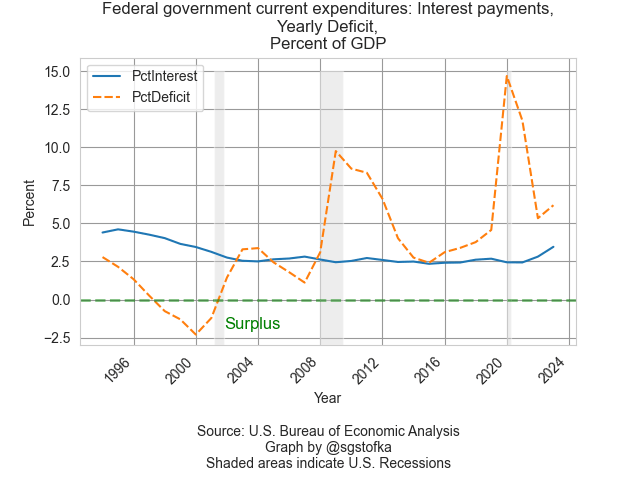
Despite big increases in the deficit after 9-11, and an accumulated debt of $22 trillion held by the public, the interest share of GDP has remained below the levels of the 1990s. In 2001, China was admitted into the World Trade Organization. As imports from China increased, we paid for them with U.S. Treasury debt, helping to keep interest rates low for most of the past two decades.
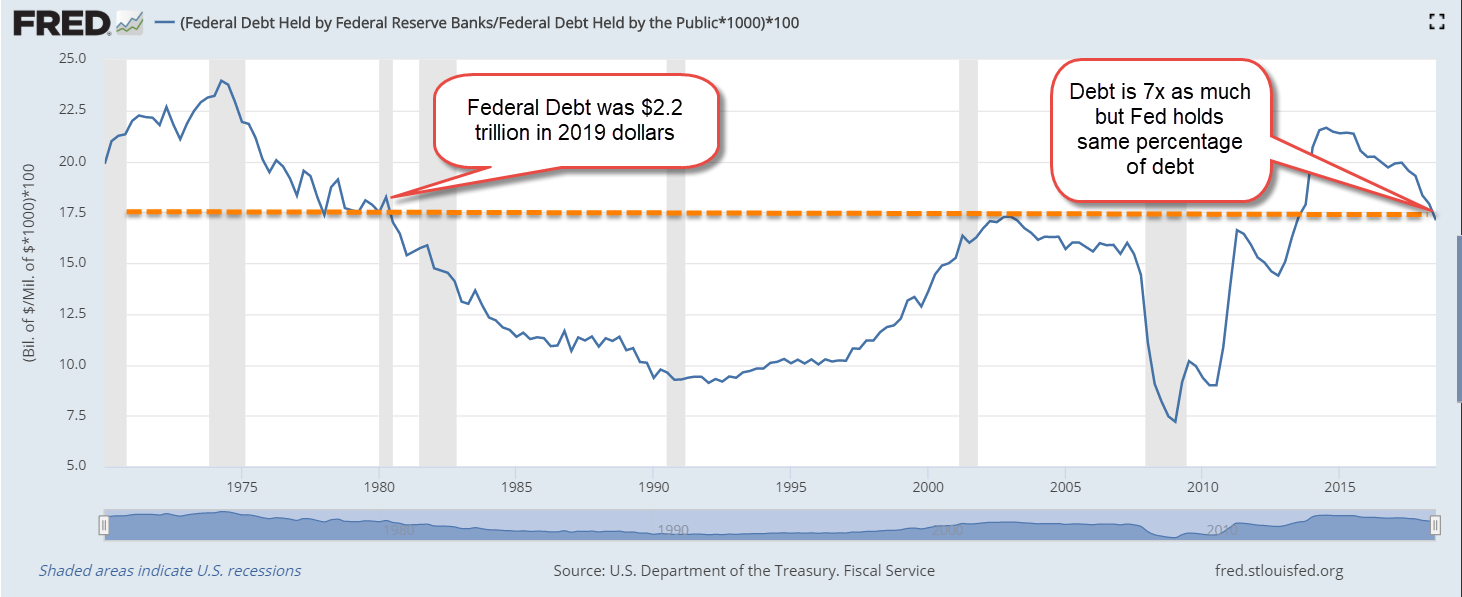
Unlike individuals and corporations, governments can buy their own debt. Unless a majority of that debt is sold in the private marketplace, there is no independent evaluation of the creditworthiness of that debt. At the end of last year, 65% of the total Federal debt was privately held, the highest percentage since 1997 (see notes). Including the Treasuries held by independent Federal Reserve banks, the percentage is close to 80%. A recent report from the Center for Strategic and International Studies (CSIS) calculates the percentage of debt held by two of our largest trading partners, China and Japan, at 5.8%. The wide ownership of U.S. debt validates it as a low-risk financial instrument.
The global financial system depends on tradeable sound securities. When the financial crisis undermined confidence in mortgage securities, private investment declined sharply, and it would do so again if investors doubted the soundness of Treasury securities. The recent CBO report points out a weakness in public policy that the Congress must resolve or risk damaging the credit of U.S. securities. 1997 was the last year when Congress submitted a budget by the deadline, according to the Congressional Research Service. When is the moment when the private debt market loses hope that Congress can match its spending and revenues? No one can forecast a stampede to safety but in hindsight many will claim to have seen the exit signs.
///////////
Photo by Manki Kim on Unsplash
Keywords: investment, debt, interest, Treasuries, government spending, taxes, automatic stabilizers
According the March 2024 Treasury bulletin, total Federal debt was $34 trillion. $21.7 trillion was privately held – about 65%. See Table OFS-2 of the March bulletin. Privately held debt plus $5.2 trillion of Treasuries held by independent Federal Reserve banks constitute Federal Debt Held by the Public (FRED Series FYGFDPUN) and is close to 80% of total federal debt. For a thirty-year series of the public’s portion of total debt, see https://fred.stlouisfed.org/graph/?g=1hYFV. Until the 2008 financial crisis Federal Reserve banks held less than 10% of total debt. During the pandemic, that share rose to 21%. At the end of 2023, the share was 15.4%.