OK, you’ve just finished your winter book project, War and Peace, and now you’d like something not quite as long. How about a 100 year history of consumer spending? This 69 (PDF) page report has lots of easily understood graphs and brief summaries of the economic household picture at selected periods during the last century.
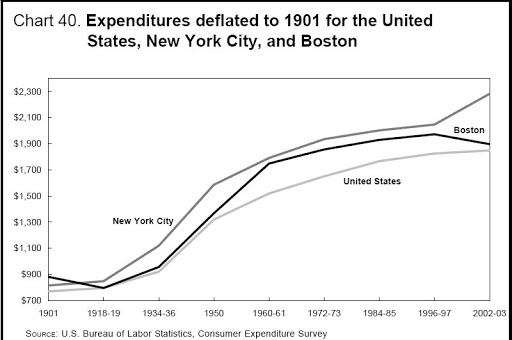
Most revealing are the 100 year trend graphs near the end of the report. In chart 40 on (PDF) page 64,
 we can see the century long rise of consumer spending in real 1901 dollars despite the fact that food, clothing and housing expenses take up far less of our income today. What are we spending our money on? Chart 43 on (PDF) page 67 shows the share of income that the average household spends on non-necessities, from a low of less than 25% in 1900 to 50% today.
While the percentage of income for most categories of spending have changed, there is one expense that has changed little during the past 100 years: entertainment. Those expenses have decreased only slighty, taking up just over 5% of the average household income.
The last page of the report summarizes the century’s changes in discretionary spending: ” households throughout the country have purchased computers, televisions, iPods,DVD players, vacation homes, boats, planes, and recreational vehicles. They have sent their children to summer camps; contributed to retirement and pension funds; attended theatrical and musical performances and sporting events; joined health, country, and yacht clubs; and taken domestic and foreign vacation excursions. These items, which were unknown and undreamt of a century ago, are tangible proof that U.S. households today enjoy a higher standard of living.”
It is doubtful that we will enjoy an increase in discretionary spending as dramatic as the last 100 years. Chart 43 on (PDF) page 67 shows the leveling that has happened over the past 25 years.

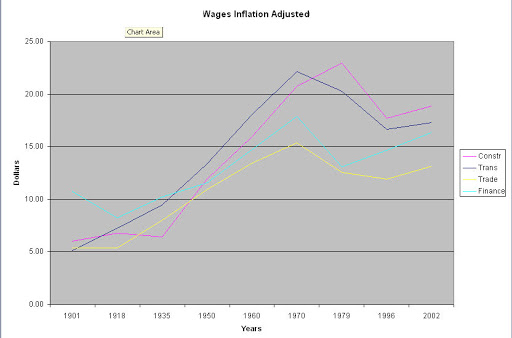
A comparison of a century’s worth of income data shown in Table 27, (PDF) page 56, reveals that there has been dramatic changes in income for the working person. In 1935, the average manufacturing wage was 58 cents an hour, or $7.62 in 2002 dollars. Real manufacturing wages have doubled in 80 years. Real construction wages ($.49 in 1935 = $6.39 in 2002) have tripled in that same time. In the finance and insurance industry, wages have seen the smallest increase in real terms but even those have swelled by 60%. However, after adjusting the wage data in Table 27 for inflation reveals that real wages have decreased in the past 30 years. The boom happened a long time ago.
Accompanied by that dramatic rise in real discretionary income has come the explosive rise of advertising dollars aimed at enticing us to part with that extra income on new cars, electronics, service contracts for cell phones and internet and cable service that we simply can’t do without. In short, the average American household has been sold the idea that these non-essential items are, in fact, necessary.
As noted earlier, the growth in discretionary income as a percentage of total income has slowed, leveling at about 50%. Wages have declined for more than a generation. Until there is some increase in real wages or the invention of a Star Trek like Replicator machine, the proportion of discretionary income will probably remain stagnant and households will continue to tighten their belts.
