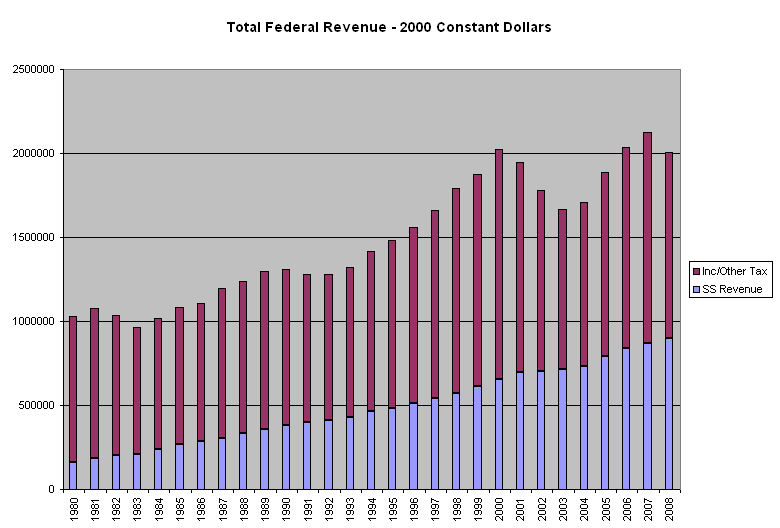
Yesterday I looked at the increasing share of Federal revenue that comes from Social Security and Medicare taxes. The chart below shows total Federal revenues broken into two components, Social Security/Medicare taxes and all other taxes, most of which are personal and corporate income taxes. (Click graph for larger image)
Today I’ll look at taxes and GDP, or Gross Domestic Product. The chart below shows Federal revenues less Social Security and Medicare taxes as a percentage of GDP. (Click graph for larger image)

In 1980, Ronald Reagan led a campaign to reduce the 1980 17% tax bite. In each year in the late 70s, the Social Security trust fund had run a deficit, which prompted a series of Congressional increases in Social Security taxes. From 1977 to 1987, the social security tax increased 23% while the Medicare tax increased a whopping 62%.
In 1986, the first of the baby boomers turned 40, entering their peak earning years. As the income of boomers grew, so too did Social Security and Medicare revenues.
The chart below shows federal revenues as a percentage of GDP. (Click graph for larger image)
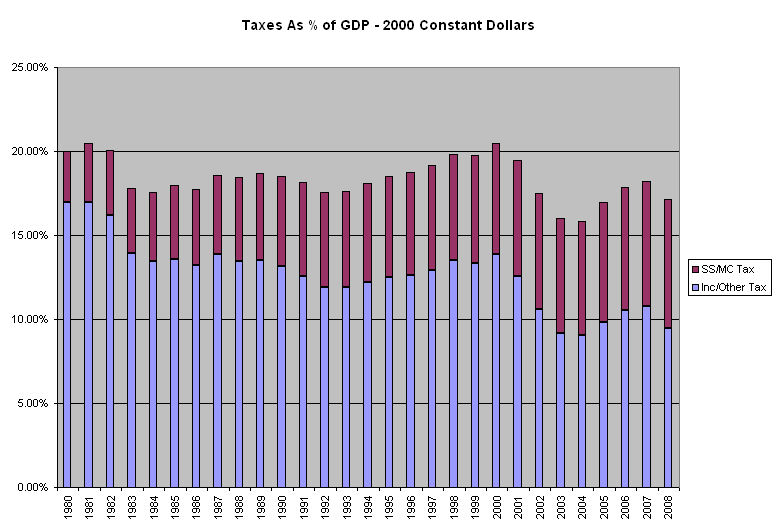
Note again the increasing percentage of taxes that comes from Social Security and Medicare. Instead of investing Social Security taxes to pay the future benefits of the boomer generation, politicians of both parties used the taxes to offset declining income tax revenues. Conservative politicians campaigned on lowering taxes while liberal politicians campaigned on offering more programs.
To this day, conservative politicians repeat their mantra that lowering tax rates produces greater tax revenues. The data simply does not support that contention.
Liberal politicians continue to dream up new programs to fix another of society’s needs. To this day, liberal politicians avoid the fact that the only way to fund more programs is to increase taxes on some segment of the population. President Obama ran for office promising to increase taxes on a relatively small segment of the population, the “fat cats” making more than $250K per year. Eventually he – and we – will find that there aren’t enough fat cats in the country to pay enough additional taxes for his proposed programs.
As the chart above shows, we cannot run a country by collecting only 10% of GDP in income and miscellaneous taxes without running ever larger deficits. Several weeks ago, the rating agency Moody’s anticipated the possibility of downgrading U.S. Treasury bonds from AAA status by the end of the coming decade unless we make some changes in our deficit. Such a downgrade would increase the cost of borrowing, adding significantly to the interest we pay each year on our national debt.
