May 19th, 2013
During the past several years, a demographic and economic shift crossed below the zero line. For decades, Social Security taxes collected exceeded Social Security benefits paid. The Federal Government “borrowed” this excess and used it for other programs. Since 2010, there has been nothing to borrow. The Social Security Administration (SSA) has several sources of revenue, but the bulk of its revenues is what we commonly call the Social Security tax, or FICA. However, this tax has several components. The largest portion of the tax – the Old Age and Survivors Insurance tax (OASI) – is to pay out social security benefits and it is this component I wanted to look at. SSA gives a pie chart of its revenue and benefits paid.
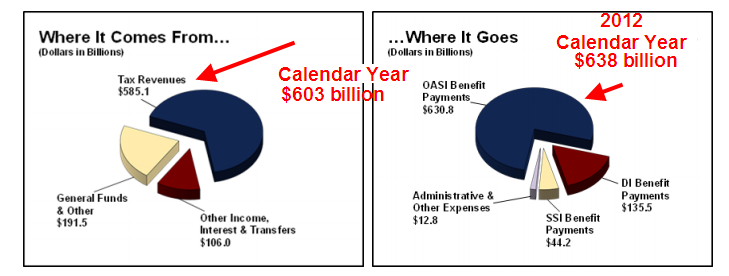
I have shown the latest revisions to the pie chart but it gives you a sense of the revenue and expense components. A table of SSA income and outgo shows only the total receipts and expenditures. When we look at the OASI component, we can get a sense of the upcoming political debates and financial pressures. SS benefits paid are already exceeding OASI tax receipts. Below is a chart of SSA data showing the surplus and deficit for the past ten years.

On January 1st, the Congress let lapse the 2% reduction in payroll taxes. In the first quarter of 2013, that has meant an additional $245 billion in revenue to the Treasury. (Source). Since the money all goes into the same Federal pot, the additional revenue has forestalled the debt limit debate till this fall.

The SSA records other income, including income taxes on the SS benefits paid out. This is a “pencil” income entry: the IRS keeps track of taxes paid on SS benefits and “transfers” them to the SSA. For decades, this pencil entry has increased the SS surplus and Congress borrowed it. The SSA charges interest income to the Federal government and records this pencil income as more money that the Federal government owes the SS trust funds.
The bottom line is that SS is a “pay go” system. Current taxes pay for current benefits. When benefits exceed the taxes devoted to pay for those benefits, the money has to come from somewhere. That “somewhere” is the Federal government, but it can only get those funds from you and I and the companies who pay corporate taxes. More troubling is the ever increasing percentage of federal tax receipts devoted to paying social benefits of one form or another. These include, SS, Disability, SSI, TANF, SNAP and a host of other programs.

As people become increasingly dependent on the government for their welfare, they will put increasing pressure on politicians to maintain or increase these benefits. This political pressure only heats up the political debate over how to pay for these benefits. At the federal level, benefits have increased by $800 billion over the last ten years.
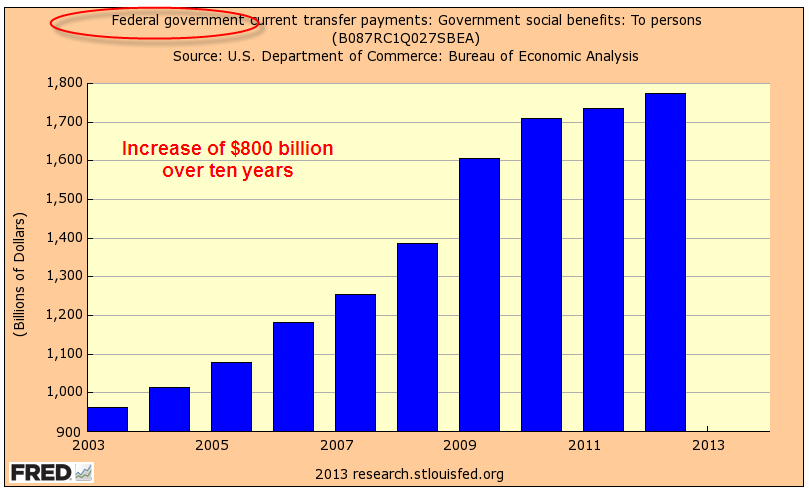
Including the states and local governments, the increase is over $1 trillion.

Any cuts in calculating benefits are met with a firestorm of protest from those who are, or will, collect those benefits. Few care about the accuracy of calculating cost of living adjustments to these benefits. Whatever calculation provides the best benefit becomes the most “accurate” calculation. The current debate is whether to use the CPI or what is called a Chained CPI. Over several decades, the CPI gives the most increase in benefits.
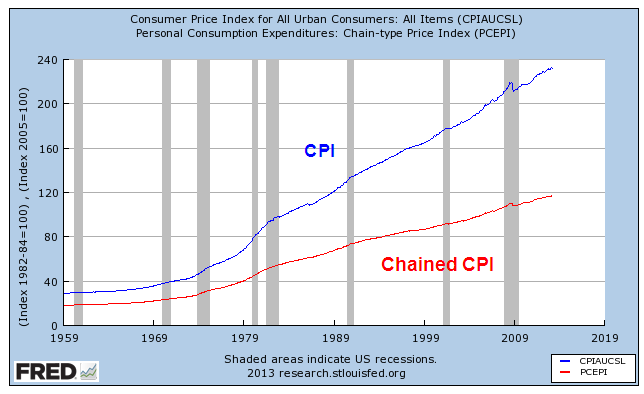
40% of the calculation of the CPI is housing cost and the calculation of that cost, called Owner’s Equivalent Rent, has almost tripled in the past thirty years, boosting the CPI.

Census data shows that 2/3rds of the 132 million households in this country own their homes. Before the housing boom, a primary reason for owning a home was to lock in a monthly payment, avoiding rent increases. Taxes, upkeep, and energy costs do go up, but the majority of a house expense, the mortage payment, is a fixed cost for many homeowners. However, the Bureau of Labor Statistics, which compiles the CPI, calculates the housing component of the CPI as though a homeowner was renting from herself.

“according to the National Association of Realtors, between 1983 and 2007 the monthly principal and interest payment required to purchase a median-priced existing home in the United States rose by 79 percent, much less than the rental equivalence increase of 140 percent over that same period.” (BLS Source)
We will continue to have a lively debate over the calculation of the CPI because it influences millions of Social Security checks each month. We can anticipate that this debate will be at the forefront of the upcoming 2014 elections. Why? Because the debate stirs passions on both sides and that is what politicians need – passion. Passion provokes people to vote. Passion promotes donations. Passion ignites political volunteer efforts.
The trend of worsening deficits between SS contributions and the benefits paid will only worsen as we get into the latter half of the decade. Before the 2010 elections, we were treated to the spectacle of angry old people – without makeup – yelling at politicians to keep their stinkin’ government hands off their Medicare, itself a government program. In the upcoming years, the debates over Social Security will make those earlier demonstrations seem rather mild. Old people vote. Angry old people vote a lot.

Steve, in reference to CPI, you showed that about two-thirds of the general population are homeowners. Do you know if there any of those statistics for benefit-eligible people only? (As people age, they sometimes need to downsize to apartments, or move into assisted living or nursing homes where costs are anything but fixed.) Regardless of which way we calculate CPI, you have shown so well in your blogs that the money needs to come from somewhere, and that it will become increasingly difficult over the years for the remaining workforce to continue to provide these benefits.
LikeLike
Anon, There is a CPI for elderly people called the CPI-E. For the past ten years there has been an increasing push to adopt this index for adjustments to SS benefits, which would increase SS benefits. The housing component of the regular CPI is about 40%. In the elderly index housing is almost 50%. This is a good subject for the next blog.
Steve
LikeLike
Also, an Employee Benefit Research Institute survey found that over 80% of 65 year olds own their own home but that homeownership declines rapidly after 75. (https://ebriorg.wordpress.com/tag/elderly-home-ownership/)
LikeLike
Steve, thanks so much for your info. I wonder whether we will someday see Social Security benefits tiered monetarily according to age, unless an eligible person can show cause to get funds earlier. Anyway, looking forward to your next blog!
LikeLike