September 18, 2016
This week I’ll cover several topics, most of them concerning personal finances.
Social Security and COLA
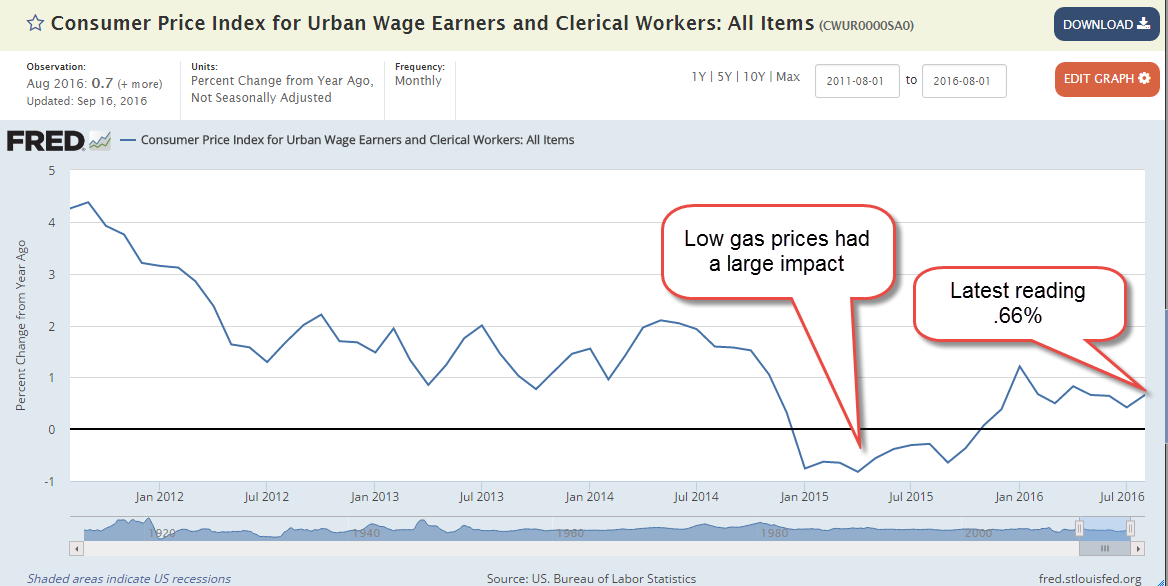
Sometime in mid-October the Social Security Administration (SSA) will announce the cost-of-living adjustment (COLA) for social security benefits in 2017 and it will probably be less than 1% (History of previous COLA adjustments). The COLA is based on the year-over-year increase in the Consumer Price Index (CPI). In 1982, Congress specified that the SSA use the CPI version for urban workers, called CPI-W. (Info from SSA). Each month the BLS releases their estimate of inflation, and this week they published their calculation for August – a yearly increase of just .66%. September’s inflation number may be slightly different but the reality for the average SS recipient is a monthly increase of less than $10 in the average benefit of $1340.
Gas prices fall
For years senior advocacy groups like AARP have argued that a different CPI measure should be used to calculate the COLA. The alternative measure, the CPI-E, puts more weight on health care expenses and less weight on gasoline and transportation costs because seniors don’t drive as much. So far, Congress has not adopted any changes to the methodology of calculating inflation for retirees.
In late 2014 gasoline prices began to fall and this had a significant impact on measured inflation in 2015, as we can see in the chart below. Although gas prices remain low, they have stabilized so that they will have less of an impact on yearly inflation growth in the future.
Reaching For Yield
Investors who are reliant on the income from their investments, including giant pension and endowment funds, typically desire fairly safe investments that will give them a decent return while preserving their principle. These include high grade corporate bonds (Johnson and Johnson, for example), Treasury bonds, CDs and savings accounts. Abnormally low interest rates have made those traditional investment choices less desirable.
Like a stream diverted, investors have wandered to riskier assets, bidding up the prices of stocks which are considered more likely to retain their value because they pay dividends.
Dividend ETFs
As one example, Vanguard’s VIG is a Dividend Appeciation ETF containing of stocks that have a consistent record of dividend growth of almost 5% per year. The growth rate is 5%, not the dividend yield. The companies in this basket are household names: Johnson and Johnson, Microsoft, Pepsi, McDonald’s, and Walgreens, to name a few. Vanguard has an added benefit: a very low expense ratio. At the end of August, the Price-Earnings (P/E) ratio on this basket of stocks was 24.5 (see here). In the first two weeks of September, the prospect of an interest rate hike in the next few months has put a small dent in the price, and lowered the PE ratio slightly. Clearly, investors are willing to pay extra for income, and extra for reliability. The yield on this basket of reliability is 2.1%, just .4% more than a 10 year Treasury.
DVY
iShares’ DVY is a popular dividend ETF that has a less selective basket of stocks. This basket also includes oil and energy companies that have a 5 year record of paying dividends but may not have a consistent record of dividend growth because of declining oil prices. Because the criteria is less restrictive, this ETF is cheaper – it has a higher yield of 3.2% and a lower PE ratio of 20.8.
The Fed
After eight years of near zero interest rates, the Federal Reserve has put itself in a corner. Whatever actions or adjustments it takes must be in small increments to avoid causing a sudden repricing of the very asset prices it has helped lift by maintaining a low interest rate environment.
The financial crisis was so severe that the Fed thought it must lower rates to near zero, which choked income flows from savings. Such a policy could be justified as an emergency measure. The economy had suffered the equivalent of a heart attack and the Fed need to shock it alive. However, the recovery that followed was so weak that the Fed thought it must continue to keep rates low. After eight years of ZIRP (Zero Interest Rate Policy), the Fed finds that it has effectively been picking winners and losers. Debtors win, savers lose. The Fed was forced into the role by the inability of a bitterly divided and ineffective Congress to pass fiscal policy solutions.
To fully grasp the effects of Fed policy, let’s take a trip up into the mountains. Imagine a high mountain lake reservoir with a dam at one end to contain the water. On the mountains surrounding the lake falls snow and rain that drains into the reservoir. The dam is opened enough so that it releases a measured stream of water for users downstream. The lake is a stock. The release of water is a flow.
Now let’s say that there is a drought for a year or two. The water level in the reservoir begins to fall. The dam operators reduce the amount of water released and this has a negative impact on downstream farms and businesses who depend on the water. The price for water rises as farms and businesses bid to get more water, a simple case of supply and demand. Land, another store of value, decreases in value because the lack of adequate water has made the land less productive. Assuming the same demand, prices for produce from the land rises. This is the flow from the land, So the flow from the land rises while the stock value of the land falls. Water is a different kind of asset, a consumable. In the case of water, both the flow and the stock value rise during a drought.
Eventually the rainfall increases and the reservoir refills with water. Now the dam operators release more water and the price per unit of water naturally declines. Now the stock value and the flow value of the water have declined. A greater supply of produce leads to price declines in the flow of produce from the land, while the price of the land itself, the store of land’s value, increases in anticipation of more productivity from the land.
After the crisis is over, flows from both types of assets declines. The extra stock value of the water is transferred back to the land. The flow of water from the reservoir has been the catalyst for this transfer of value.
Let’s take this simplified situation and use it as an analogy to understand the Fed. When the Fed adjusts interest rates, it transfers a store of value from one asset class to another. (It involves a number of asset classes. I’ll keep it simple.) That’s the transfer of stock value. But there is also a raising or lowering of the price of the flows from each of those assets.
Now let’s imagine that the Fed raises interest rates by 1%, effectively opening up the dam’s sluice gates a little more. The flow of income shifts from debtors, who must pay more for borrowed money, to savers, who receive more for their savings. Debt is a store of value and this is where the transfer of value happens. New debt competes with old debt and lowers the price of existing debt, both corporate and government, so that old debt can generate the same income flows as new debt. Assets like bonds, which generate income flows at lower interest rates are now worth less. Why buy a safe bond paying 2% when I can buy a safe bond paying 3%? Dividend paying stocks are worth less unless they can realistically increase their dividend to compete with higher interest rate expectations. Buyers and sellers of these instruments adjust the prices to reflect the new expectations.
The change in flows acts as a catalyst for the transfer of the stock values between assets. When we are younger and working, we don’t pay much attention to income flows from our savings. We look at our portfolio statements, check our 401K or savings balances to see how much of a stock of assets we have built up. We measure these assets in dollars, not value and may come to think that dollars and value are the same. Income flows are measured in dollars. The stock those flows come from are measured in value. In the future, I hope to explore the ways that we try to convert value to dollars.
