January 14, 2018
by Steve Stofka
To ward off any illusions that I am an investing genius, I keep a spreadsheet summarizing the investments and cash flows of all my accounts, including savings and checking. Each year I compare my ten year returns to a simple allocation model using the free tool at Portfolio Visualizer. Below is a screen capture showing the ten-year returns for various balanced allocations during the past several years.
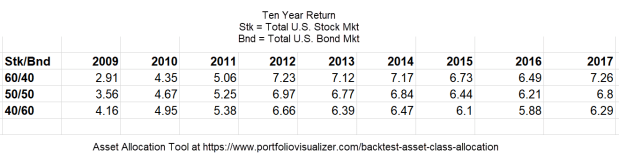
The two asset baskets are the total U.S. stock market and the total U.S. bond market. A person could closely replicate these index results with two ETFs from Vanguard: VTI and BND. Note that there is no exposure to global stocks because Portfolio Visualizer does not offer a Total World Stock Asset choice in this free tool. An investor who had invested in a world stock index (Vanguard’s VT, for example) could have increased their annual return about 1.3% using the 60/40 stock/bond mix.
I include my cash accounts to get a realistic baseline for later in life when my income needs will require that I keep a more conservative asset allocation. An asset allocation that includes 10% cash looks like this.
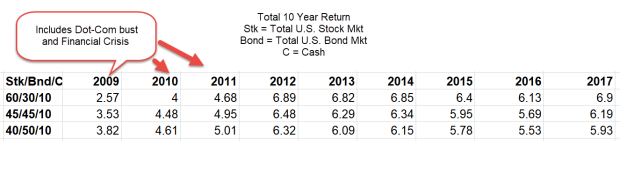
In the trade-off between return and risk, a balanced portfolio including cash earns a bit less. In 2017, the twenty-year return was not that different from the ten-year return. From 2009 through 2011, ten-year returns were impacted by two severe downturns in the stock market.
//////////////////////
The Hurt
Falling agricultural prices for seven years have put the hurt on many farmers. This decade may turn out to be as bad as the 1980s when many smaller farms went belly up because of declining prices. Remember the Farm Aid concerts?
The Bloomberg Agriculture Index has fallen about 40% over the past five years. While farmers get paid less for their produce, the companies who supply farmers with the tools and products to grow that produce are doing reasonably well. A comparison of two ETFs shows the divergence.
DBA is a basket of agricultural commodity contracts. It is down 33% over the past five years.
MOO is a basket of the stocks of leading agricultural suppliers. The five-year total return is 31%.
The large growers can afford to hedge falling prices. For family farmers, the decline in agricultural prices is a cut in pay. Imagine you were making $25 per hour at the beginning of 2017 and your employer started cutting your pay bit by bit as the year progressed? That’s what its like for many smaller farmers. They work just as hard and get paid less each year.
