April 21, 2019
by Steve Stofka
Happy Passover and Happy Easter. Now that tax day is past, let’s raise our heads and look at long-term growth trends of real, or inflation-adjusted, GDP. For the past seventy years real GDP has averaged about 3% annual growth. In the chart below, I’ve charted the annual percent change in a ten-year average of GDP (GDP10, I’ll call it). As you can see on the right side of the graph, growth has been below average for the past decade.

In 2008, growth in the GDP10 crossed below 3%. Was this due to the Financial Crisis (GFC) and the housing bust? No. The GFC barely figured into the computation of the ten-year average. The housing market had been running hot and heavy for four to five years, but this longer-term view now puts the housing boom in a new perspective: it was like lipstick on an ugly pig. Without the housing boom, the economy had been faltering at below average growth since the 1990s tech boom.
The stock market responds to trends – the past – of past output (GDP) and the estimation of future output. Let’s add a series of SP500 prices adjusted to 2012 dollars (Note #1).
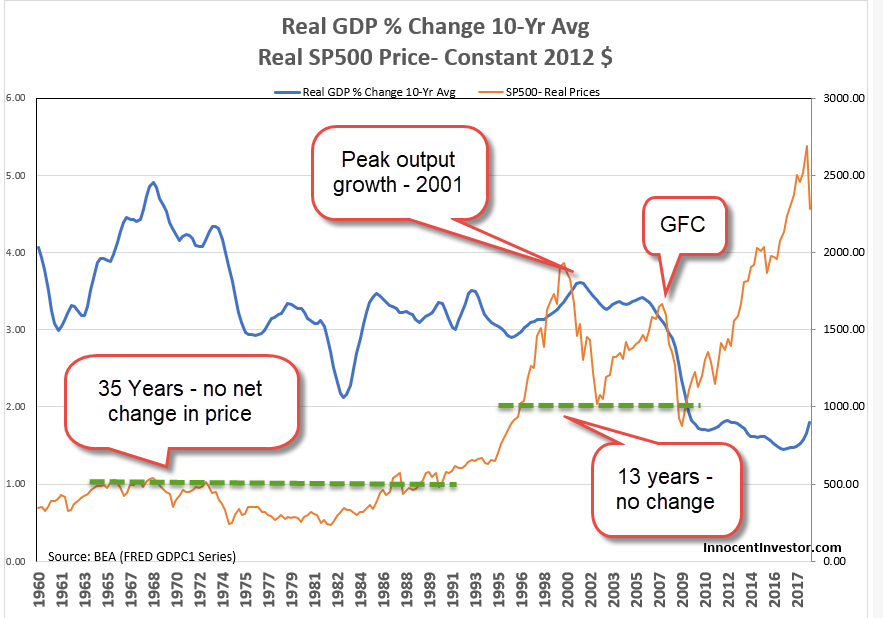
For three decades, from the late 1950s to the mid-1980s, the real prices of the SP500 had no net change. The go-go years of the 1960s raised nominal, but not real, prices. Investors shied away from stocks, as high inflation in the 1970s hobbled the ability of companies to make real profit growth that rewarded an investor’s risk exposure. From the 2nd quarter of 1973 to the 2nd quarter of 1975, real private domestic investment lost 27% (Note #2). In less than a decade, investment fell again by a crushing 21% in the years 1979 through 1982.
In the mid-1980s, investors grew more confident that the Federal Reserve understood and could control inflation and interest rates. During the next decade, investors bid up real stock prices until they doubled. In 1996, then Fed chairman Alan Greenspan noted an “irrational exuberance” in stock prices (Note #3). The “land rush” of the dot-com boom was on and, within the next five years, prices would get a lot more exuberant.
The exuberance was well deserved. With the Fed’s steady hand on the tiller of money policy, the ten-year average of GDP growth rose steadily above its century-long average of 3%. A new age of prosperity had begun. In the 1920s, investment dollars flowed into the new radio and advertising industries. In the 1990s, money flowed into the internet industry. Construction workers quit their jobs to day trade stocks. Anything less than 25% revenue growth was the “old” economy. The fledgling Amazon was born in this age and has matured into the powerhouse of many an internet investor’s dream. Thousands of other companies flamed out. Billions of investment dollars were burned.
The peak of growth in the ten-year average of GDP output came in the 1st quarter of 2001. By that time, stock prices had already begun to ease. In the next two years, real stock prices fell almost 50%, but investment fell only 12% because it was shifting to another boom in residential housing. As new homes were built and house prices rose in the 2000s, long-term output growth began to climb again.
From the first quarter of 2006 to the 3rd quarter of 2009, investment fell by a third, the greatest loss of the post-war period. In the first quarter of 2008, growth in the GDP10 fell below 3%. In mid-2009, it fell below 2%. Ten years later, it is still below 2%.
The Federal Reserve has had difficulty hitting its target of 2% inflation with the limited tools of monetary policy. There simply isn’t enough long-term growth to put upward pressure on prices. Despite the low growth, real stock prices are up 150% since the 2009 lows. A prudent investor might ask – based on what?
The supply side believers in the Trump administration and Republican Party thought that tax cuts would spur growth. In the first term of the Obama administration, believers in Keynesian counter-cyclical stimulus thought government spending would kick growth into gear. Faced with continued slow growth, each side has doubled down on their position. We need more tax cuts and less regulation, say Republicans. No, we need more infrastructure spending, Democrats counter. Neither side will give up and, in a divided Congress, there is little likelihood of forging a compromise in the next two years. The stock market may be waiting for the cavalry to ride to the rescue but there is no sign of dust on the horizon.
Economists are just as dug in their ideological foxholes. The Phillips curve, the correlation between employment and inflation, has broken down. The correlation between the money supply and inflation has also broken down. High employment but slow output growth and low inflation. Larry Summers has called it secular stagnation, a nice label with only a vague understanding of the underlying mechanism. If an economist tells you they know what’s going on, shake their hand, congratulate them and move to the other side of the room. Economists are still arguing over the underlying causes of the stagflation of the 1970s.
A year ago, I suggested a cautious stance for older investors if they needed to tap their assets for income in the next five years. The Shiller CAPE ratio, a long-term evaluation of stock prices, is at the same level as 1929. At current prices in a low growth environment, stock returns may struggle to average more than 5-6% annually over the next five years.
//////////////////////
Notes:
- Adjusted for inflation by the Federal Reserve’s preferred method, the Personal Consumption Expenditures Price Index (FRED series PCEPI). Prices do not include dividends
- Real Gross Private Domestic Investment – FRED Series GPDIC1.
- A video of the 1996 “irrational exuberance” speech
