May 19, 2019
by Steve Stofka
We are living in an economy that is fundamentally different than the ones our parents and grandparents grew up in. Some of us want a return to those days. More goods were made in the U.S.A. Each family spent more on food, clothing, furniture and the other necessities of life but the money circulated in our economy, not among the workers of Asia. Union membership was stronger but there were crippling strikes that affected the daily lives of many families. In 2016, the current President promised a return to those days of stronger but more erratic growth. Almost half of voters bet on him to undo the changes of the past several decades. Let’s look at some data that forms the bedrock of consumer confidence.
GDP is the most frequently used measure of the nation’s
economic activity. Another measure, Final Sales of Domestic Product excludes
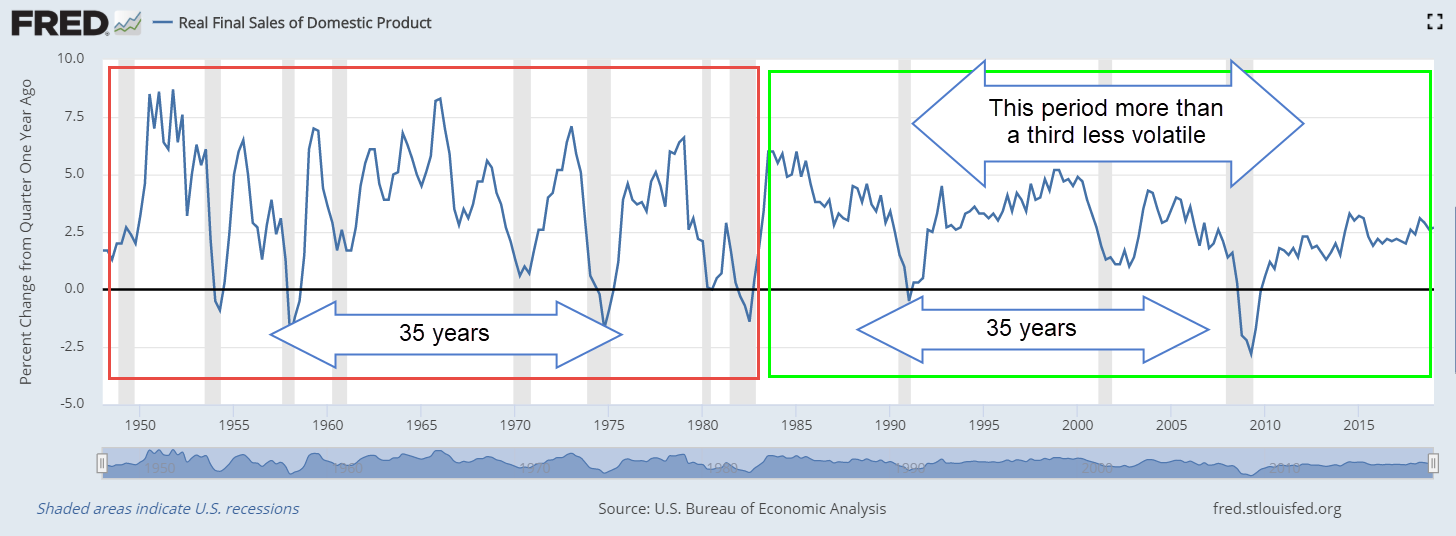
changes in business inventories. In the graph below is a chart of the annual
change in Final Sales after adjusting for inflation (Note #1). Compare the
right and left rectangles. The economy of post-WW2 America was more erratic
than the economy of the past thirty-five years (Note #2).
In the first 35 years following WW2, growth averaged 3.6%. Since the Financial Crisis there have only been five quarters with growth above 3%. Let’s include the annual change in disposable personal income (Note #3). That’s our income after taxes. Much of the time, the two series move in lockstep and the volatility in each series is similar.

However, sometimes the change in personal income holds steady while the larger economy drops into recession. A moderate recession in 1970 is a good example of this pattern.

1982 was the worst recession since the 1930s Great Depression. Unemployment soared to more than 10% but personal incomes remained relatively steady during the downturn.

In the 1990, 2000 and 2008 recessions, personal incomes did not fall as much as the larger economy. Here’s the 2008 recession. While the economy declined almost 3%, personal income growth barely dipped below zero.

In the last 35 years, annual growth in Final Sales has averaged only 2.8%, far below the 3.6% average of the first 35-year period. After the recession, the growth of the larger economy stabilized but the change in personal incomes became very erratic. In the past eight years, income growth has been 2.5 times more volatile than economic growth (Note #4). Usually the two series have similar volatility. In the space of one year – 2013 – income growth fell from 5% to -2.5%, a spread of 7.5%. In the past sixty years, only the oil crisis and recession of 1974 had a greater swing in income growth during a year! (Note #5)
When income growth is erratic, people grow cautious about starting new businesses. Banks are reluctant to lend. Despite the rise in home prices in many cities, home equity loans – a popular source of start-up capital for small businesses – are about half of what they were at the end of the financial crisis (Note #6). The Census Bureau tracks several data series for new business applications. One of these tracks business start-ups which are planning to become job creators and pay wages. That number has been flat after falling during the Great Recession (Note #7).

Businesses borrow to increase their capacity to meet expected demand. Since the beginning of 2016, banks have reported lackluster demand for loans from large and medium businesses as well as small firms (Note #8). For a few quarters in 2018, small firms showed stronger loan demand but that has turned negative this year. This indicates that business owners are not betting on growth. Here’s a survey of bank loan officers who report strong demand for loans from mid-size and larger firms. While few economists predicted the last two recessions, the lack of demand for business loans forecast the coming downturns.

There is an upside to slow growth – less chance of a recession. Periods of strong growth promote excess investment into one sector of the economy. In the early 2000s, the economy took several years to recover from the money poured into the internet sector. The Great Financial Crisis of 2008 and the recession of 2007-2009 was a reaction to over-investment and lax underwriting in the housing sector. On the other hand, weak growth can leave our economy vulnerable to a shock like the heightening of the trade war with China, or a military conflict with Iran.
Can a President, a party or the Federal Reserve undo several decades of slow to moderate growth? None of us want a return to the crippling inflation of the 1970s and early 1980s, but we may long for certain aspects of those yesteryears. An older gentleman from North Carolina called into C-Span’s Washington Journal and lamented the shuttering of the furniture and textile plants in that area many decades ago (Note #9). Many of those areas have still not recovered. Another caller commented that the Democratic Party long ago stopped caring about the jobs of rural folks in the south. Contrast those sentiments about the lack of opportunity in rural America with those who live in crowded urban corridors and struggle to keep up with the feverish pace and high costs of urban housing, insurance and other necessities. Two different realities but a similar human struggle.
/////////////////
Notes:
- Real Final Sales of Domestic Product FRED series A190RO1Q156NBEA
- Standard Deviation of first 35 years was 2.44. In the second 35-year period it was only 1.56.
- Real Disposable Personal Income FRED series DPIC96
- Since 2010, the standard deviation of economic growth has been .7 vs 1.75 for income growth.
- In the decade following WW2, people had similar large swings in income growth as the country and the Federal Reserve adjusted to an economy dominated by domestic consumption.
- Home Equity Loans FRED series RHEACBW027SBOG totaled $610 billion in the spring of 2009. It was $341 billion in the spring of 2019, ten years later
- Census Bureau data on new business start-ups
- Senior Loan Officer Surveys: Large and medium sized businesses FRED series DRSDCILM. Small businesses FRED series DRSDCIS.
- C-Span’s Washington Journal. C-Span also has a smartphone app.
