The Drifters

Matt brought up some good questions and comments yesterday.  I’ll look at one aspect that he brought up – the stagnation of wages for the past 35 years.

Over the past 3 to 4 decades, the U.S. economy has been transitioning to an almost entirely service based economy.  In 1953, manufacturing was 28% of the economy, a post WW2 high.  By 1995, it was only 16% of the economy, and by 2007 it had sunk to 12%.  How has this decades long shift affected the nation’s GDP?

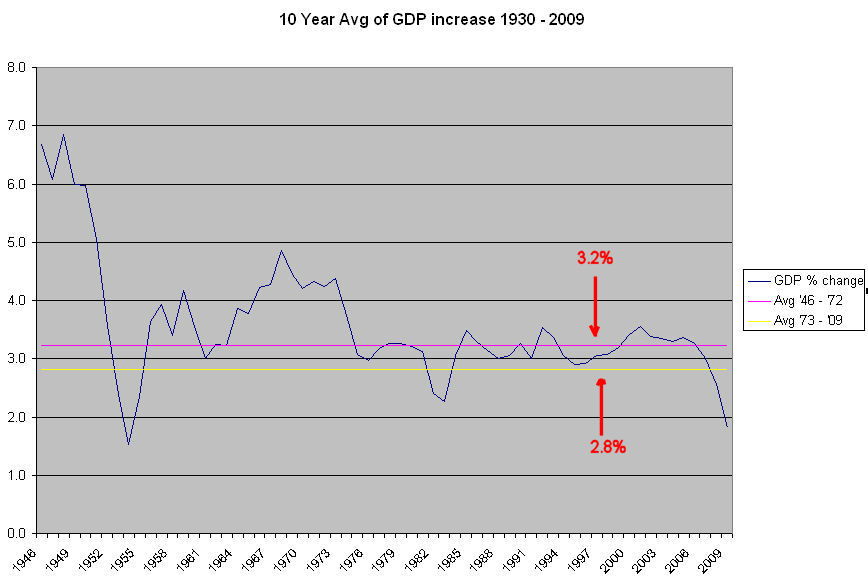
Below is a graph of U.S. GDP 10 year averages since WW2 and the averages for the periods 1946 – 1972 and 1973 to 2009.  (Click to enlarge)
Source:  Bureau of Economic Analysis

As you can see, average GDP growth has declined in the last 35 years by 12% from the 25 year period after WW2. I have heard Ben Bernanke, chairman of the Federal Reserve, say that they like to see an overall 3.0% average growth of GDP for a healthy economy – not too hot, not too cold. For the past 35 years, we have been just shy of that.

In this next chart, I combined data from the Bureau of Economic Analysis and the Census Bureau to show real GDP per capita growth  in 2009 dollars. 

In this next chart, I’ve drawn trend lines to show the various “speeds” of real GDP per capita growth over the past 60 years.  As you can see, the growth trend of the last 30 years or so has been below the growth trend of the 1960s.  The data also reveals that the 60s was an anomaly – a decade of robust growth that was partially fueled by military spending.  Yet it is this decade that some use as a baseline of comparison – a golden age of increased productivity and increased wages.

Although the growth of the past 3 decades might not be what it was during the 60s, it still averages 2.8%.  Have workers seen any of those gains in growth?  According to the BLS, the 1987 average hourly cost, including benefits, for workers in private business was $13.25, or $26.37 in 2009 dollars.  In March 2010, the BLS reports the average hourly cost at $29.71.  Over the past 24 years, companies have seen their real employee costs rise by only 13%, or about 1/2 percent a year.

During that same period, benefits have risen from 27% of total employee cost to 30%. Despite a 50% increase in inflation adjusted costs for health care in the past decade, businesses have managed to hold their labor costs down.  How have businesses managed this?  By reducing average wages.  In 1973, average hourly earnings for employees in private business was $4.14 ($20.00 in 2009 dollars).  In 2009, average hourly earnings were $18.62.   In real inflation adjusted dollars, workers have gained a tiny bit in benefits and lost about 5% in wages over the past 35 years.  Workers have simply not enjoyed either the gains in GDP growth or the gains in productivity over the past 3 decades or more.

But the pain felt by hourly and salaried workers is aggravated by the decline in work hours.  The BLS reports  that average weekly hours was 36.9 in 1973.  In 2009 weekly hours averaged only 33.1.  The reduced hours has affected the average worker’s weekly total.  In 1973 it was $152.77, or $738 in 2009 dollars.  In 2009, it was $617, a real drop of 16%.

How have business owners been able to keep a lid on worker wages for these past 35 years?  Supply and demand.  As I noted above, GDP growth has lessened over the past three decades, reducing demand.  During that period, the supply of labor has increased. In 1973, the BLS reports that there were 64 million in the civilian workforce, 40 million men and 24 million women.  The civilian workforce was 30% of the population of 212 million.  In 2008,  the total civilian workforce had almost doubled to 125 million, 67 million men and 58 million women.  This workforce was 41% of the total population of 304 million.  Look at the ratio of men to women in the workforce.  In 1973, there were almost two men for each woman.  By 2008, the ratio approached a one-to-one ratio. As more women entered the workforce, they put downward pressure on wages, which induced more women to enter the workforce to make up for lost household income.  This cycle will continue for the next two decades unless this country decides to implement policies that will return some of the lost manufacturing capacity to this country.

Productivity and You

In an article for the online magazine Slate, Daniel Gross presents the plight of the many employees who have jobs and are fed up with them.  I’ve been there, done that – a number of times in my life – so I can relate.  Now I’ll give you the other side of the picture.

Appearing before the House Joint Economic Committee on Aug. 6th, Keith Hall, the Commissioner of the Bureau of Labor Statistics, reported that about 98% of employees in this country work for a company with 50 employees or less.  He stated that there have been small increases in hiring by larger companies but hiring by small companies is flat or has decreased slightly.

Small companies are the economic engine of this country and they are not hiring.  Until small company owners starting hiring, workers will continue to endure almost record unemployment. This administration has only just begun to address this issue with talk about a loan program for small businesses.  For the past 1-1/2 years, they have been focused on the viability of big companies, those that produce 2% of the jobs in this country.  This administration thought that by helping the big guys, they would be helping the little guys – a kind of trickle down economics.  By the time the presidents and many vice-presidents at the big companies get done taking their share of the administration’s stimulus money, that’s about all that is left for the smaller companies – a trickle.  Little wonder that the real engine of this economy is sputtering.

The reluctance of small business owners to hire is due to several factors:  caution, fear, and uncertainty about future sales are top reasons.  Others are: a lack of readily available business loans, excessive employee regulations and the burden of employee payroll taxes and benefits.  Politicians like to make promises of a safety net for all employees, but who builds that safety net?  Small business owners.

Many small businesses have had to lay off employees in the past 2 – 3 years and those layoffs jack up the unemployment rate on each business.  In response to the rise in unemployment, many states also charge employers an additional tax surcharge.  My company’s unemployment insurance rate has quadrupled in the past two years. If a small business owner hires an employee and business drops off after six months, the owner will have to let the employee go, which will only increase the unemployment insurance rate again.  This self-defeating cycle of increasing taxes only makes small business owners more cautious about hiring.

In a downturn, small employers try to let those employees go who have the least productivity, leaving only the more productive workers to get the job done.  As a result, productivity goes up.  During downturns, the employees who have jobs are reluctant to push for raises and that, in turn, keeps a damper on labor costs, which helps increase productivity.  There are a number of other factors that have contributed to increased productivity in the past decade, but the chief one is investment in technology.  Better technology has enabled workers in a variety of industries to be more productive.  Daniel Gross, the writer of the Slate article, seems to think that it is because employees are working harder.  While that may be a minor contributing factor, people can only work so hard.  Better tools produces the biggest sustained gains in productivity.

The Bureau of Labor Statistics recently released their preliminary report of productivity for the quarter ending in June. For those readers who like graphs, the first page of the report has graphs of productivity for the past 5 years. For the first time since 2008, productivity declined about 1%.  In late 2007 and early 2008, labor costs increased dramatically, putting downward pressure on productivity.  Does Daniel Gross think that the downturn of productivity in 2008 meant that workers were goofing off that year?  When the economy gets strong or overheated, workers can demand higher pay for their work, which lowers productivity. 

There is an old saying “I never got a job from a poor person.”  While that may be true, it is also true that, for most of us, we get a job from a small business owner and most of those owners are not rich, just a bit better off than the people they hire.  Many smaller businesses are funded in part by the equity in the owner’s home.  The owner borrows against that equity to expand a small business or to fill in the cash flow gap that occurs frequently to many smaller business owners.  As the real estate market tanked, many small business owners saw their home equity decline or evaporate, making banks less willing to extend a business loan.

What answers does each of our political parties have to this small business funding crisis?  After 1-1/2 years of not thinking it was a problem, the Democrats will craft some complicated program that involves a lot of paperwork that small business owners will have to fill out.  What do the Republicans offer as a solution for the small business lending crisis?  Why it’s the one answer that Republicans give for all problems – lower taxes.  Neither party could fix a leaking drain.

The Tax Divide

Continuing my review of 20 years of tax data from the IRS, I’ll look at incomes vs income taxes paid.  As the chart below shows, the top half of households in this country pay all the personal income taxes collected. (Click graph to enlarge)

In 2000, net tax rates for the top half of households topped out at about the same level of the mid 80s – just under 20%.  The Bush tax cuts of 2001 and 2003 lowered net tax rates for the top half of household to under 15%.

The top half of households are making 90% of the personal income in this country and paying almost 100% of the personal income tax.  The top 25% of households are making 70% of the income and paying about 83% of personal income taxes.

Half of households pay the bills both for themselves and for the other half. In a democratic society, those on the lower half of the economic ladder will vote for politicians who promise more programs to help them out.  Those on the upper half will vote for politicians that promise to reduce their tax burden.

The core of the problem, however, is not tax rates or taxes paid but the rising gaps between economic groups, particularly those households at the very top of the economic ladder and the rest of the population.  Until that inequity in income is reduced, the top 25% of households will pay an ever increasing share of the tax burden.  Policymakers in Washington have been and continue to create a two tiered society.

What are some solutions to reduce the income gaps?   We have found that we can not have a healthy economy which is based almost entirely on the service sector.

1) Encourage businesses to relocate manufacturing facilities back to the U.S.  This can be done with tax incentives for those businesses that hire American workers.  Where will we get the money to afford these tax incentives?  The only place possible – those in the top 10% of households.  Increase the tax rates on those in the upper income brackets but target the additional money specifically for tax breaks for small manufacturing businesses – those with 100 employees or less – that hire American workers.  In Obama’s 2010 budget, he proposes to let the Bush era tax cuts expire for upper income taxpayers and use the additional tax money to reduce the country’s deficit.  It is a noble goal but it does not address the long term structural defects in this economy.  Right now, deficit reduction is a temporary bandaid on a much larger problem that will make large budget deficits a structural component of our economy in the coming decades.

2)  Relax some of the stringent environmental codes enacted over the past several decades which drove up costs for U.S. based manufacturers and hastened their departure for other countries with cheaper labor costs and less onerous environmental requirements.  This may upset some people who want a perfect world.  We can’t have a perfect world.  We never could. 

3)  Manufacturing requires capital and will absorb some of the excess money reserves that are looking for a return.  Too much U.S. savings is being used to invest in the manufacturing output of other countries.  Too much U.S. savings is being used to buy federal, state and local debt, all of which will continue to increase as the tax base decreases.  Let’s get our savings to work producing.

4)  Have a minimum tax that all but the poorest households pay each year – even if it is only $100 a year.  25% of households in this country have no “skin in the game.”  Target that tax money for those in the helping professions who are generally paid less for the work they do and the education they work hard to achieve.  That includes social workers, LPNs, nurses aides and counselors.

Any other ideas?

Income Gaps

Today, I’ll continue my examination of trends in income based on 20 years of income tax data from the IRS.

Adjusted Gross Income is gross income less selected deductions for the self-employed, students and teachers. In 2007, these were the approximate income “floors” for each percentile of tax returns:
Top 1% – above $410K
Top 5% – above $160K
Top 10% – above $113K
Top 25% – above $66K
Top 50% – above $33K

The graph below shows the percentage of income earned by the top 25% of income earners. Notice the dramatic increase in the past twenty years. (Click graph to enlarge)

The trend of the increase for the top 25% of incomes is steeper than the relatively flat trend of income increases for the top 50% and is mostly due to the steep income increases for the top 5%. Due to the “magic” of compound interest, money has a natural tendency to concentrate. Ever in search of better returns for the risk involved, the concentration of invested money will create bubbles in the economy like the housing bubble of this decade or the technology and internet bubble of the 1990s. If the increasing concentration of wealth in the hands of an ever smaller percentage of the population is not modified, our economy will bounce from one bubble to the next.

The graph below is in constant, or inflation-adjusted, dollars and shows the dramatic increase in incomes for the top earners in this country. The income for the top 50% has remained flat for the past two decades and that includes the large increases of those at the top. Subtracting out the skyrocketing increases in income for the top 5% leaves the other 95% with flat or declining real incomes.

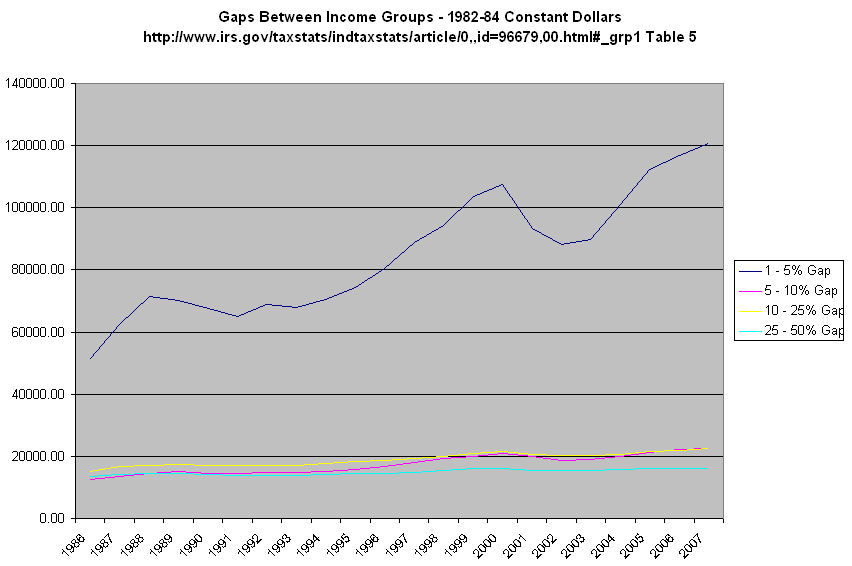
The graph below shows the “gap” between different income groups. In 1986, the gaps between each income group were about the same, excluding the gap between the richest 1% and the richest 5%. In the past two decades, the gap between the upper class and middle class have increased. Top earners have made good gains in the past two decades. Not so for the middle and upper middle class.

Tax Summary – 20 Years

A month ago, the IRS released their preliminary summary of 2008 returns, including tables of incomes and taxes for the past 18 years.

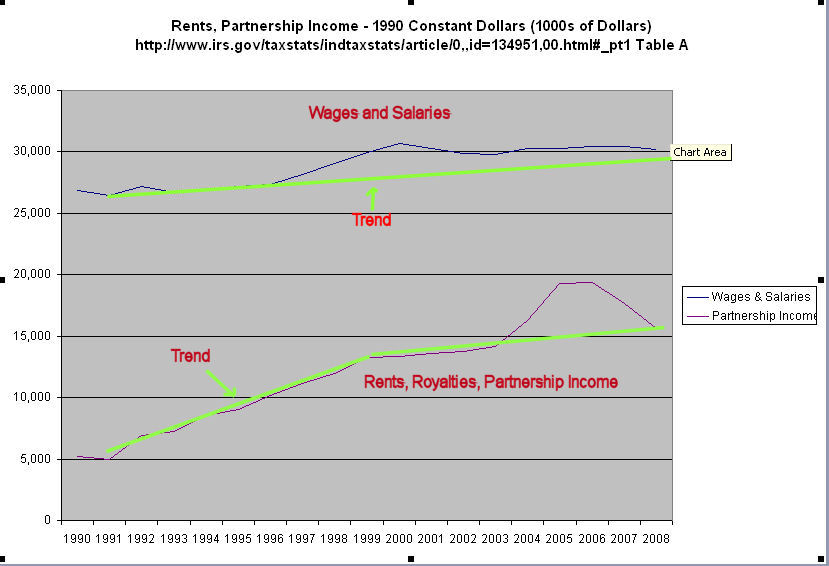
In the first chart below we can see wage and salary income averages per return are returning to trend after catapulting way above trend during the nineties. (Click graph to enlarge)

In the second chart is a comparison of income reported on K1 forms, largely professional and business owner income, with wages and salaries.  Professionals and business owners enjoyed a large increase in income compared to the flat earning of many workers.

In the 3rd chart is the total tax liability reported to the IRS.  Although some claim that reducing tax rates increases tax revenues and vice versa, the IRS data simply doesn’t support a strong correlation between tax rates and total income taxes paid to the IRS.  Tax revenues go up and they go down when tax rates go up.  They go up and they go down when tax rates go down.

In the 4th chart is the average tax liability, with the overall trend of up, up, up.

What accounts for the increase or decrease in tax revenues? It is a general increase in adjusted gross income per tax return, as the following chart shows. Income may go up or down when tax rates increase. They may go up or down when tax rates decrease. Again, there is little correlation between income and tax rates.

There is a lot of talk about the “New Normal” but what the latest downturn shows is a return to Normal, the same old normal trend line of income averages. We got way ahead of the trend during the tech and housing bubbles. We bought big cars and ever bigger houses, and ran up our credit cards using the equity in our homes. “Normal”, that is, the average of the trend, will always pull us back to the trend line.

State Employees

As I noted over a year ago, the coming state budget deficits were going to bring both spending cuts and new taxes.  Budget battles are inherently bloody.  As state budgets are being reviewed, the spotlight is being shone on the pay, health care and pension benefits of government employees in some states. 

Here is an article highlighting some of the costs in several cash strapped states.  Some government employees will have to accustom themselves to pay and benefits that are more like the average wages and benefits of the taxpayers.

Government Employees

As federal, state and local programs, agencies and bureaucracies grow, so too do the employees at the various levels of government.  In 1950, the population of the U.S. was 152 million, according to U.S. census data compiled by Data360.  In 2006, the population was 301 million or about double.  In 1950, the total government civilian workforce was 6.4 million, or a ratio of 1 government worker to 24 people.  In 2006, the total government workforce had grown to almost 20 million, a threefold increase and a ratio of 1 worker per 15 people.  The government employee growth rate of 1.5 times the growth rate of the population has occurred despite the efficiencies of computerization and communication and reveals the ever larger presence that government plays in our lives.

With about half of the population of working age, the ratio of 15 people to 1 government civilian worker means that about 7 people support each worker. The Census Bureau estimates the U.S. population at 367 million in 2030, an increase of 22%.  If the government workforce increases at the same 1.5 times the population growth rate, government employees will total more than 26 million in 2030, so that it will take one government worker to service 14 people.

What does not appear in the government employee totals is the increase in outsourcing of tasks that used to be done by government employees, a pattern that clearly emerged by 2000.  From 1996 to 2006, there was little change in the number of government employees.  Some of this was due to computerization but we can only guess at the number of federal, state and local jobs that were outsourced to private companies.  What is the true ratio of population to government worker?  Perhaps 13 to 1?

Some people and politicians clamor for more programs, more regulation, and more in general from government.  When is it enough?

TARP Deadbeats

Pro Publica, an independent non-profit noted for its investigative journalism, has been keeping tabs on the TARP Troubled Asset Relief Program TARP program and presents its updated status here.

I dropped their figures into a spreadsheet and came up with some interesting factoids.  All dollar figures are in rounded billions of dollars.  Actual disbursements from the program have been $538, of which $343 is still outstanding.  80% of the funds were disbursed to just 12 companies, with Fannie Mae and Freddie Mac, the quasi-government mortgage giants, at the top of the list. Fannie received almost $84 while Freddie got over $61.  Neither of these public – private companies has returned any money to the treasury.

General Motors recently ran a number of ads touting the fact that they had repaid some of the funds to the U.S. taxpayer.  What the ads didn’t tell us was that GM still owed taxpayers almost $44.  What GM also failed to note was the $16 loaned to its financing arm, GMAC, which was split off into a separate company.  None of that money has been repaid. Chrysler has returned only $2 of the almost $11 it received.  GM, GMAC and Chrysler combined received $72 and have returned only $9.

AIG has returned nothing of the $47 loaned to them.  Citigroup has returned $26 of the $45 it received.  The other mega-banks, Goldman Sachs, J.P.Morgan Chase, Bank of America, Wells Fargo and Morgan Stanley have all returned the combined $115 they received.  Taxpayers made $11 on those 5 banks, a return of 9.6%.

Here’s a short summary of the $343 in outstanding monies (in billions):
Fannie          $84
Freddie         $61
GM, GMAC     $60
AIG        $48
Chrysler     $9
830 Others    $81   

Economic Weather

Understanding and predicting the economic weather is less precise than, well, predicting the weather.  The stock market is a composite “vote” of the direction and strength of corporate profits in the coming six months to a year.  It is not a barometer of what the economy will do, but an indicator of people’s predictions, their fears, their hopes. Predicting the economic weather involves a complex interplay of many factors, which, by themselves, are not that complicated.  It is the interplay and the weight, or importance, given to each factor that accounts for the range of prediction.

Henry Blodget is a former Wall St. analyst who was indicted by the Securities and Exchange commission for ethics violations during the “dot com” boom at the end of the nineties.  Blodget subsequently founded the Business Insider, a blog about trends in business and the economy.  Here  is a compilation of charts on the labor market, housing, and manufacturing output for several decades.  You may or may not agree with Blodget’s dire prognostications but the overall picture of data that he has pulled together is worth a look.

Fiscal Foolery

The fiscal year of the U.S. Government runs from October to September, preceding the calendar year by three months.  The 2011 fiscal year will start October 2010 and end September 2011.

By early February of each year, the President presents his budget proposal for the coming year, starting October 1st.  The proposal also includes an outline of spending priorities and income projections for the coming five years.  That proposal often becomes a starting point for budget committees in the House and Senate to craft a resolution, which is not a law but a framework of authority for various appropriations bills.  By April 1st the budget committees are supposed to present the resolutions to the full House and Senate for a vote.  Discrepancies between the House and Senate versions of the resolution then have to be worked out in the House, which passes the final resolution.  In 2006, despite majorities in both houses, Republicans were unable to reconcile and pass a budget resolution.

This year, the House Budget Committee passed their resolution to the full House on March 15th.  The Senate resolution didn’t make it out of committee till April 22nd.  On July 1st the House Budget Committee chairman filed a budget resolution that addresses only the coming fiscal year and does not contain a 5 year outline.

This past week Congressional Representatives headed home for the July 4th recess.  Republicans accused the Democrats of passing a budget resolution without an outline.  Democrats answered that the upcoming bipartisan President’s Fiscal Commission’s report, due in December, would outline long term budget proposals which both houses will be voting on. (WSJ article)

Paul Ryan, the Republican ranking member of the House budget committee, answered that the budget passed by House Democrats “does not set congressional priorities; it does not align overall spending, tax, deficit and debt levels; and it does nothing to address the runaway spending of federal entitlement programs.”  (Washington Post op-ed by David Broder)

With elections just a few months away, are Democrats unable to pass a resolution that clearly spells out the doom and gloom of the coming five years?  Probably.  Voters don’t respond well to bad news. A realistic appraisal of the coming years will involve the contradictory necessity of more government stimulus for the economy and spending reductions to bring the budget down.  Voters may say they want less government but many voters don’t want anyone to trim their particular handout, whether it be Social Security, Medicare, farm supports, unemployment payments or tax breaks.

Each month the Congressional Budget Office (CBO) issues a report card on the current fiscal health of the Federal government, budget projections and the estimated effects of various legislative proposals on the budget in the coming years.  The good news is that the deficit this year is less than last year’s red ink.  The bad news is not only that the difference is slight but that the comparison hides some very troubling patterns. 

2009 included expenses for TARP and Fannie Mae and Freddie Mac, the quasi-governmental mortgage giants.  Those expenses are significantly down in 2010, helping to hide the significant increases in spending this year – 11% higher than 2009.  TARP spending is actually a negative, a phantom income that artificially lowers this year’s deficit.  Receipts this year are a bit more than 2009 and spending on health and defense has decreased slightly but various domestic nutrition and food aid programs, collected under the label “Other Activities”, have increased by 9%.  Estimates for June reveal that federal unemployment benefits paid out so far this year have skyrocketed by 50%, from $84bn to $124bn.  

The unemployment rate is unlikely to decrease significantly this year, meaning that there will be pressure on Congress to continue unemployment extension benefits. In the long term, nutrition and food aid programs provide not only humanitarian relief commensurate with the ideals of this country but make budget sense, as they reduce health spending in the future.  As the population ages, Medicare spending is only going to increase.  Until the economy improves significantly, Medicaid spending will continue to grow.  That leaves two areas to reduce the deficit in the coming years.  One – spend less on defense.  Two – increase taxes.  That twin headed serpent is a harsh reality that no politician can ride on in the upcoming election and get elected.