Lessons Learned

June 5, 2022

by Stephen Stofka

This week Janet Yellen, the current Secretary of the Treasury and former Fed Chair, admitted that she had not understood the path inflation would take. Such honesty from an administration official is refreshing. Ms. Yellen joins a long list of smart and experienced money managers who did not forecast this inflation trend. Global pandemics happen once a century, producing economic shocks that are unpredictable.

The economist Milton Friedman attributed inflation to money growth. Who grows money? Banks. The central bank (Fed) may increase the base money[1] it makes available to its member banks but it is the banks who multiply that base money when they make consumer and business loans. In the past decade, the annual percent change in household debt has tracked closely the rate of inflation. As long as banks were reluctant to extend credit, inflation remained low. The CARES act transferred billions to consumers and banks followed the money, extending more credit and shifting consumer demand higher.

For more than a decade sales of consumer durables excluding cars (ADXTNO) had waned. Pandemic restrictions forced us to alter our consumption habits and we bought durable goods for a new stay-at-home lifestyle. These included computers, dishwashers, refrigerators, and workout equipment. Our collective actions produced positive and negative effects. There is no one individual responsible for the negative impacts so we have blamed government policies or politicians.

Our collective actions change our physical and economic environment. Like a forest fire, we create our own weather and that feedback process can amplify the destructive forces of our actions. Adam Smith, the first economist, lived at a time when people were clustering in communities to trade with each other and engage in collective production. He was the first to note the dynamics of labor specialization where the productivity of individual effort is magnified and the entire community benefits from the assembly of coordinated effort.

As our  population grows and concentrates in larger communities, group dynamics have a greater influence in our individual lives.  Fashionable ideas and perspectives sweep through our society as easily as new product innovations. Social media speeds the introduction and adoption of trends. Under normal circumstances, the global supply chain adapts to these demand shifts rather quickly. However, the supply chain relies on a continuous flow of goods and services. The pandemic interrupted that flow, inducing a supply shock into the economy.

As economic activity returned to normal during 2021, investors and policymakers thought that supply chain disruptions would ease. Market prices increased about 20%. In January 2022, companies reporting 4th quarter results indicated that supply chain problems were slow to resolve and anticipated higher prices in 2022. Thousands of very smart people revised their earlier forecasts and adjusted their portfolio positions.

One of our favorite pastimes is armchair quarterbacking. We do it with ourselves as much as we do it with others. Reviewing a test score, we are sometimes surprised by a dumb mistake we made. Many of us gravitate toward jobs with a greater degree of familiarity and predictability. There is less stress and less likelihood of making mistakes. Some jobs are like daily tests with multiple selection choices and the answers are not certain. The lessons emerge as events unfold and lack what statisticians call external validity. The lessons learned or principles identified cannot be generalized to other situations because of important differences. Top administration officials and those in upper company management have those kinds of jobs.

/////////////

Photo by Ben White on Unsplash


[1] Base money refers to reserve money that is available only to banks.

The Force of the Fed

To some extent, the Federal Reserve considers itself government. Other times, when it serves, it considers itself not government. – Philip Coldwell, President FRB Dallas 1968-74

September 2, 2018

by Steve Stofka

The nations of the world are the gods of Mt. Money, most of them with central banks who administer the credit and currency of each nation. Like the ancient Mt. Olympus of Greek lore, there is competition and a hierarchy among the gods. Currently the U.S. is the top god of Mt. Money.  Central banks manage credit by changing the interest rate, or price, that they will charge the demi-god banks within the nation’s borders. The banks, however, do not perfectly distribute the intentions of the central bank. Acting as intermediaries, the banks filter monetary policy and have a more direct effect on the economy. In this intermediary role, banks control the draining of Federal taxes generated by the economic engine.

In the U.S., the Federal Reserve (Fed) is the central bank of the Federal government, an independent agency created by Congress which has given it two targets: promote full employment and stable inflation. To meet those goals, Fed economists must gauge the strength of the economy, a difficult task, and estimate an ideal state of the economy, an even more difficult task.

Each August the Federal Reserve holds an economic summit at Jackson Hole in Wyoming. The newly appointed head of the Federal Reserve, Jerome Powell, is the first non-economist leading the central bank in 39 years. His paper (Note #1) is plain spoken and illustrates the difficulty of reading an economy in real time. As such, I think he will be a gradualist, someone who advocates measured moves in interest rates unless there is a more abrupt shift that requires a stronger policy tonic.

Powell uses the analogy of a sailor steering the waters by reading the stars. The waves and weather can make real time observations unreliable, yet the sailor must make decisions that steer his course. Optimizing employment is one of the two missions that Congress has given the Federal Reserve. The Fed must make a real-time estimate of what they think is the optimum or natural rate of unemployment (NAIRU) and adjust interest rates to help align the actual unemployment rate to the natural rate. Powell presented a chart that compares the actual rate of unemployment to NAIRU as it was estimated at the time, and the “hindsight” NAIRU as economists now calculate it. (Note #2) The speech balloons are mine.

UnemployEstimatesPowell2018

On page seven, Powell writes that, in the past, the central bank “placed too much emphasis on its imprecise estimates of [NAIRU] and too little emphasis on evidence of rising inflation expectations.”

Note the final word – expectations. Measuring what will happen is especially difficult because it has not happened. Probability methods can help but an economy has many more inputs than a dice game. One category of estimates are surveys of guesses about what will happen in the future, but these overstate actual inflation [Note #3]. A second category uses market prices. One method uses the price that buyers are willing to pay for a Treasury Inflation Protected Security (TIPS) (Note #4) In my July 22nd post, I introduced another market method – the net flow of money into the economic engine (Note #5)

Credit expansion has been poor since the Financial Crisis. The Fed cannot force banks to increase or decrease their loan portfolios by changing interest rates. In the years following the Financial Crisis, the Fed was frustrated by this inability, called “pushing on a wet noodle.” Interest rates are the carrot. The stick is a complex regulatory process that raises or lowers asset leverage ratios to encourage or discourage lending (Note #6).

The Fed manages credit flow through asset sales and purchases. While the central banks of other countries can buy stocks and commodities, the Fed is limited to buying debt, including foreign currencies, from its member banks (Note #7).

The Fed has the extraordinary power to purchase or sell the reserves of its member banks without their consent. Like the Fed, you or I can increase the reserves of a bank by depositing money in the bank (Note #8). What we can’t do is lower those reserves by writing our own loans. However, credit card companies, who are underwritten by banks, do provide us with a line of credit that we can draw on by using our cards. During the Financial Crisis, credit card debt jumped $50B, or 15%, because card holders reduced their payments by that much. In response, credit card companies reduced credit card limits by 28% (Note #9). While the Fed encouraged banks to loan, the behavior of consumers and businesses did the opposite. Consumers and businesses were more powerful than the Fed.

The banks administer or filter Fed policy in their interactions with consumers and businesses. If a bank must pay higher interest for its funds, then it will charge higher interest rates for consumer and business loans. Interest is the price for a loan. When the price rises, the supply for loans rises (banks make more profit on the spread) but demand for loans falls. The reverse is not true, as the data of the past decade has shown. When the price falls, the supply of loans falls while the demand increases.

Less credit expansion results in a slower economic engine, which generates less Federal tax revenue. For the engine to run properly, the internal pressure must remain stable. Inflation is one gauge of that internal pressure. The annual growth in Federal tax revenue must be equal to or greater than the inflation rate. When it is not, the engine begins to stall. In the graph below, I’ve charted the annual growth in Federal tax revenue less the inflation rate. Note the periods when this metric dropped below zero. In most cases, recession follows. Look at the right side of this chart. There has never been a time when the reading is so far below zero without a recession. That is a cautionary note.

FedTaxLessInflation

The Fed must look through the fog of the future before it deploys its money super powers. In the face of this, the Fed must act with humility and a practical caution. Once it has decided on a strategy, the banks modify its implementation because they obey three masters: the Fed, their customers and their stockholders. Actual monetary policy becomes not the work of a select few in the Federal Reserve but an emergent composite of policy force and practical friction.

/////////////////////////

1. Powell’s speech is 14 pages double-spaced with several pages of charts and references.

2. For thirty years, from 1955 to 1985, the gap between the real-time estimate of NAIRU and the hindsight estimate is 1-1/2%, an error of 25%. In the 1990s economists’ models were more accurate. The estimate of NAIRU and its validity is debated now as it was in 1998 when Nouriel Roubini referenced several views on the topic.

3. A one-page Fed article on survey and market methods of measuring inflation expectations.

4. A one-page Fed article on long-term inflation expectations using the implied rate of TIPS treasury bonds – currently it is 2.1%. Vanguard article explaining TIPS bonds.

5. The net flows of credit growth, federal spending and taxes precedes inflation by several months (July 22 blog post).

6. Credit growth has been flat for the past decade as I showed in this July 15th post.

7. In conjunction with the Treasury, the Federal Reserve may buy foreign currencies to correct disruptive imbalances in interest rates. A NY Fed article explaining the process.

8. When we deposit money in a bank, its reserves, or cash balance, increases on the asset side. It incurs an offsetting liability of the same amount because the bank owes us money. We have, in effect, loaned the bank money. When so many banks collapsed before and during the Great Depression, people came to realize the true nature of depositing money in a bank. The banks could not pay back the money that depositors had loaned them. The creation of the FDIC insured depositors that the money creating powers of the Federal government would stand behind any member bank. My mom grew up during the Depression era and passed on the lessons learned from her parents. She would point to the FDIC Insured decal on the bank window and tell us kids to look for that decal on any bank we did business with in the future.

9. Credit card companies lowered limits. See page 8. Oddly enough, this Fed study found “we have little evidence on the effect of such large declines in housing wealth on the demand for debt.” Page 9. NY Fed paper written in 2013.

Hunt For Inflation

July 15, 2018

by Steve Stofka

Saddle up your horses, readers, because we are going on the Hunt for Inflation. I promise you’ll be home for afternoon tea. During this recovery, Inflation has been a wily fox, a real dodger. It has not behaved according to a model of fox behavior. Has Inflation evolved a consciousness?

Inflation often behaves quite predictably. The central bank lowers interest rates and pumps money into the economy. Too much money and credit chasing too few goods and Inflation begins running amuck. Tally-ho! Unleash the bloodhounds! The central bank raises interest rates which curbs the lending enthusiasm of its member banks through monetary policy. Inflation is caught, or tamed; the bloodhounds get bored and take a nap.

Not this time. Every time we think we see the tail of Inflation wagging, it turns out to be an illusion. Knowing that Inflation must be out there, the central bank has cautiously bumped up interest rates in the past two years. Every few months another bump, as though unleashing one more bloodhound ready to pounce as soon as Inflation shows itself.

Yes, Inflation has evolved a consciousness – the composite actions of the players in the Hunt. These players come in three varieties. One variety is the private sector – you and me and the business down the street. The second variety is the federal government and its authorized money agent, the Federal Reserve, the country’s central bank. Finally, there is a player who is a hybrid of the two – banks. They are private but have super powers conferred on them by the federal government. The private sector is the economic engine. The federal government and banks have inputs, drains and reservoirs that control the running of the economy.

The three money inputs into the constrained (see end) economy are 1) Federal spending, 2) Credit growth, and 3) net exports. In the graph below, the blue line includes 1, 2, and 3. The red line includes only 1. The graph shows the dramatic collapse of credit growth in this country. Federal spending accounted for all the new money flows into the economy.

CreditNXFedSpendvsFedSpend

Before the financial crisis, money flows into the economy were just over 30% of GDP. In less than a year, those inputs collapsed by almost 25%.

CreditGrowthFedSpendPctGDP

When inflation is lower than target, as it has been for the past decade, too much money flow is being drained out for the amount that is flowing in. In the case of too high or out of control inflation, as in the case of Venezuela, the opposite is true. Too much is being pumped in and not enough is being drained out. That’s the short story that gets you back to the lodge in time for a cup-pa or a pint. Next week – the inputs, drains and reservoirs of the economy.

////////////////////////////

  1. Constrained – the private economy, state and local governments who cannot create new credit.
  2. Net exports are the sum of imports (minus) and exports (plus).

All Aboard!

July 17, 2016

I have changed the blogger template to make it easier to read on a mobile phone. On my Android phone, the dynamic template defaulted to classic view without all the widgets on the side and was easier to read. The graphs are easier to see in landscape mode, when the long part of the phone is horizontal to the ground. Perhaps some readers can give me some feedback if there are problems viewing on an Apple phone.  Now on to this week’s business!

As I noted last week, things can get a bit ugly when both stocks and Treasuries surge upward at the same time, as they have in the past few weeks following the sharp downward response to the Brexit vote in the U.K.  The buying of stocks signals that investors have more of an appetite for risk.  The buying of Treasuries and gold signal a desire for safety.  At the beginning of the week the world woke up to the news that the Japanese central bank was going to provide a lot of stimulus to goose economic growth.  This gave a boost to Asian stocks and the rally in equities was on.  By the end of the week, the Japanese stock market had risen 8% during the week and it’s currency, the yen, had fallen the most since 1999.

Economist Paul Krugman has called on Japanese policy makers to set higher inflation targets and provide even more stimulus to spur an economy now lethargic for two decades.  According to Krugman’s own textbook, the roles of an economist are 1) to describe the economic and market mechanisms; and 2) form predictions of how the economy and market would react if certain policy actions were adopted.

However, Krugman has a lot of visibility as an op-ed writer in the NY Times.  In this role, he often offers prescriptive solutions, and this week’s call is yet another prescription from Dr. Krugman.  Japan has been basing their policies on Krugman’s predictions for a decade with mixed or muted results. More stimulus seems to be the eternal cry from Krugman, a smart man who seems to have but one or two solutions for the majority of social and economic problems.

Most economists are rather circumspect, arguing among themselves the mechanisms and validation of varied predictions.  But there are a few stand outs who reach out to the general public, ready and willing to engage in the political debate.  The subfield of economics called macroeconomics forms a beautiful mud pit for the struggle of political policies, for politicians often cite macroeconomic rationale when championing a set of policies.  For thirty years, Nobel winner Milton Friedman espoused a more conservative and monetary model of the economy, emphasizing montetary, not fiscal, policy by the central bank as the chief intervention in the market economy.  Search YouTube and you will find many of his talks and lectures and they are both informative and entertaining.

Krugman is one of the more vocal macroeconomists who diagnose economic maladies, build a predictive model based on policy or monetary fixes, then diagnose their model when their predictions are in error.  The patient didn’t take enough of the medicine or there is some response lag or the full extent of the problem was not known or was disguised by something or other.  The descriptive aspect of macroeconomics doesn’t seem to help develop a predictive model.  Perhaps the study of economic phenomenon on a national and international scale is just too difficult to have much predictive ability. Let’s hope not.  For the past decade, so many really smart people have been wrong.

Once again this week, central bankers signalled that they were ready to adopt what are called accommodative policies to reassure markets.  If stock markets were an athlete with a knee injury, central bankers would be the good doctor who drains the knee then injects a bit of pain medication and cortisone into the joint before sending the athlete back onto the field.

////////////////////

Retail Sales

Wildlife scientists may study herds of grazing animals to gain insight into both the seasonal behaviors of the herd and its response to conditions that alter the animals’ environment.  These include drought, war, or the burning of forests for farmland.  Economists follow a different kind of herd – people.

Macroeconomists focus on the behavior of the entire herd; microeconomists analyze the behavior of individuals acting within the herd.   Two telltale signs of human behavior are paycheck stubs and sales receipts, which act in tandem like entangled particles in a quantum dance.  In this consumerist economy, retail sales are fueled by the earnings of 140 million workers; the monthly reports on each activity guide the analysis of economists.

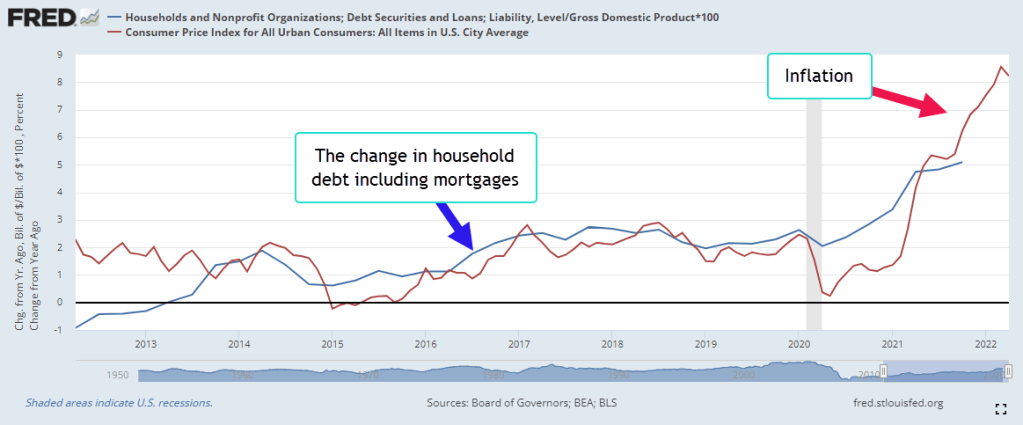
Each month a sample of paycheck stubs is gathered and reported by the Bureau of Labor Statistics.  The Census Bureau produces an estimate of retail sales based on a survey of almost 5000 companies.  (For those interested in the methodology.) Year-over-year growth in real, or inflation adjusted, sales fell below 1% in March this year and spurred some concern that consumption power was being eroded by slow income growth. Following the extraordinary labor report a week ago, the monthly retail sales report, released this past Friday, was stronger than the consensus.  Inflation adjusted sales rose 1.67% over last year, rising up a 1/2% from May’s year-over-year reading.  2% real growth would be ideal but anything over 1.5% is a sign of a growing economy. Why the 1.52% threshold?  1% of each year’s growth can be discounted as simply population growth.
 
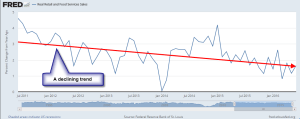
On a sobering note, the year-over-year growth in retail sales is gradually declining as we can see in the graph below.

What negative signs should an ordinary investor watch for?  Where is the herd going?  Investors should get cautious when year-over-year growth in real retail sales consistently falls below 1.5%.  After December 2006, growth remained below this threshold and did not cross back above it till March 2010 – a period of 3-1/4 years that darkened the lives and hopes of many Americans.  During that period January 2007 through March 2010, the SP500 index fell from about 1440 to 1170, a decline of 19%.  We are part of the herd but with some observant caution we may be able to move some of our savings to the fringes of the herd movement and avoid getting trampled.

///////////////////////

MyRA

Earlier this year the U.S. Treasury introduced a Roth IRA tool called myRA for employees who work at a company that does not offer a retirement savings account.  This is a fully guaranteed account similar to a savings account that grows tax free.  The maximum one can save in this kind of account is $15,000 and part of the contribution amount is entitled to a tax credit.  This can be a good way to get started with retirement savings.  The Federal Reserve has an article on the subject here.

///////////////////

Amtrak Train Trance

On vacation in California recently, I rode Amtrak’s Pacific Surfliner several times on day trips from Los Angeles.  Unlike the east-west Amtrak routes, these north south routes along the coast are more frequent, running several times a day sometimes only two hours apart. Part of the route is along the beach, part along a highway, and part travels the urban backcountry – the backyards of businesses, farms and homes that most of us do not see from a car.  The experience was a sightseeing delight, a meditative trance of motion.

Most of Amtrak’s lines do not make money and rely on government subsidies.  Like so much of our transportation infrastructure in this country, railroad infrastructure needs upgrade and repair.  Opponents of government subsidies often don’t realize how much of what they personally use is subsidized.  Here is a link to a Business Insider article on Amtrak’s operations and the political debate over federal subsidies for Amtrak.  The debate crosses party lines because rural politicians of both parties tend to support subsidies for Amtrak when the rail service crosses through their geographic region.

Air travel, the most frequent mode of long distance transporation, is heavily subsidized by the federal government.  Here is a USA Today article on that subject and the $2 billion in subsidy for one airport alone, LaGuardia airport in New York City.  Likewise are the massive amount of indirect subsidies for automobile transporation, which rely on roads maintained by federal, state and local tax dollars.  These repairs are only partially paid for with dedicated gasoline tax dollars; state and local taxes must make up the difference.  Let us also include the multi-billion dollar bailouts of the industry that arise every few decades because of poor planning by industry executives in response to market demand or foreign competition.

Amtrak subsidies look miniscule in comparison. The railroad suffers from a chicken and egg problem of investment and revenue.  Which comes first?  Without more investment the railroad can only offer once a day service on east-west routes, which does not attract strong ridership.  Without a show of rider demand, there is little incentive to provide investment. The California Zephyr leaves a major city like Denver enroute to the west coast at 8 A.M. only once a day.

Boarding times in a particular region may be inconvenient.  Barstow, CA is a city of 23,000 north of Los Angeles that is serviced by the southern east-west Amtrak route called the Southwest Chief.  Like the Zephyr, this train starts in Chicago but heads southwest through Kansas, Colorado and New Mexico before heading west through northern Arizona to the west coast.  The Barstow railroad station, if it can be called that, consists of a bench and a slight overhang typical of urban bus stops.  There is no bathroom or other facilities.  The 4-1/2 hour trip to Union Station in Los Angeles arrives and departs once a day in Barstow at 3:40 AM, a unwelcoming time for a train jaunt into the big city.  The large city of San Bernadino, CA has a slightly more hospitable departure time of 5:30 AM.

In the early 19th century, before the refinement of petroleum deposits into gasoline, railroads were developed and built in Britain, then spread to Europe.  Early investment in rail transportation both for goods and people embedded the concept and the technology in European politics, its economies and cultures.

Many decades ago, this country chose to subsidize the movement of people by car, reserving the rails for the transportation of goods.  The land was big, and population centers west of the Mississippi were distant.  Steam locomotives run on wood,  a precious commodity west of the 100th meridian (central Nebraska), where there was not enough rainfall for trees to grow on the vast plains.  Oil deposits were plentiful in several regions within the country and gasoline is portable and a rich source of energy, packing a lot of BTUs per volume.

We love our cars, the hum of tires on blacktop as we run down the highway. But a train has another quality that is difficult to get in a car – a reduced sense of movement, a trance like floating through space while staring out the picture window of a rail car at a movie in motion.  If you have a few days and you are not in a rush, take a seat and let the landscape unroll before you.

The Big Picture

Or maybe the title of this post should be “The Big Pitcher”.  No, it’s not about a tall baseball pitcher, but the glass pitchers that central banks around the world hold.  What comes out of the pitcher when the central banks start pouring?  Money.  How do they do that?  It’s magic.  Don’t you wish you had a money pitcher?

Jerry forwarded me an article by someone at Matterhorn Asset Management, a Swiss asset management company that invests primarily in metals as a wealth preservation model so they will have a predisposition to a gloomy outlook because investors’ fears will bring more business to the company.  That said, the article presents a 200 year review and outlook on the mechanics of inflation and rather dire long term predictions for the world economy.

Featuring a 150 year chart on the Consumer Price Index and another one of US Debt to GDP ratio, this 6 page article definitely takes a long view of events in the past in making prognostications of the future. 

A comparison of the 19th and early 20th century with the latter part of the 20th century has to be put in a bit more perspective than this article does.  Electricity is something we take for granted but its effect on our lives has been as profound as the discovery of fire and the invention of cooking.  It is an energy that is readily available to most people in developed countries.  This ready source of energy has radically transformed our society, our productive capacity and our demand for products that use this energy.

In the 1920s, the new industry of radio telecommunications kicked off a bubble in the stock market.  Some predicted that we would walk around with communication devices that we wore on our wrists.  Information would be readily available to all with these cheap and portable two way radios.  It would be another 70 years before this dream would become a reality with the internet and the dawning of the cell phone age.  That in turn prompted another stock bubble in the late nineties.

When countries around the world abandoned the gold standard in the past century, they did so because the supply of gold could not keep up with the rapid expansion of production and demand that accompanied the energy and communication age.  How profound has this expansion been?  Several historians have noted that a person living in Boston in 1780 would have felt familiar with most of what surrounded him in that same city in 1900.  Jump ahead another 50 years to 1950 and that same person would be totally disoriented in a city with electricity, flashing lights, automobiles, subways, TVs, radios and the sheer growth in the population of the city.

The gold standard simply could not accommodate this rapid expansion of economic activity.  However, the gold standard put brakes on the centuries old tendency of sovereign countries to print money or debase the currency.  After abandoning the automatic regulatory mechanism of the gold standard, we have found nothing comparable to provide some restraint on central bankers other than a trust in the wisdom and foresight of those like Ben Bernanke, Chairman of the Federal Reserve.  An entire world of billions of people depends on the wisdom of several hundred individuals making decisions at central banks around the world.  It is a daunting and vulnerable position we find ourselves in.