Profits and Savings Diverge

November 20, 2022

by Stephen Stofka

This week’s letter is about household savings and corporate profits. As a share of GDP, savings are near an all-time low while profits are at an all-time high. Elon Musk, the CEO of Tesla, appeared in court this week. No, this wasn’t about his acquisition of Twitter. It concerned a shareholder lawsuit against Tesla regarding the $50B stock option package the company awarded him in 2018. In 2019 the company’s total revenue – not profit – was less than $25B. In 2022, annual revenue was $75B. At a 15% profit margin, the company must continue growing its revenue at a blistering pace to afford Mr. Musk’s incentive pay package. Large compensation packages like this are only a few decades old. Let’s get in our time machine.

In 1994, Kurt Cobain, the 27 year old leader of the rock group Nirvana, died from an overdose of heroin. Something else was dying that year – corporations were breaking free of national boundaries and moving production to countries other than their home nation. This was the last stage in the evolution of multinational corporations, or MNCs. In earlier decades, companies had licensed or franchised their brand. Perhaps they had set up a sales office in a foreign country. Now they were becoming truly global. Fueling that expansion was an increase in equity ownership by large institutional investors. To accommodate these changes, their governance structures changed. Executives capable of leading this global growth were rewarded on a parallel with superstar sports talent. That was the conclusion of Hall and Liebman (2000, 3), two researchers at the National Bureau of Economic Research. 

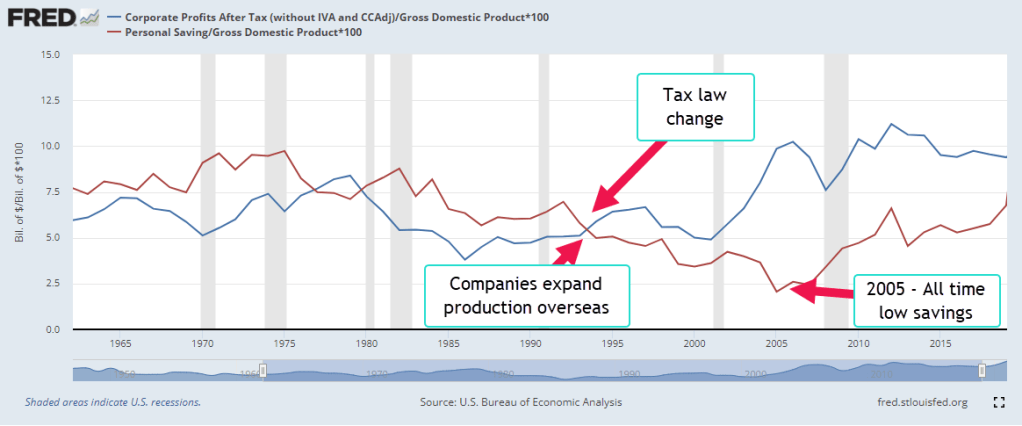
Let’s look at two series over the past sixty years – personal savings and corporate profits. If we think of a household as a small enterprise, personal savings is the residual left over from the household’s labor. Likewise, corporate profits are the residual left over from current production. In 1994, the two series diverged. Corporate profits (the blue line in the graph below) kept rising while personal savings plateaued for a decade. Each series is a percent of GDP to demonstrate the trend more easily.

Executive Compensation

In the mid-1990s, corporations began to issue a lot more stock options to their executives. Some think that a change in the tax code might have precipitated this shift in compensation.  In 1994, Section 162m of the IRS code limited the corporate deductibility of executive pay to $1 million (McLoughlin & Aizen, 2018). By awarding non-qualified stock options to their executives, companies could preserve the corporate tax deduction. However, the slight tax advantage did not account for the rapid increase in options awards. Hall and Liebman found that the median executive received no stock option package in 1985. By 1994, most did. The tax change was secondary – a distraction. Institutional investors wanted more growth and more profits and companies were willing to reward executives with compensation packages similar to sports stars (Hall & Liebman, 2000, 5). Some of these superstars included Jack Welch of General Electric,  Bill Gates of Microsoft, Michael Armstrong of AT&T.

Income Taxes – Less Savings

In 1993, Congress passed the Deficit Reduction Act that raised the top tax rate from 31% to almost 40%. Personal income tax receipts almost doubled from $545 billion in 1994 to almost $1 trillion in 2001. The booming stock market in the late 1990s produced big capital gains and taxes on those gains. For the first time in decades the federal government had a budget surplus. However, more taxes equals less personal savings so this contributed to the flatlining of personal savings during that period.

Household Debt Supports More Spending

During the 2000s, personal savings remained flat. On an inflation adjusted basis, they were falling. Too many people were tapping the rising equity in their home to pay expenses and economists warned that household debt to income ratios were too high. Savings as a percent of GDP fell to a post-WW2 low. As home prices faltered and job losses mounted in late 2007, people began to save more but their debt left them with little protection against the economic downturn. During 2008, personal savings began to increase for the first time in fifteen years. More savings meant less spending, furthering the economic malaise that began in late 2007.

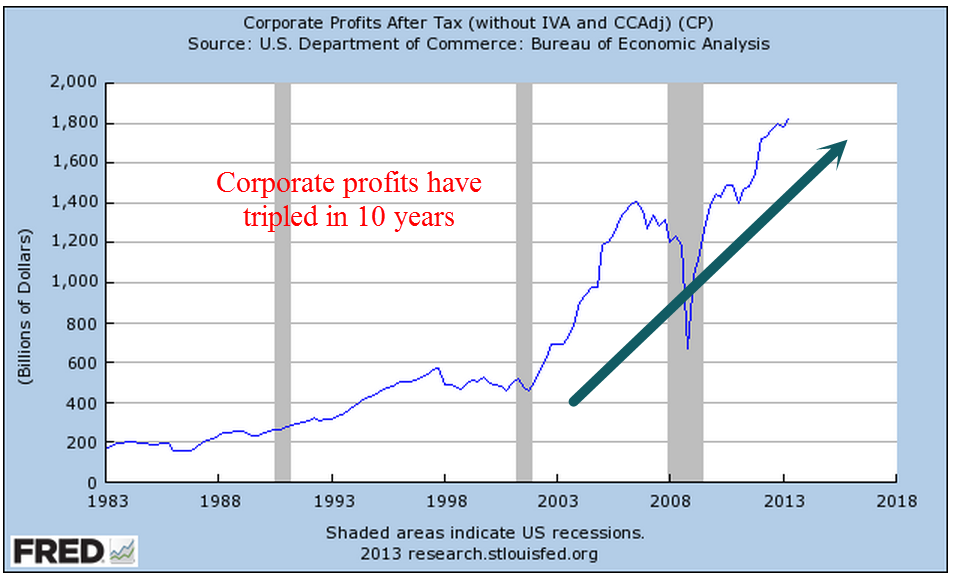
Multi-National Corporate Profits

During those 15 years corporate profits rose steadily as companies increased their global presence. Beginning in 1994 U.S. companies began shifting production to Mexico where labor was cheaper. In 2001, China was admitted to the World Trade Organization (WTO) and production outsourcing continued to Asia. Despite the profit gains, companies kept their income taxes in check. In 2021, corporate income taxes were at about the same level as in 2004. That contributed to the rising budget deficit during the first two decades of this century.

Federal Deficit

The prolonged downturn in 2001-2003 and the financial crisis and recession of 2007-2009 put a lot of people out of work. This triggered what are called “automatic stabilizers,” unemployment insurance and social benefits like Medicaid, housing and food assistance. The federal government went into debt to pay for the Iraq War, pay benefits to people and help fill the budget gaps in state and local budgets. The tax cuts of 2003 enacted under a Republican trifecta* of government control reduced tax revenues, further increasing the deficit. During George Bush’s two terms, the debt almost doubled from $5.7 trillion to $11.1 trillion.

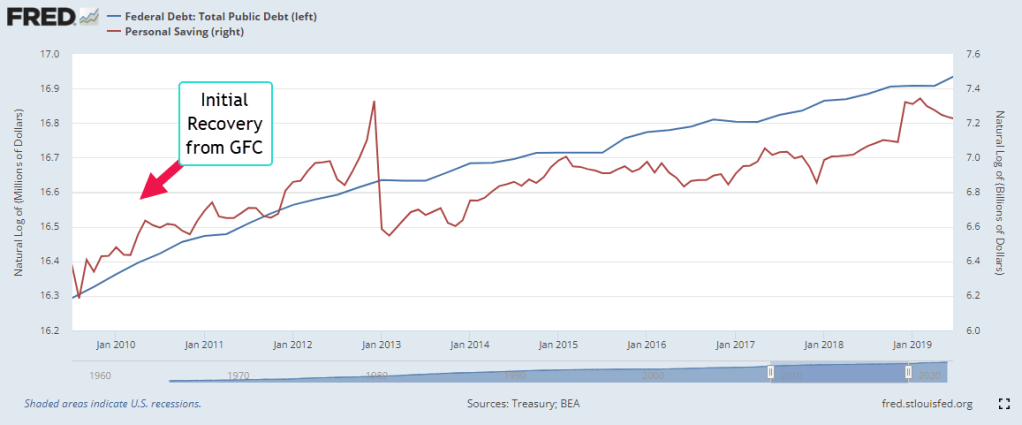
In coping with the recovery from the financial crisis, the government added another $8.7 trillion to the debt. That negative saving by the government helped add to the personal savings of households but too much was spent on just getting by. Following the Great Financial Crisis (GFC), the trend of the government’s rising debt (blue line below) matched the trend in personal savings (red). Sluggish growth and lower tax revenues caused the two to diverge. While the debt grew, personal savings lagged.  

Before and During the Pandemic

Following the 2017 tax cuts enacted under another Republican trifecta, personal saving rose, then spiked when the economy shut down during the pandemic and the federal government sent stimulus checks under the 2020 Cares Act. In the chart below, notice the spike in debt and savings. By the last quarter of 2020, personal savings had risen by $600 billion from their pre-pandemic level of $1.8 trillion. In late December, President Trump signed the $900 billion Consolidated Appropriations Act (Alpert, 2022) but that stimulus did not show up in personal savings until the first quarter of 2021. In March 2021 President Biden signed the $1.7 trillion American Rescue Plan. Personal savings rose $1.6 trillion in that first quarter, the result of both programs.
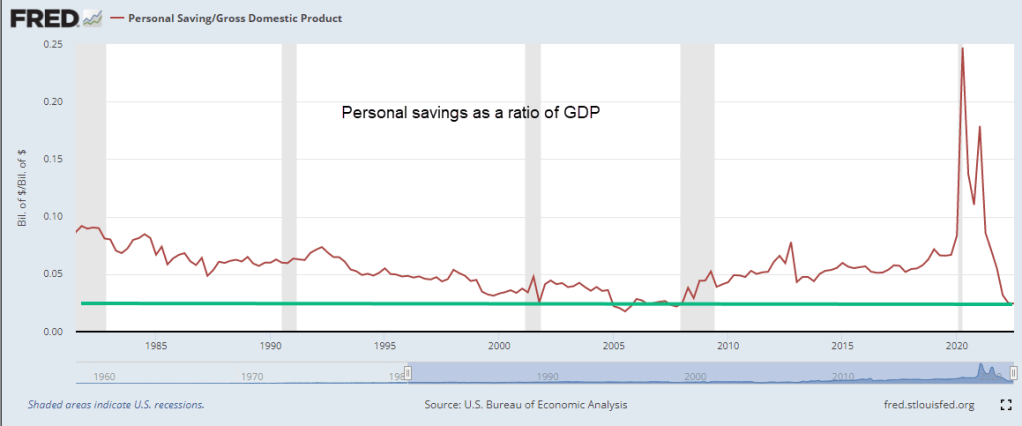
After the Pandemic

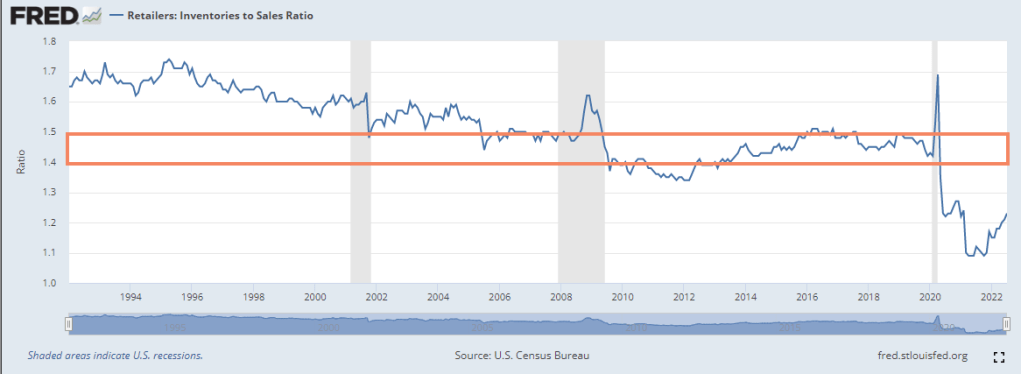
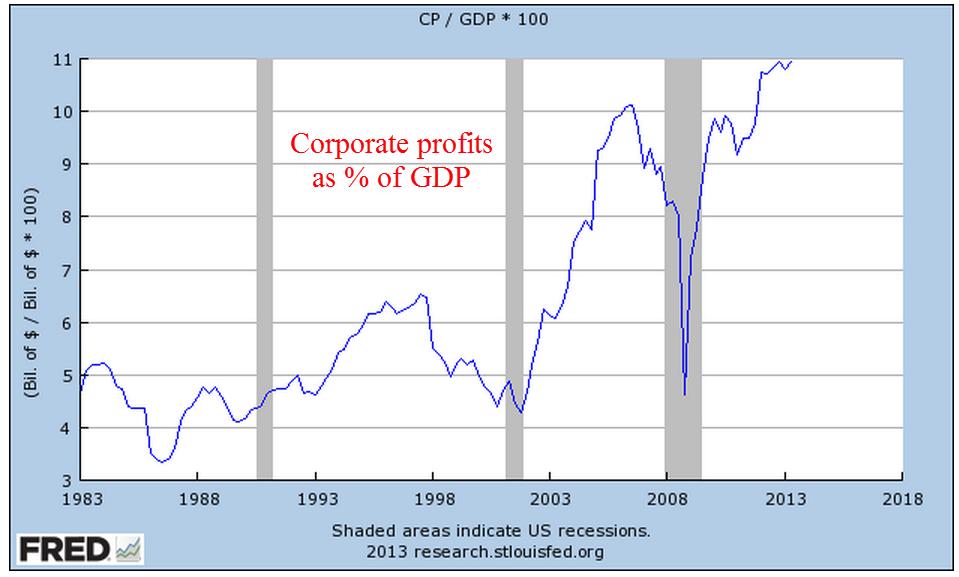
Some economists have said that the American Rescue Plan was too much. In hindsight, it may have been but we don’t make decisions in hindsight. As more schools and businesses opened up, households spent far more than any extra stimulus. They spent $1.2 trillion of savings they had accumulated before the pandemic and savings are now at the same level as the last quarter of 2008 when the financial crisis struck. Thirteen years of cautious savings behavior has vanished in a few years. On an inflation-adjusted basis, personal savings is at a crisis, almost as low as it was in 2005. In the chart below is personal savings as a ratio of GDP.

The Future

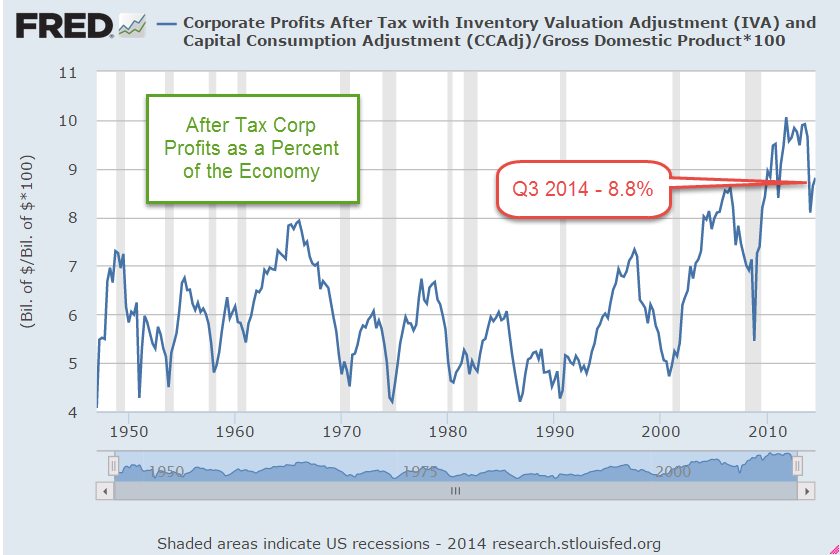
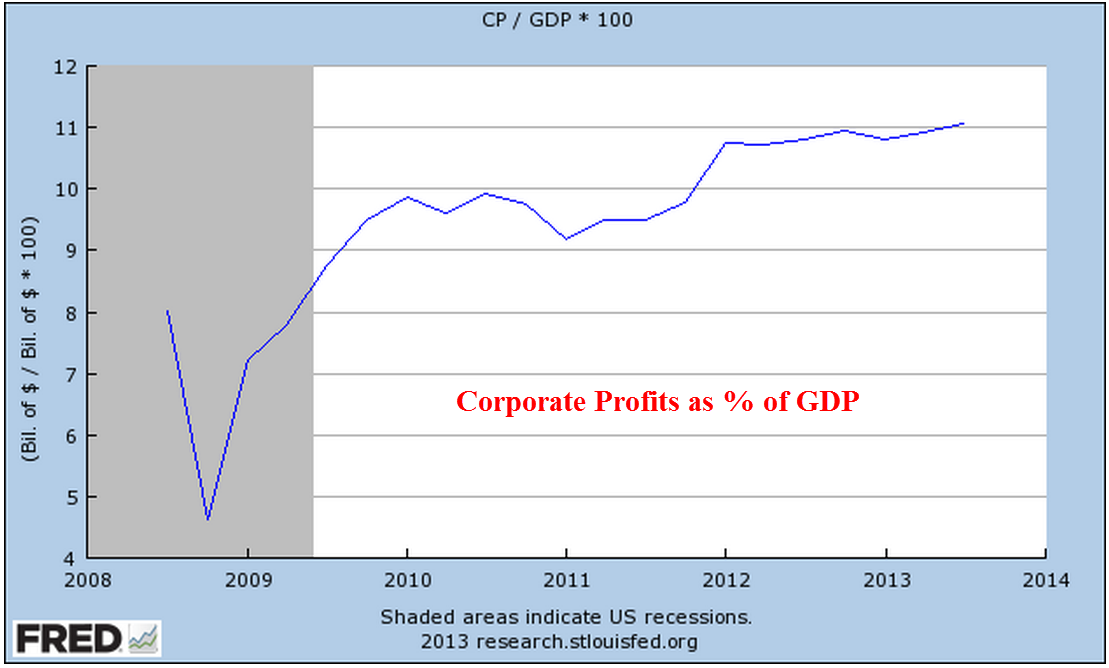
In the past year savings (red line) and corporate profits (blue line) have resumed the divergence that began almost three decades ago. Profits were 12% of GDP in the 2nd quarter of 2022. Savings is near that all time low of 2005. Rising profits benefit those of us who own stocks in our mutual funds and retirement plans. However, the divergence between the profit share and the savings share is a sign that the gap between the haves and the have-nots will grow larger.

////////////////////

Photo by Jens Lelie on Unsplash

  • A trifecta is when one party controls the Presidency and both chambers of Congress.

Alpert, G. (2022, September 15). U.S. covid-19 stimulus and relief. Investopedia. Retrieved November 19, 2022, from https://www.investopedia.com/government-stimulus-efforts-to-fight-the-covid-19-crisis-4799723. See Stimulus and Relief Package 4 for the December 2020 CAA stimulus. See Stimulus and Relief Package 5 for the American Rescue Plan in March 2021.

Hall, B. J., & Liebman, J. B. (2000, January). The Taxation of Executive Compensation – NBER. National Bureau of Economic Research. Retrieved November 19, 2022, from https://www.nber.org/system/files/chapters/c10845/c10845.pdf. Interested readers can see Moylan (2008) below for a short primer on the recording of options in the national accounts. Until 2005, these options were recorded as compensation for tax purposes but not recorded on financial statements so they did not initially affect stated company profits.

McLoughlin, J., & Aizen, R. (2018, September 26). IRS guidance on Section 162(M) tax reform. The Harvard Law School Forum on Corporate Governance. Retrieved November 18, 2022, from https://corpgov.law.harvard.edu/2018/09/26/irs-guidance-on-section-162m-tax-reform/

Moylan, C. E. (2008, February). Employee stock options and the National Economic Accounts. BEA Briefing. Retrieved November 19, 2022, from https://apps.bea.gov/scb/pdf/2008/02%20February/0208_stockoption.pdf

Inflation and Profit Flow

September 18, 2022

by Stephen Stofka

Price records circumstances, not value or utility. Our buying power is like a bar of soap. As water shrinks soap, high inflation shrinks our buying power. Economists offer several explanations for the persistent inflation but the one that I buy is that constrained supply and fairly steady demand are driving prices higher. Rising prices are a symptom of a shortage of goods – a quantity issue. Retailers inventory to sales ratio has increased slightly from the historic low in May 2021 but the ratio is still far below the range of 1.4 – 1.5 that was the benchmark before the pandemic.

This past Thursday, I picked up three jars of my favorite crunchy peanut butter. Some stores have been out of stock on the crunchy variety so I bought extra to be sure. I was not concerned about rising prices. I was responding to a quantity shortage, or the fear of a shortage. The difference is important. In Econ 101, students are shown the standard supply and demand diagram.

Left out of this stylized relationship is that supply is on a slower time scale than demand. It takes time, planning, investment and risk to produce all that supply. To cope with that reality, businesses must keep an inventory on hand to meet changes in demand which happen on a shorter time scale. Shift the red supply line to the left and the intersection of supply and demand occurs at a higher price. The Fed and the market thought that the supply constraints would fully resolve by this year but they have not. As stores and restaurants reopened, customers put away the electric panini sandwich makers, bread machines and gym equipment they had bought during the pandemic. They began purchasing consumables and were willing to pay higher prices for clothes, airline and movie tickets, and restaurant meals. In the face of ongoing supply constraints, the Fed has had to keep raising interest rates to try to curb demand, shifting the blue demand line to the left as well.

The higher prices helped businesses recover profits lost during the pandemic. Businesses have taken advantage of the supply disruptions to juice their profits by 33% (BEA, 2022).

When the Republicans took control of both chambers of Congress and the Presidency, they lowered corporate taxes. Those on the left often blame the economic elite for society’s problems and wasted no opportunity in criticizing Republicans for gifting the corporate elite. Mr. Trump boasted on his business prowess, promising to get the economy revving up again. Despite his rhetoric, corporate profits remained at the same level as during Mr. Obama’s second term.

A Presidential veto can block legislation but it is Congress that passes the laws that affect the economy. As I wrote last week Congress sometimes buys voter approval, creating bubbles that finally implode. The State Historical Society of Iowa (2019) has an image of a 1928 campaign ad for Herbert Hoover. It is a resume of economic progress under total Republican control during the 1920s. The Congress had won the public’s approval with easy credit and lax regulation. The following year the onset of the Great Depression brought down the house of cards. 25% of workers lost their jobs. Many lost their homes and farms.

Corporations exist to turn money flows into profits. Whatever money Congress spends winds up in corporate coffers. After 9-11, the federal public debt rose by $3 trillion (U.S. Treasury Dept, 2019) while corporate profits more than doubled, all thanks to Congress. Democrats and Republicans supported higher military spending and a building boom supported by easy credit policies.

In response to the pandemic, a bipartisan effort in Congress passed relief packages of more than $3 trillion. Today the public debt is $7 trillion above the pre-pandemic level. Much of that money became corporate profit because that’s what good companies do – turn cash flows into profits. Some of those profits were then used to buy the Treasury bills generated when the government increased their debt. This completed the cycle of debt and profits.

On average voters re-elect 90% of House members and 80% of Senate members. Midterm elections are less than two months away. Both parties take advantage of the public’s tendency to pin responsibility – good or bad – on the President, both the current and the past President, Mr. Trump. “Inflation is Biden’s fault,” Republicans will say and hope it sticks with some voters. Democrats hope that Trump will announce a 2024 run for President before the coming midterm election. They hope that independent voters, particularly suburban women, will vote for Democrats to voice their disaffection with Mr. Trump.

The election spending will juice the profits of media companies who depend on the craziness of our democratic politics. People in western European countries look in dismay at our frenzied politics that makes us vulnerable to a populist like Trump. Some Americans long for authoritarian measures that might curb the craziness of our politics and promote more cooperation. They are tired of the demolition derby of American democracy and wish they could go to sleep for a few months until it is over.

////////////////////

Photo by Anvesh Uppunuthula on Unsplash

State Historical Society of Iowa. (2019, January 14). “A chicken for every pot” political ad, October 30, 1928. IDCA. Retrieved September 16, 2022, from https://iowaculture.gov/history/education/educator-resources/primary-source-sets/great-depression-and-herbert-hoover/chicken If you have a moment, do check this out!

BEA: U.S. Bureau of Economic Analysis, Corporate Profits After Tax (without IVA and CCAdj) [CP], retrieved from FRED, Federal Reserve Bank of St. Louis; https://fred.stlouisfed.org/series/CP, September 16, 2022.

U.S. Department of the Treasury. Fiscal Service, Federal Debt: Total Public Debt [GFDEBTN], retrieved from FRED, Federal Reserve Bank of St. Louis; https://fred.stlouisfed.org/series/GFDEBTN, September 16, 2022.

Competition

July 11, 2021

by Steve Stofka

This week President Biden issued an executive order (White House, 2021) to counter the trend toward corporate consolidation and oligarchy that has arisen during the past decades. I appreciated that the report contained links to the outside data sources they are using. After almost six months in office, Mr. Biden has signed 51 orders, almost half of them rescinding the orders of former President Trump (National Archives, 2021). In 2017, Mr. Trump signed 55 orders total but only eight of those were rescinding orders. The pace of orders slows after the first several months in office. I’ll review some highlights from this order.

For the past decade inflation has been below the Fed’s 2% target but the trend toward consolidation in some key industries gives those few companies that dominate an industry greater pricing power. Modern Farmer reported that 80% of the meatpacking industry is controlled by just four companies (Nosowitz, 2020). In 2000, the top 20 home builders controlled 15% of the market. Today it is 30%. Mr. Biden’s order notes that mark-ups, the charges over a company’s cost, have tripled in recent years. Since 2010, Federal Reserve data (2021) shows that after-tax profits have increased almost 50%, substantiating the claim of higher markups. In the past decade, low interest and rising profits have fueled a tripling of the stock market.

For the ten years following 9-11, after-tax profits also tripled, despite the worst financial crisis since the Great Depression in the 1930s. Many financial companies lined up at the corporate soup kitchen in Congress and were bailed out. Homeowners and workers went hungry while Congress paid bonuses to the same speculators that sparked the crisis (Story & Dash, 2009). Sorry, folks, we had to honor the contracts, the politicians in Washington said. It’s the law. Who helped write the laws? The corporations that got bailed out.

The order notes the growing increase of non-compete agreements for new job hires, making it more difficult to move to a more attractive job. It references data from the Economics Innovation Group (EIG, 2021) that the rate of new business formation has sunk by half in the past fifty years. The shift of manufacturing to China has also contributed to the overall decline.

The report notes the upswell in occupational licensing requirements over the past several decades. Licensing appears to be about public safety and some of it is. The states have come to depend on the revenue from the licensing fees and it avoids having to raise some taxes on voters. Trade schools that certify beauticians and other occupations like the tuition revenue they receive. Established business like licensing because it keeps out competition. The benefits are widespread and the costs are concentrated to those seeking careers in those occupations, many of them blue collar and little political power.

There are many faults in our federalist system that an executive order cannot remedy because the Constitution gives a lot of power to the states. What it can do is bring more attention to these anti-competitive practices. New Zealand and Singapore top the World Bank’s list of countries with low obstacles to doing business. The U.S. is sixth, just behind S. Korea and a few places ahead of Norway.

Americans believe in American exceptionalism but the Nordic countries keep beating us in various international categories. People say “You Americans. You should be more like the Nordic countries!” Suck on it, Norway, Finland and Sweden. We are ahead of you in ease of doing business. Next year we’re going to take on S. Korea and after that, tiny Denmark. There is nobody more capitalism loving than America and we’re going to prove it by stopping some of these anti-competitive practices!

/////////////////

Photo by Pietro Mattia on Unsplash

EIG. (2020, June 29). Dynamism in retreat. Retrieved July 11, 2021, from https://eig.org/dynamism

Federal Reserve. (2021, June 24). Corporate profits after TAX (without IVA And ccadj). Retrieved July 11, 2021, from https://fred.stlouisfed.org/series/CP.

National Archives. (2021). Federal Register: Executive orders. Retrieved July 11, 2021, from https://www.federalregister.gov/presidential-documents/executive-orders/joe-biden/2021

Nosowitz, D. (2020, June 09). DOJ reportedly Subpoenas ‘Big Four’ Meatpackers. Retrieved July 11, 2021, from https://modernfarmer.com/2020/06/doj-reportedly-subpoenas-big-four-meatpackers/

Story, L., & Dash, E. (2009, July 30). Bankers reaped lavish bonuses during bailouts. Retrieved July 11, 2021, from https://www.nytimes.com/2009/07/31/business/31pay.html

Van Dam, A. (2019, October 19). Increasingly, economists find, homebuilding in fewer hands. Retrieved July 11, 2021, from https://www.providencejournal.com/news/20191019/increasingly-economists-find-homebuilding-in-fewer-hands

White House. (2021, July 09). FACT sheet: Executive order on promoting competition in the American economy. Retrieved July 11, 2021, from https://www.whitehouse.gov/briefing-room/statements-releases/2021/07/09/fact-sheet-executive-order-on-promoting-competition-in-the-american-economy/

Tax Reform Winners and Losers

May 26, 2019

by Steve Stofka

Φ * π Σ (y-c) / (σ ỹ)

Did your head just explode? That’s how the tax code appears to many of us. This spring, many taxpayers sat down with their tax accountants and were informed that they were among the losers created by the tax reform act that went into effect for the 2018 tax year. Among the losers were employees who claim business expenses. In the western states, many in the construction trades may take a temporary job that is located a few hours from home. Instead of driving home every day, they share hotel rooms or live in campers during the work week and travel home on weekends to be with their family. Some employers pay per-diem expenses, but many smaller employers don’t. Under the old tax laws, an employee could deduct meals, lodging and ordinary living expenses away from home. Under the new law, employee business expenses are subject to a threshold that equals 2% of gross income (Note #1).

An employee with business expenses who has a family of four has discovered that they are the losers this tax filing season, the first one under the new tax law. Under the old law, that family of four used to get $12K standard deduction and $16K in personal exemptions. Now they get a $24K standard deduction and no personal exemption (Note #2). If they have employee business expenses that meet the threshold test, it may not be enough to exceed the new higher standard deduction. Some tax accountants report that their clients are shocked when they learn how much they owe in this first tax year under the new law.

In the future, some workers may be able to negotiate higher pay on these away jobs. Some will have to turn down such jobs.   

Corporate America was a big winner in the tax reform bill. In addition to lowered tax rates, low interest rates during the past decade have helped many publicly held companies buy back their own stock. The stock buybacks have accelerated this past year, with a record 25% of companies in the SP500 buying back their own stock, according to a Wall St. Journal analysis published this week. 

Don’t companies have a better use for the money? Apparently not. When companies buy back stock, they reduce the number of shares outstanding and increase the profit per share reported. In the first quarter of 2019, these buybacks lifted per-share profits by 4%. The share buybacks have distracted investors from the fact that corporate profits have flatlined since 2012.

Corporate profits flatlined during the Reagan administration in the 1980s. Investors bid up stocks on the promise that trickle-down policies and tax reform would break the cycle. Before profits did start to rise again, stock prices shook off their speculative pricing on Black Monday in October 1987. Let’s hope we don’t have a similar phenomenon this time.  

////////////////////
Notes:

  1. Workplace expense deductions
  2. Tax law winners and losers.

Less Bang For The Buck

June 17, 20918

by Steve Stofka

There are two types of inputs into production, human and non-human. Over a hundred years ago, Henry Ford realized that he had to invest in his human inputs as well as his equipment, land and factories. Once he started paying his employees a decent wage, they were able to buy the very cars they were producing on Ford’s assembly line.

The total return on our stock investments depends on two inputs: dividends and capital gains, which is the increase in the stock price. Both are dependent on profits. Dividends are a share of the profits that a company returns to its shareholders. Capital gains arise from the profits/savings of other investors who are willing to buy the shares we own (see end for explanation of mutual funds).

In the past three decades, a growing share of total return has come from capital gains. Because of that shift from dividend income to capital gains, market corrections are harsh and swift.

In the 1970s, stocks paid twice the dividend rate that they do today. It took an oil embargo and escalating oil prices, a continuing war in Vietnam, the impeachment of President Nixon, a long recession and growing inflation to sink the market by 50% beginning in early 1973 to the middle of 1974.

In 2000, the dividend rate or yield was a third of what it was in 1973. Total return was much more dependent on the willingness of other investors to buy stocks. In 2-1/2 years, the market lost 45% because of a lack of investor confidence in the new internet industry, a mild recession and 9-11. Dividends act as a safety net for falling stock prices and dividends were weak.

In 2008, the dividend yield was about the same as in 2000. In 1-1/2 years, the market again lost 45% of its value because of a lack of confidence brought on by a financial crisis and a long and deep recession.

Other bedrock shifts have occurred in the past three decades. Corporate debt is an input to production. In the post-WW2 period until 1980, corporate debt as a percent of GDP was a stable 10-15%. $1 of debt generated $7 to $10 of GDP. Following the back-to-back recessions of the early 1980s until the height of the dot-com boom in 2000, that percentage almost doubled to 27%. Each $1 of corporate debt generated less than $4 of GDP.

CorpDebtPctGDP

Today $1 of corporate debt generates just $3 of GDP. Debt is a liability pool. GDP is a flow. That pool of debt is generating less flow. It is less efficient. In 1973, $1 of corporate debt generated 46 cents in profit. Now it generates just 30 cents.

To hide that inefficiency and make their stocks appealing to investors, companies have used some of that debt to buy back their own stock. This reduces the P/E ratio many investors use to gauge value, and it increases the leverage of profit flows.

Here’s a simple example to show how a stock buyback influences the P/E ratio. If a company makes a $10 profit and has 10 shares of stock outstanding, the profit per share is $1. If the company’s stock is priced at $20, then Price-Earnings (P/E) ratio is $20/$1 or 20. If that company borrows money and buys back a share of stock, then a $10 profit is divided among 9 shares for a per-share profit of $1.11. The P/E ratio has declined to 18. When the company buys stock back from existing shareholders, that often drives up the price, and thus lowers the P/E ratio further.

The P/E ratio values a company based on the flow of annual profits. A company’s Price to Book (P/B) ratio values the company based on a pool of value, the equity or liquidation value of the firm. If we divide one by the other, we get an estimate of how much profit is generated by each $1 of a company’s equity, or Return On Equity (ROE).

1982 was the worst recession since the Great Depression. Stocks were out of favor with investors and were at a 13 year low. In 1983, $8.70 of equity generated $1 of profit for companies in the SP500. Seventeen years later, at the height of the dot-com boom in 2000, companies had become more efficient at generating profits. $6 of equity generated $1 in profit. In the last quarter of 2017, companies have become less efficient. $7.30 of equity generated $1 of profit.

Let’s look at another flow ratio, one based on the flow of dividends. It’s called the dividend yield, and the current yield is 1.80, about the same as a money market account. I can put my $100 in a money market account or savings account and earn $1.80. If I need that $100 a year from now, it will still be there. I could use that same $100 and buy a fraction of a share of SPY, an ETF that represents the SP500. I could earn the same $1.80. However, if I wanted my $100 back in a year, it might be worth $120 or $50. A stock’s value can be very volatile over a short time like a year, and the current dividend rate does not compensate me for that extra risk.

Why don’t investors demand more dividends? After the early 1980s, economists at the Minneapolis Federal Reserve noted (PDF) that, on a global scale, companies’ profits grew at a faster rate than the dividends they paid to shareholders. The dividend yield of the SP500 companies fell from 6% in the early 1980s to 1% in 2000 (chart).

Those extra profits are counted as corporate savings. The same paper showed that global corporate savings as a percent of global GDP increased from 10% in the early 1980s to 15% this decade. Each year companies were adding on debt at a faster pace than during the post-war decades, but undistributed profits were growing even faster. The net result was an increase of 5% in the rate of corporate saving. Companies around the world were able to shift dividends from the savings accounts of shareholders to the savings of the companies themselves.

From the early 1980s to the height of the dot-com boom, stock prices increased more than ten-fold. Investors that had depended on company dividends for income in previous decades now depended on other investors to keep buying stocks and driving up the price. The source of an investor’s income shifted slightly from the pocketbooks of corporations to the pocketbooks of other investors. Investors adopted a shorter time horizon and now look to other investors to read the mood of the market.

The bottom line? If investors rely on each other for a greater part of their total return, price corrections will be dramatic.

///////////////

Notes: Price to Book (P/B) ratio was 1.5 in 1983 (article).
P/B graph since 2000
When mutual funds sell some of their holdings, they assign any capital gains earned to their fund holders. This amount appears on the mutual fund statements and the yearly 1099-DIV tax form.

A November 2017 article on share buybacks at the accounting firm DeLoitte


Gangbusters!

December 7, 2014

On Monday, George intended to put the $50K from the CD into the bond market. He couldn’t decide between a long term bond index like Vanguard’s BLV or TLT, the ETF that tracked 10 year Treasury bonds. Both the bond and stock markets opened lower in the morning which confused him and he did nothing. Gallup released their monthly survey of consumer spending for November, showing a respectable gain of more than 4% over last November.

Tuesday’s report of auto sales in November was strong.  Total vehicle sales topped 17 million on an annualized basis. Auto manufacturers reported particularly strong sales over the Thanksgiving holiday.  SUVs were big sellers and that was a double plus for auto companies because those vehicles had larger profit margins.  The American car buyer has long had a short memory.  Six months of falling gas prices prompted many to abandon their economical cars and wrap themselves in a big bubba vehicle.

Construction spending was up 1.1% from the previous month and 3.3% above last October.  The economies of Europe may have slipped into neutral or recession but the U.S. economy was chugging along.  The upbeat reports gave the stock market a minor boost but there was little selling of Treasuries, indicating a growing split in sentiment among investors.  George decided to put his and Mabel’s CD money into TLT.

On Wednesday, the Centers for Medicare and Medicaid Services released their annual report on health care costs.  Spending had increased only 3.6% in 2013, the lowest increase since 1960, and the fifth year in a row that spending had grown less than 4%.  Out of pocket expenses had risen from $293 billion in 2007 to $339 billion in 2013, a 16% increase over six years.  Before the recession, George could remember years when spending rose almost that much in a single year.  CMS reported that consumers’ out-of-pocket spending was only 3.2% of charges, less than the 5.9% of charges in 2007.

CMS published a historical table that caused George to raise both eyebrows.  In 1960, Americans spent $125 ($967 in 2012 dollars) per person on health care. In 2012, that figure had grown eight-fold to $7533 per person.  Administrative and public health programs added another 15% to those costs.  In 2013, the total cost per person was over $9500 for a whopping national total of $2.9 trillion spent on health care, almost 18% of GDP.

While families were shelling out more for health care, companies were grabbing a larger share of the economic pie.  As a percent of GDP corporate profits had been trending upward since 1990.

The private payroll processor ADP reported private job gains of 208,000, slightly below expectations but still above the 200,000 mark considered a healthy job market. Later that day came the announcement that a Staten Island grand jury decided that there would be no indictment in the death of Eric Garner.  Caught on video, five or six officers had surrounded the man to arrest him for selling bootleg loose cigarettes.  One of the officers put a choke hold on the unarmed Garner, restricting his breathing till he died of asphyxiation.

Later that day, four Denver bicycle cops were escorting a parade of students protesting the grand jury decision in Ferguson.  Acting as a buffer between the students and traffic on the busy street east of the Capitol, the officers were struck by a Mercedes as it ran through an intersection.  The Mercedes dragged one of the officers about thirty yards and that officer was taken to the hospital in critical condition.  On the evening news, George and Mabel learned that the driver of the Mercedes might have been having a seizure when he hit the officers.

Late Thursday morning, George was focused on several economic reports.  Since 2010, the polling firm Gallup had conducted a simple employment survey, called P2P, that counted the number of people who had worked for money in the past week or had looked for work in the past week.  Gallup reported the lowest unemployment rate, 6.2%, since the poll began.  New jobless claims were one again just under 300,000, indicating that the previous week’s 314,000 might have been an anomaly.  The 4 week average of new claims was still below 300,000.

Friday morning the reporters dusted off their sports dictionaries as they searched for words to describe the monthly labor report from the BLS.  Blockbuster.  Gangbusters. Blowout numbers. Spectacular.  Amazing.  George poured another cup of coffee. Yes, 321,000 new jobs sounded great!!! Too great. George got out his magnifying glass, put on his Sherlock cap and went hunting.  First of all, ADP had reported 208,000 private job gains.  The BLS report included new government jobs which the ADP did not include.  So back out the 7000 new government jobs to get private job gains of 314,000 according to the BLS.  Paging Dr. George, number surgeon.  He took out his skeptical scalpel. Take the average of the two estimates, which was 314 +  208 = 522, divided by 2 = 261.  Add back in the 7000 government jobs and probably the more accurate figure was close to 270,000 – 280,000.  September’s job gains had been revised up 20,000 by both ADP and the BLS. The BLS also revised the job gains of October,  getting closer to the averaging method that George used. Sacre bleu!  Averaging really works!  George was a big believer in averages.

Anyway, the employment report was strong, just not as fantastic as it first appeared. Average monthly job gains for the past year had been about 230 – 240,000.  George picked up his magnifying glass.  Hmmm, he said.  Retail job gains were 50,000, far above the 22,000 average of the past year.  At least 20,000 of those job gains were temporary seasonal gains.  Let’s be generous and start with 280,000 jobs. 280 – 20 = 260.  Now job gains were approaching the average of the past year.

Still, the yearly growth in employment was climbing toward 2%, slowly but surely getting stronger.

Professional and business service jobs had been a leading sector for the past few years and were especially strong this month at 86,000, way above the average gains of 50 – 55,000.  George raised a skeptical eyebrow.  A closer look showed that the strong gains were particularly strong in bookkeeping and accounting.  Take out 20,000 temporary tax jobs, George thought, and now his count was down to 240,000.  Boy, this was quickly becoming an average employment report.

Yearly gains in hourly earnings for the average worker were just under 2.2%, just barely ahead of inflation. For all workers, the gains were 2.1%.

George put away his magnifying glass and put on his rosy glasses.  The average hourly work week had increased .1 hour over the past month, a good sign.  However, that was also the yearly gain.  Not so good.  George cleaned his rosy glasses.  The gains had been fairly broad and the core work force aged 25 – 54 had increased to nearly 96 million.

The construction and manufacturing sectors reported strong gains.  Although the headline unemployment rate remained the same at 5.8%, this rate was more than 1% below last year’s rate, a sign of a relatively healthy labor market.

A wider measure of unemployment, the U-6 rate, had declined .1% but was still above the rates in the mid-2000s.  George needed a better pair of rosy glasses.

George checked to see if the Federal Reserve had updated their Labor Market Conditions Index but that would probably come next week.  The market had risen a few tenths of a percent since the high of two weeks ago.  According to a Fact Set report, earnings growth for the fourth quarter had been revised down from 8.3% to only 3.4%.  After rising up almost 14% since the mid-October trough, the SP500 had stalled despite a number of positive reports.  Treasury bonds had lost a few percent in price since mid-October but had stayed relatively strong, indicating some skepticism toward any further stock gains.  The stock market seemed to be treading water ahead of the December 11th deadline for Congress to pass a spending bill.  Despite promises that there would be no government shutdown this time, investors might be a bit less confident in the dependability of promises from the Republican leadership.

A Week In The Life

September 28, 2014

This past Monday George was out in the backyard when his wife Mabel came out on the back deck to announce that lunch was ready.  From the deciduous vines that grew on the backyard fence George was pulling leaves that had turned an autumn shade of red.

“George, what are you doing?”
“I thought I would pull these leaves off before they fall.  This way I won’t have to stoop so much a few weeks from now to pick them out of the rock garden.  The leaves are getting in the pond and clogging up the filter.”
“Well, come on, dear.  Lunch is ready.  I heard on the radio a little while ago that the market is down.  You know how I worry about that.”
“Oh, really?” George replied.  “It was down last Friday.  Did they give any reason?”
“Something about housing.  I’m sure you’ll find out all about it while you are eating.”

Mabel had set a nice lunch plate of panini bread, cheese and vegetables.  George was a tall man, a big boned man, prone to weight gain in retirement. Although George was fairly fit for his age, she worried about his health, particularly his heart, the male curse.  Mabel made sure that they both ate sensible, healthy meals.

Mabel took her lunch into the living room, leaving George alone in the kitchen.  He liked to check in on the stock market a few hours before the close to get a sense of the direction of the day’s action.  She would have chosen to keep all their savings in CDs and savings accounts but the interest rates were so low that living expenses would slowly erode their principle.

“We’ll put just 25% of our money in the market,” George had told her.  “I’ll watch it carefully and if anything like 2008 happens again, we can pull it out right away.  I’ll know what the signs are.”

George had studied a book on technical indicators which were supposed to help a person understand the direction of the market.  Despite her confidence in George’s ability and sensibility, Mabel still worried.  The stock market had always seemed to her like gambling.

At the kitchen table, George turned on the computer while he chewed his carrots and celery.  He had never been fond of vegetables but found that his likes and dislikes had mellowed with age.  He liked that Mabel cared.  The market helped distract him from the vegetables.  He paged through the daily calendar at Bloomberg, then checked out the headlines at Yahoo Finance. Existing home sales in August had fallen more than 5% from the previous August but that was a tough comparison because 2013 had been a pretty strong year.  Existing home sales were still above 5 million.

Before George had invested some of their savings in the stock market, he had bought several books on how to read financial statements but soon gave up when he realized that knowing the fundamentals of a company would not protect their savings in the case of another meltdown like the recent financial crisis.  Patient though she might be, Mabel would be extremely upset with him if he lost half of his investment in the market.

He then turned to the study of technical indicators which analyzed the behavior of other buyers and sellers in the stock market.  As an insurance adjuster, he had learned C programming back in the 1990s and found a charting program whose language was familiar to him.  As a former adjuster for the insurance of commercial buildings, he was used to making judgments based on a complex interplay of many factors.  He played with several indicators, found a few that seemed to be reliable, but got burned when the market melted down in the summer of 2011.  He got out quickly but not quickly enough for he had lost more than 10% of his investment in the market.  The market healed but at the time it seemed as though there might be a repeat of the 2008 crisis.  Had George and Mabel been younger, George could have just ridden out the storm.  Retirement had made him cautious and the 2011 downturn made George almost as leery of the market as Mabel.

Tuesday was a fine day in late September.  Mabel put her crochet down and made the two of them some soup, with fruit, crackers and cheese.  She took pride in the variety of food that she prepared.  When she walked out on the deck to call George in for lunch, a startled crow took to flight.  George was sitting on the edge of the deck where the crow had been.

“What are you doing, George?”
“I was teaching that little crow how to break open a peanut,” George replied. “I think they learn how to do stuff like that from their parents but I haven’t seen the flock in a few days and this guy was just wandering around the backyard looking for something to eat.  When I gave him a peanut, he didn’t seem to know what to do with it.  He’d pick it up in his beak, then drop it and stare at it.  He pecked at it a few times but that only made the peanut skitter away. “
George held up a branch.  “I carved a claw into the end of this branch and held down the peanut for him.”  George held up half a peanut shell.  “See, he got it figured out.  He flew off when the door opened but I’ll betcha he’ll be back.”
“Well, come on in then.  Lunch is ready.  The market is down again.  Something about housing again.”
“Hmmm,” George grunted and followed Mabel into the kitchen.  “Hmmm, that soup smells good.”
“A little beef vegetable that I doctored up a bit,” Mabel said with a smile.
George gave her a little hug. “I sure like your doctoring.”

He sat down to eat, wondering what all the fuss in the market was.  Checking the Bloomberg Calendar, he saw that it was the House Price index from the Federal Housing Administration that had dampened spirits.  The monthly change was drifting down to zero, a sign of weakness.  Although housing prices were still rising, the rise was slowing down.

A disappointment, George thought, but not a catastrophe.  However, the market had been down for three days in a row.  He finished his lunch and went into the living room.  Mabel was reading a book.
“You know, Mabel, I think it’s just a short term thing.  The bankers from the developed countries met last week and they kinda put out a wake up call to the market.  I think there’s a bit more caution and common sense after that.”
“Well, as long as you’re watching it, dear.”
“You know, we did good this last year,” he reassured her.
“I just worry that it was too good.  We should have taken some of that out of the market and put it somewhere safe.”
 “Well, I’m keeping an eye on it,” he said.  “I checked CD rates last week and they are paying like 1% for a one year CD.  It just ain’t like it used to be. We just have to take some risk.”

They had a 3-year CD coming due in a month. He didn’t want to tell her that he was thinking about not rolling over the CD.  Maybe buy a bond fund.  She wouldn’t like that. For a time he had dabbled in some short to medium term trading but barely broke even.  He had lost sight of his original goal – to keep their savings safe while taking some risk with the money.  Fortunately, this insight had come to him toward the end of 2012.  The market had been mostly up since then, rewarding those who sat out the small downturns.

Late Wednesday morning, Mabel could hear George on the side of the house clearing brush or some such thing.  He said he was going to cut down an elm tree sapling that was growing near the house but when she went out to call him into lunch, he had cut everything but the elm sapling.

“I thought you were going to cut that down, dear.”
“Well, I was but the squirrels are using it to climb up to the old swamp cooler we have perched up there.  You remember the litter from early this spring?  Well, I think there’s another litter in there.  I haven’t seen any young ones but there’s a squirrel carrying twigs up that sapling to the cooler.  She’s even got a piece of one of my rags.  Must’ve fallen out of my pocket.”

Mabel looked up at the platform George had mounted to the side of the house years ago.  On top of the platform sat the old abandoned cooler.  George had meant to take it down and disassemble the platform but then the squirrels had used it as a nursery this winter and neither of them had been able to dismantle it while the little ones were scampering around in and out of the cooler.  Of course, George was supposed to take the cooler down during the summer but never got around to it.  Now she saw that he had tied a cord from the platform to the sapling to bend the sapling close to the platform, making it easier for the squirrel to get from the tree to the platform.

She shook her head and said “George Liscomb, I hope you don’t let that sapling get out of hand.  You know how elm trees are.  They grow faster than a puppy.”
“Well, the tree won’t grow much during the winter and I’ll cut it down in the spring.”
“Ok, well, come on it.  Lunch is ready.  I heard on the radio that the market is up a lot today.  Housing again.  Maybe you were right about it being short term.”
“Well, of course, I’m right,” he made a grand gesture.  “The squirrels will confirm that.”

His lunch plate held some broccoli spears and six, no more and no less, tater tots.  “I know you don’t particularly like broccoli so I thought a few tater tots might ease the pain,” Mabel said with a slightly sardonic smile.

He laughed.  “I’m married to a kind prison guard.”  He sat down at the table, wondering what could have buoyed the market so much.  Housing yet again.  “Holy moly!” he called out to Mabel. He went into the living room to tell her the good news. “Finally, after more than six years, new homes are selling at a rate of more than half a million a year.  That’s what’s got the market dancing.”

On Thursday, she found George working on the stream that he had built in the rock garden.  A few feet from George a squirrel cautiously sipped water from the stream.  The squirrel saw her and scampered up the nearby fence.  “It’s remarkable how comfortable they are with you,” she told him.  “I try to move slowly when I’m working,” George replied. “They seem to be less anxious.”
“What are you doing today?” she asked.
“Got a leak somewhere.  I’ve lost about 15 gallons since last night.  Still haven’t found it.”
“Well, you’re not going to like what going on in the market.  It’s way down today and it’s not about housing.”

He followed her into the house and broke into a big grin when he saw what was for lunch. “Tuna fish!”  Mabel had dressed up her famous tuna fish salad with lettuce, tomatoes, some green onions and put it open faced on some toasted bread.  It was scrumptious.  Not so the market.  The SP500 was down about 1-1/2% on several news releases.  The whopper was that Durable Goods Orders were down 18% in August from the previous month.  But most of that drop was a decline in aircraft orders after a surge in those same orders in July.  Aircraft orders were notoriously volatile. Year-over-year gains in non-defense capital goods, the core reading, were up almost 8%.

The weekly report of new unemployment claims had risen slightly but was still below 300,000.  September’s advance reading of the services sector, the PMI Services Flash, was slightly less than the robust reading of August but still very strong.  So what was causing these overreactions to news releases?  The short term traders execute buy or sell orders within seconds of a news release.  Computer algorithms trade within nanoseconds of the release.  If new unemployment claims are up even by 1, the word “up” or “rise” or some variation will occur within the release.  Sell.  New home sales up?  Up is good for this report.  Buy.  Why would the short-termers be so active this week?  Because they are trading against each other.  The mid and long termers, the portfolio managers, will take the stage at the beginning of next week to adjust their positions at quarter end when funds report their allocations.

Late Friday morning, Mabel stood out on the back deck, her mouth open at the sight of George hunched down as he came out of the shed in the backyard.  Hundreds of wasps swarmed above him.  He knelt down and closed the doors to the shed and hurried to her on the deck.

“My God, George!  Are you all right?”
“Oh, yeah, no worries.  Anything on me?” he asked.
“No.”  There were just a few wasps visible outside the closed doors.  “What on earth?!”
“Well, they’ve really built themselves a city since I was in there last,” George explained.  He sat down on the deck.  The shed was where they kept old tax records and camping gear that they hadn’t used in quite a long time but hadn’t given away or sold – just in case they went camping again.  “I should have sprayed them earlier in the summer but it was such a small hive.  Those doors get sun most of the day so they like it in there.  They’re right above the doorway so they’re not bothering any of our stuff and I was able to stand up in the shed and they just left me alone.”
“I don’t care. What if I had gone out there to get something?!” she said angrily.
“Yeh, you’re right.  I’ll take care of them this weekend.  I was kinda waiting for the cold weather to do its job.”  He held up his hands a couple of feet apart from each other.  “That hive is like this, strung out along the studs that frame the doorway.”
“Why were you out there?” she asked.
“Well, I wanted to see if we still had the box that the TV came in a few years ago.”
“Didn’t you throw it out?” she asked.
“Well, I thought that in case we had trouble with the TV but then the box was behind a bunch of stuff and it was hard to get to and I guess I forgot,” he admitted.
“Well, come on it and eat your lunch.  The market is up again today, I heard them say.”

George settled down at the kitchen table.  A few salami slices, some macaroni salad, carrots, olives and crackers sat on the plate.  “Working man’s antipasto, hey?”
“There are some sardines in there, too” she said.
“I have the best wife and cook in the world.  Anthony Bourdain, move ovah!  Mah honey’s takin’ ovah!”
Mabel laughed.  “Now let me get back to my book.  Second to last chapter and I think the niece did it.  I haven’t trusted her since the first chapter.”

The 3rd estimate of 2nd quarter GDP had been revised up from 4.2% to 4.6%, helping to compensate for the weak first quarter.  Good stuff, thought George.  The U. of Michigan Consumer Sentiment Survey had risen in September to 84.6 from August’s 82.5.  Confident consumers buy stuff, a good sign.  Anything above 80 was welcome and more was better.  To round out the daily trifecta of news releases, corporate profits for the second quarter were revised upward.  The year over year gain without inventory and depreciation adjustments was 12.5%.  Not spectacular but solid.

Even with Friday’s triply good news, the market closed below what it opened at the previous day.  This was usually an indication that the short term downward trend in the market might have a little way to run.  Then he promised Mabel that he would get rid of the wasps this weekend, and yes, he would be careful.  Did she remember seeing the wasp spray that he bought earlier that summer?

GDP, Profits, Inflation

December 22nd, 2013

Merry Christmas!

Last week I reviewed several decades of trends in corporate profits, as well as the 1990 change in measuring inflation that has helped increase corporate profits as a share of GDP.   (For those of you interested in the inflation controversy, here is an article that provides some additional insight.)  This week I’ll look at patterns in the economic growth of this country that sheds some light on recent events and provides some context to understand ongoing trends.

During the 30 years following World War 2, the economy grew at an annual rate of 3.7% after inflation.  Population growth was about 1% per year.  Productivity growth was about 1 – 1.5%.  Government spending, including debt, grew a bit more than 1%.  The chart below shows the compounded annual growth rate.

But I think the story is more clearly told by a different chart constructed from the same data.  The growth rate trend is more easily visible and it is the change in this trend that I will be focusing on.

During the 1970s, an economic trend known as staflation increasingly took hold. This period of high inflation, coupled with slowing growth and growing unemployment, was not thought possible by economists using theories proposed by John Maynard Keynes in the 1930s, during the Great Depression.  In 1974, economist Arthur Laffer first sketched out a theory that tax cuts would stimulate the economy.  As the Federal debt began to rise in the mid to late 1970s, few wanted to take a chance that lower tax rates would produce more revenue for the Federal Government.

The 1980s began with back to back recessions and the highest unemployment since the 1930s Depression. Big spending and tax cuts during the 1980s dramatically increased the federal debt but did little  to spur growth.

During this 13 year period, profit growth slowed to 2.4%.  The myth that the 1980s was a high growth era continues to live in the minds of political pundits.  In a WSJ op-ed on Dec. 18th, Daniel Henninger referred to “the high-growth years of the Reagan presidency.”  Myths live on because they serve a purpose to those who cherish them.  The cardinal rule of politics is “Disregard the Data.”

In 1990, economists at the BLS adopted what is called a hedonic methodology to computing the CPI.  Used by other OECD countries, this supposedly more accurate assessment of the growth of inflation shows a lower growth rate of inflation.  This naturally increases the growth rate of inflation adjusted GDP. (GDP dollars each year are divided by the inflation rate to get the real growth rate.)

The conventional narrative is that the 1990s was an explosive growth period of new technology and growing globalization.  From the beginning of 1990 to the start of 2000, stock market values grew four times.  After the bursting of the internet bubble, 9-11, and the recession of 2001, the economy recovered.  By the mid-2000s, the unemployment rate was less than 5%.  While that may be the conventional narrative, the growth of the economy from 1990 to 2007 was just as slow as the period 1978 – 1989.

Remember that this slow growth would have been even slower if the BLS had not changed their methodology for measuring inflation.  To recap, the 30 year real growth rate of GDP after WW2 was 3.7%.  The following 30 year growth rate was 2.3%.  But that later 30 period is marked by a sharp rise in consumer borrowing.   Without that escalation in borrowing, growth would have been meager.

Families with two incomes borrowed against their homes, drove up the balances on their credit cards and still GDP growth was slow.  Let’s construct a fairy tale, what economists call a counterfactual.  What if the BLS had not changed to this new methodology in 1990?  What would be the growth rate of GDP using an alternate measure of inflation?

The resulting growth pattern is 0% for the 18 year period and is more consistent with the experiences of many workers and families in this economy.  The change in the measurement of inflation has greatly helped mid-size and large size companies.  An understated inflation rate reduces labor costs by reducing cost of living adjustments to salaries and wages.  In addition, companies can borrow at lower rates since many corporate bonds are tied to the inflation rate.  American companies did not engineer this revised methodology of measuring inflation but they have been the largest beneficiaries of the new policy.

In 2008, the financial poop in the popcorn popper began to pop.  In the past 5+ years, we have experienced less than 1% real growth, not enough to keep up with population growth.  Of course, most people are wondering “what growth? It sure doesn’t feel like growth!”

The story may be told more accurately by looking once again at a comparison of inflation adjusted GDP with an alternate version of GDP, one that more realistically reflects inflationary pressures.  This chart shows a decrease of 2% per year.

Did the BLS adopt this methodology under political pressure?  Perhaps.  More likely, it was an alignment of econometric theory with political and corporate interests.  The reduction in published inflation rates did slow the growth of payments to Social Security recipients and reduced Medicare payouts to physicians and hospitals, thus shrinking budget deficits.  The government saves money, corporations make extra money, but – quietly and slowly – families lose money.

Annual cost of living adjustments to Social Security checks have been reduced but the decreased income has forced more seniors to seek assistance through the food stamp program, now called SNAP.  A politically neutral change in the measurement of inflation thus becomes a way for politicians to introduce a means testing component to Social Security income.  Instead of reducing payments based on income, payments are reduced to all recipients and poor seniors are targeted for additional benefits.  Congress has increased eligibility for the food stamp program so that seniors who are dependent on that extra income can receive it in the form of food stamps.  If the BLS had not changed their methodology, seniors would receive appoximately 60% more each month and many wouldn’t need the food stamps in the first place.

With this history in mind, let’s turn to this week’s revisions of GDP and corporate profits for the third quarter ending in September.  The real, or inflation-adjusted, growth of 3rd quarter GDP was raised to a 4.1% annualized growth rate in the third quarter, largely on upward revisions of consumer spending.  Contributing to stronger GDP growth has been a worrisome increase in company inventories, which probably influenced the Federal Reserve’s decision this week to keep any tapering of their QE bond purchases to a minimum.

Corporate profits for the third quarter were revised higher as well.  As a share of GDP, corporate profits continue to reach all time highs.

How likely is it that economists at the BLS will change their methodology to reflect inflationary pressures before we make choices in response to rising prices?  The subject is not easily encapsulated in a sound bite or a short slogan on a placard.  In the 1992 presidential race, independent candidate Ross Pierot was able to use charts to make a point with many voters but few politicians are very good at the easel and unlikely to bring up the subject in the public forum.  Families and workers will continue to suffer and politicians will create more social benefit programs to help those hurt by problems that politicians themselves have either created or failed to address.  Large and mid sized businesses will continue to enjoy the additional slice of pie.

Investing, New Orders, Small Business

December 4th, 2013

This will be a mid-week post of various items I thought were interesting.  The private payroll processor ADP is showing private employment growth 215,000, about 15% above expectations.  This weekend, I’ll cover the employment situation and some long term trends.

***************************
When we buy bonds, we are buying someone’s debt. Really what we are buying is the likelihood that they will pay that debt.  When we buy stocks, we are buying someone’s profits – or the future prospects of those profits.  The S&P500 is an index of the 500 largest domestic corporations.  The BEA tracks the profits of all domestic corporations, not just the 500 largest, before tax adjustments. It is rather interesting to look at the ratio of the SP500 index to corporate profits, in billions.

Using this metric, the exuberance of the internet bubble is striking, far surpassing the housing bubble of the 2000s. It was a time when investment was high in the new digital economy.  The ingenuity of man had finally overcome the business cycle.   The ratio of stock prices to profits didn’t matter because profits were about to go through the roof, man!

Well, it would take a while but eventually profits did go through the roof.  It took a few years.  As a percentage of the nation’s GDP, corporation profits are near 11%.

So pick the story you want to tell.  1) Stocks are undervalued based on historical ratios of prices to profits.  2) Stocks are going to crash because corporate profits are too much a percentage of the economy, an unsustainable situation.  Both narratives are out there in the business press.

*************************************************

New orders for non-defense capital goods excluding aircraft has been declining of late.

Below is a chart showing the year over year percent gains in new orders and the SP500 index.  There is a loose correlation.  The stock market is usually responding to predictions of future activity as well as political and financial news.   I modified the changes in the SP500 by a little more than half to show the overall trend.

******************************************

In 2012, households finally surpassed 2007 levels of net worth.   In the past five years, household assets have risen by a third, more than $14 trillion dollars. More than half of that increase is the rise in stock asset values. In that same period, liabilities have decreased slightly from the $20 trillion.  All of the decrease and more is in mortgages.  This table shows the unsustainable growth in net worth during the housing boom.

Check out the growth in household debt during the housing boom.  Over 10% per year!  Now look at the growth in Federal debt.  There are only two years where it falls below 5%.  Someone once said something like “What can’t go on forever, won’t”.  How long can a government increase its debt 4x, 5x, 10x the rate of inflation or the rate of economic growth?

***********************************

A short and very informative book on investing by William Bernstein.

Deep Risk: How History Informs Portfolio Design (Investing for Adults)
William Bernstein

*************************************

Words of caution:

“A government big enough to give you everything you want is a government big enough to take from you everything you have.” – Gerald Ford

****************************************

Gallup’s survey of consumer spending in November was the strongest November in 5 years.  On the other hand, early reports of the y-o-y gains in retail spending over the 4 day Thanksgiving weekend indicated a meager 2.3%, barely above inflation.  Same store sales at department stores declined -2.8% in the Thanksgiving/Black Friday week, although they are up 2.5% year over year.  As I wrote about two weeks ago, online shopping is now a significant portion, 20%, of total retail sales.  A more complete feel for the consumer’s mood must include sales on Cyber Monday, the Monday after Thanksgiving.  These showed exceptional gains of 17% over last year’s numbers.

****************************************

ISM’s Manufacturing index was 57.3, the strongest in 2-1/2 years.  I’ll update the CWI after I input today’s numbers from the non-manufacturing report.  I was expecting a slight tapering in the composite.  As we saw a few weeks ago, there has been a positive wavelike action and it appeared as though the economy had hit a crest in October.

****************************************

In 2010, the Census Bureau reported that there were 5.7 million employers (those with payroll, as opposed to sole proprietors), a decrease of 300,000 from the 6 million employers the Census Bureau counted in 2007.  About 5.1 million employers had less than 20 employees and accounted for 14% of the $5 trillion in payroll. Those small to mid-size companies with 20 to 99 employees accounted for another 14% of payroll.  Mega-employers, those with 500 or more employees, paid out about 57% of total payroll in 2010 and constitute a little more than half of private employment.  These large employers naturally have more influence on policy makers in Washington and in state capitols throughout the nation.

 *****************************************

The National Federation of Independent Businesses’ (NFIB) recent monthly survey reported a fairly sharp decline in sentiment among small business owners. A hopeful sign in this report is the improvement in expectations for future sales.  Sentiment was particularly depressed over the shenanigans in Washington and pessimism towards the regulatory environmnent is near all time highs. A blend of small cap stocks has risen about 36% in the past year.  Small cap value stocks have soared 40%.

*****************************************
An interesting historical note from the Social Security administration.  As  preamble, Social Security taxes are collected and put in a “separate” accounting fund before they are immediately “borrowed” for the general spending needs of the Federal government.

 President Roosevelt strenuously objected to any attempt to introduce general revenue funding into the program. His famous quote on the importance of the payroll taxes was: “We put those payroll contributions there so as to give the contributors a legal, moral, and political right to collect their pensions and unemployment benefits. With those taxes in there, no damn politician can ever scrap my social security program.” 

In 1937, the Supreme Court ruled that the Social Security Act was constitutional.  The majority opinion, penned by Justice Cardozo: “The hope behind this statute [the Social Security Act] is to save men and women from the rigors of the poor house as well as from the haunting fear that such a lot awaits them when journey’s end is near.”

**************************************

Quite often, our auto or homeowner’s insurance company changes insurance plans on us.  The insurance company sends us a notice that, due to legislative changes or revised company policy, there is a new codicil to all insurance contracts.  Premiums may go up.  The insurance company’s liability may be reduced. Your old plan is being cancelled and reissued with a “-1A” after the policy number. Some of us may skim read the new changes, most of us shrug and sign the new contract and that is the end of the story.  Imagine the headlines: “MINIMUM DEDUCTIBLE RAISED TO 1% OF HOME’S VALUE.  ALL HOMEOWNERS’ INSURANCE CONTRACTS CANCELLED.”  This is what happens.  The old insurance contract is no longer available.

What is the response when the same thing happens to private health insurance  plans under Obamacare?  “Obamacare Forces over 800,000 in N.J. to change insurance plans” is the bold caption of one news story.  People who are unsympathetic to the new health care law will not make the distinction between “insurance plan” and “insurance carrier.”

Corporate Profits and New Orders

Wednesday’s release of durable goods orders showed a rather large downward revision to July’s data and an increase in August’s orders.  The transportation component makes the overall reading of this report quite volatile.  A more consistent read is gained by excluding transportation and defense goods, which showed a less dramatic 3.3% decline in July, followed by a slight increase of 1.5% in August.  The year on year increase is 7.6%.

In nominal dollars, not adjusted for inflation, we have reached the level of new orders before the recession began in late 2007 – early 2008.  Had the economy stayed “on trend” new orders would be over $84 billion this year.

When adjusted for inflation, we are at about 2006 levels – seven years of no net growth.

Second quarter corporate profits are up almost 6% and have tripled in the past ten years.

Despite all the daily and weekly responses to political as well as economic news, the SP500 stock market index essentially rides the horse of of corporate profits.  The market’s fluctuations reflect changing current expectations of future profits.  Except for the “irrational exuberance” of the late 90s, there is a remarkable correlation between the SP500 and corporate profits.

Focusing on the past ten years, we can see these two forces as they dance around each other.   As sales and profit emerge over each quarter, companies guide analysts estimates of profits up and down.  The market renegotiates its value based on these revisions of emerging profit estimates.  As a rule of thumb, an investor with a mid term horizon of 1 – 3 years might grow wary when these trends diverge as they did in the late 90s and 2006 – 7.


As a percent of the total economy, profits have doubled over the past ten years.  At the trough in 2008, when some financial pundits were forecasting the end of capitalism, profits as a percent of GDP were at the 25 year average.  Investors had become used to this lop-sided economy where corporations grab more of the economic pie.

A growing share of profits is earned overseas; that growing globalization and two decades of effective lobbying have enabled corporations to lower the tax bite on those profits.

The taxation of corporations is a two-edged sword.  One effect of more taxes for corporations means less dividends to investors, who probably pay taxes at a higher rate than the effective rate of corporations.  During the 1980s and 90s, dividends averaged around 40 – 50% of earnings after taxes.  In the past decade and especially after the cash crunch of 2008, corporations have retained more of their earnings as an emergency cash cushion, paying investors about 30 cents on each dollar of earnings.  That rush to safety will probably reverse itself in the coming years, prompting corporations to pay out more in dividends as a percent of profits.

There may be volatility in the market in the coming days and weeks as Congress wrestles over the funding and implementation of the health care act, threatening to shut down most non-essential functions of the entire government.  A similar budget battle in late July and August of 2011 was accompanied by an almost 20% drop in the market.  The longer term trend is told by the rise in corporate profits, by the rise in industrial production and by the rise in new orders.  A move downward in the market may be a good time to put some cash to work, or to make that IRA contribution for 2013.