The Homeowners’ Association

August 18, 2019

by Steve Stofka

Two quick asides before I get into this week’s topic. A cricket perched on the top of a 7′ fence. It drew up to the edge of the top rail, learned forward, raised its rear legs as though to jump, then settled back. It did this twice more before jumping 8′ out then down into a soft landing on some ground cover. How far can crickets see, how often do they injure a leg if they land incorrectly and do they get afraid?

The bulk of the personal savings in this country is held by the top 20% of incomes, and it is this income group that received the lion’s share of the 2017 tax cuts. It’s OK to bash the rich but that top 20% probably includes our doctor and dentist. Before you start drilling or cutting me, I want to make it perfectly clear that I was not criticizing you, Doc.

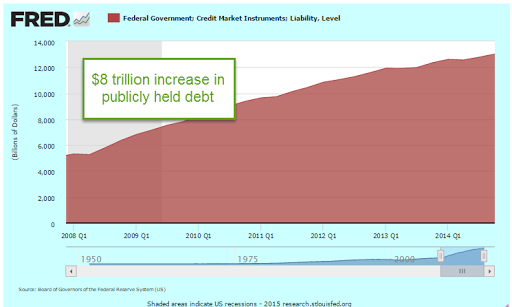
In 2016, the top quintile – the top 20% – earned 2/3rds of the interest and dividend income (Note #1). Due to falling interest rates over the past three decades, real interest and dividend income has not changed. Real capital has doubled and yes, much of it went to those at the top, but the income from that capital has not changed. That is a huge cost – a hidden tax that gets little press. The real value of the public debt of the Federal Government has quadrupled since 1990, but it pays only 20% more in real interest than it did in 1990 (Note #2). Here’s a graph of personal interest and dividend income adjusted to constant 2012 dollars. Thirty years of flat.

Ok, now on to a story. Economists build mathematical models of an economy. I wanted to construct a story that builds an economy that gradually grows in complexity and maybe it would help clarify the relationships of money, institutions and people.

Let’s imagine a group of people who move into an isolated mining town abandoned several years earlier. The houses and infrastructure need some repairs but are serviceable and the community will be self-sufficient for now. The homeowners form an association to coordinate common needs.

The association needs to hire lawn, maintenance and bookkeeping services, and security guards to police the area and keep the owners safe.  How does the association pay for the services?  They assess each homeowner a monthly fee based on the size of the home. How do the homeowners pay the monthly fee?  Each homeowner does some of the services needed. Some clean out the gutters, others fix the plumbing, some keep the books and some patrol the area at night. They work off the monthly fee.

How do they keep track of how much each homeowner has worked? The association keeps a ledger that records each owner’s fee and the amount worked off. The residents sometimes trade among themselves, but it is rare because barter requires a coincidence of wants, as economists call it. Mary, an owner, needs some wood for a project and Jack has some extra wood. They could trade but Mary doesn’t have anything that Jack wants. He tells Mary to go down to the association office and take some of her time worked off her ledger and credit it to Jack’s monthly fee. Mary does this and they are both happy (Note #3).

As other owners learn of this idea and start trading work credits, the association realizes it needs a new system. It prints little pieces of paper as a substitute for work credits and hands them out to owners who perform services for the association. These pieces of paper are called Money (Note #4).

The money represents the association’s accounts receivable, the fees owed and accruing to the association, and the pay that the association owes the owners for the work they have done. Then the association notices that there are some owners who are not doing as well as others. It assesses an extra fee each month from those with larger homes and gives that money to needy homeowners.  These are called transfers because the owners who receive the money do not trade any real goods or services to the association. In this case the association acts as a broker between two people. Let’s call these passive transfers. We can lump these transfers together with exchanges of goods and services.

Then some people from outside the area start stealing stuff from the homeowners. The association needs to hire more security guards, but homeowners don’t want to pay a special one-time assessment to pay for the extra guards.

Instead of printing more Money, the association prints pieces of paper called Debt. Homeowners who have saved some of their money can trade it in for Debt and the association will pay them interest. Homeowners like that idea because Money earns no interest and Debt does. The association uses the Money to pay for the extra security guards.

But there are not enough people who want to trade in their Money for Debt, so the association prints more Money to pay the extra security guards.

Let’s pause our story here to reflect on what the words inflation and deflation mean. Inflation is an increase in overall prices in an economy; deflation is a decrease (Note #5). Inflation occurs when the supply of money fuels a demand for goods and services that is greater than the supply of goods and services. Ok, back to our story.

So far so good. All the Money that the association has printed equals a trade or a passive transfer. Let’s say that the association needs more security guards and no one else wants to work as a security guard because they can make more Money doing jobs for other homeowners. The association makes a rule called a Draft. Homeowners of a certain age and sex who do not want to work as security guards will be locked up in the storage room of the community center.

Now there’s a problem. Because the association has taken some homeowners out of the customary work force, those people are not available for doing jobs for other homeowners, who must pay more to contract services. This is one of several paths that leads to inflation. To combat that, the association sets price controls and limits the goods that homeowners can purchase. After a while, the outsiders are driven off and the size of the security force returns to its former levels.

Now all the extra Money that the association printed to pay for the security force has to be destroyed. As homeowners pay their dues, the association retires some of the money and shrinks the Money supply. However, there is a time lag, and prices rise sharply (Note #6).

Over the ensuing decades, there are other emergencies – flooding after several days of rain, a sinkhole that formed under one of the roadways, and a sewer system that needed to be dug up and replaced. The association printed more Debt to cover some of the costs, but it had to print more Money to pay for the balance of repairs. Because the rise in the supply of Money was a trade for goods and services, inflation remained tame.

There didn’t seem to be any negatives to printing more Money, so the homeowners passed a resolution requiring that the association print and pay Money to homeowners who were down on their luck. These were active transfers – payments to homeowners without a trade in goods and services and without some offsetting payment by the other homeowners.

So far in our story we have several elements that correspond with the real world: currency, taxes, social insurance, the creation of money and debt and the need to pay for defense and catastrophic events. Let’s continue the story.

With the newly printed Money, those poorer homeowners could now buy more goods and services. The increased demand caused prices to rise and all the homeowners began to complain. Realizing their mistake, they voted on an austerity program of higher homeowner fees and lower active transfers to poorer homeowners.

Because homeowners had to pay higher fees, they didn’t have enough extra Money to hire other services. Some residents approached the association and offered to repair fences and other maintenance jobs, but the association said no; it was on an austerity program and cutting expenses. Some residents simply couldn’t pay their fees and the problem grew. The association now found that it received less Money than before the higher fees and Austerity program. It cut expenses even more, but this only aggravated the problem.

Finally, the association ended their Austerity program. They printed more Money and hired homeowners to make repairs. Several homeowners came up with a different idea. There is another housing development called the Forners a few miles away. They are poorer and produce some goods for a lower price. The homeowners can buy stuff from the Forners and save money. There are three advantages to this program:

  1. Things bought from the Forners are cheaper.
  2. Because the homeowners will not be using local resources, there will be less upward pressure on prices.
  3. The homeowners will pay the association for the goods bought from the Forners and the association will pay the Forners community with Debt, not Money. Since it is the creation of Money that led to higher prices, this arrangement will help keep inflation stable.

As the homeowners buy more and more stuff from the Forners, the money supply remains stable or decreases. After several years, homeowners are buying too much stuff from the Forners and there is less work available in the community. As homeowners cannot find work, they again fall behind in paying their monthly fees.

Several of those in the association realize that they don’t have enough Money to go around in the community. There is a lot to do, and the homeowners draw up a wish list: repairs to the roads and helping older homeowners with shopping or repairs around their home are suggested first. A person who is out of work offers to lead tours and explain the biology of trees for schoolchildren. The common lot near the clubhouse could use some flowers, another homeowner suggests. I could use a babysitter more often, one suggests, and everyone nods in agreement. I could teach a personal finance class, a homeowner offers. Another offers to read to homeowners with bad eyesight and be a walking companion to those who want to get more exercise.

Everyone who contributes to the welfare of the community gets paid with Money that is created by the association. What should we call the program? One person suggests “The Paid Volunteer Program,” and some people like that. Another suggests, “The Job Guarantee Program” and everyone likes that name so that’s what they called it (Note #7).

So far in this story we have two key elements of an organized society:

  1. Money – a paper currency created by the homeowner association.
  2. Debt – the amount the association owes to homeowners (domestic) and the Forners (international).

Next week I hope to continue this story with a transition to a digital currency, banks and loans.

//////////////////////

Notes:

  1. In 2016, the top 20% of incomes with more than $200K in income, earned more than 2/3rds of the total interest and dividends. IRS data, Table 1.4
  2. In 2018 dollars, the publicly held debt of the Federal government was $4 trillion in 1990, and $16 trillion now. In 2018 dollars, interest expense was $500B in 1990, and is $600B now.
  3. In David Graeber’s Debt: The First 5000 Years, there is no record of any early societies that had a barter system. They had a ledger or money system from the start.
  4. In the Wealth of Nations, Adam Smith – the “father” of economics – defined money as that which has no other value than to be exchanged for a good. This essential characteristic makes money unique and differentiates paper money from other mediums of exchange like gold and silver.
  5. An easy memory trick to distinguish inflation from deflation. INflation  = Increase in prices. DEflation = DEcrease.
  6. The account of the increased force of security guards – and its effect on prices and regulations – is the simple story of money and inflation during WW2 and the years immediately following. The process of rebalancing the money supply by the central bank is difficult. Monetary policy during the 1950s was a chief contributor to four recessions in less than 15 years following the war.
  7. A Job Guarantee program is a key aspect of Modern Monetary Theory.

Green Debt

March 17, 2019

by Steve Stofka

Imagine a world where, each year, the U.S. government (USG) gave $1000 to each of it’s approximately 300 million citizens (Note #1). The annual cost of the program would be $300 billion, about $120 billion more than the 2017 tax cuts (Note #2). As it does every year, the USG would borrow the money and issue Treasury bills, which are traded around the world. Although there is more than $23 trillion of Treasury debt – a plentiful supply – there is not enough to meet world demand.

Let’s say that the American people spent 80% of that $300 billion each year and saved the rest (Note #3). Let’s also calculate a multiplier of 1.5 so that the extra $240 billion of spending generates $360 billion of GDP (Note #4), about 1.7% of last year’s GDP. The increase in GDP would return about $60 billion to the USG in tax revenues (Note #5). The net cost to the USG is $300 billion less $60 billion in additional tax revenue = $240 billion.

Will the slight increase in GDP each year generate higher inflation? Inflation occurs when too much money chases too few goods and resources. Efficiencies in world production of goods and services has caused a continuing deflation in developed economies. Against those headwinds, inflationary pressures will be modest.

At the end of ten years, this program would create an additional $3.5 trillion in U.S. debt, the same amount of debt that the Federal Reserve accumulated in 2008 to protect the jobs and bonuses of Wall St. bankers. The Fed still owns most of that debt (Note #6). Which is fairer? A program to distribute money equally to everyone or a program to distribute the same amount to a select few?

Implementation of such a program is unlikely but illustrates the lack of a moral rudder in our Congress. Self-branded fiscal conservatives in both parties promote the fiction that the Social Security and Medicare funds will “run out of money” at a certain date in the future. These funds are part of the Federal government and are nothing more than bookkeeping entries on the Federal government’s books. The Social Security Administration explains this: “[the funds] provide 1) an accounting mechanism for tracking all income to and disbursements from the trust funds, and (2) they hold the accumulated assets. These accumulated assets provide automatic spending authority to pay benefits” [my emphasis] (Note #7). The accumulated assets are paper IOUs from the government to itself so that Social Security benefits are beyond the reach of Congressional infighting and debate each year. When it was created, President Roosevelt called Social Security an insurance program because it was insured against Congressional tampering.

Republicans propose to privatize Social Security while Democrats propose additional taxes to “fully fund” Social Security. These schemes are built on accounting fictions and sold to the general public as prudent solutions. Will the trust funds run out of money? Congress can change this with a stroke of a pen. Just as they “borrowed” from the funds, they can “loan” to the funds (Note #8). Both parties are trying to convince voters that big changes must be made because Congress is too incompetent to make a small legislative change. Will voters buy this nonsense and let them keep their jobs?

Around the world, the value of US Treasury debt is more trusted than gold. It is more than a bond because it trades among commercial banks like currency. The U.S. enjoys a unique position. Its debt is a trusted part of the world’s savings. This country has worked hard and prudently to make the U.S. dollar the world’s money. Over the past century, the U.S. has managed its economy and debt better than other large developed countries. Let us take advantage of that position. Let’s stop the political ploys around Social Security and other federal entitlement programs. Let’s have a serious discussion about investing in building new schools and transportation solutions, as well as needed infrastructure repairs. Let’s stop posturing like buffoons and start behaving like the leader we are.

//////////////////////
Notes:

1. Census Quick Facts
2. Annual loss of tax revenue about $180 billion times 10 years = $1.8 trillion per CBO estimate 
3. Americans usually save about 5% of income.
4. More on fiscal multipliers. 1.5 is an average of various multipliers.
5. USG revenues average 17% of GDP.
6. Fed’s balance sheet over time. The Fed buys Treasury debt in the secondary market from large banks that buy the debt at Treasury auctions. The Fed continues to hold $1.6 trillion of mortgage-backed securities, the same kind of debt that led to the Financial Crisis. Current balance sheet.
7. Social Security Administration FAQ #1 on the nature of the funds . Also, see their page debunking SS myths promoted on the Internet
8. The Federal government pays below market interest rates for the money that it “borrowed” from the SSA funds. Decades ago, the interest rate was set at approx. the five-year average for funds “borrowed” for several decades. If 20 or 30 year rates had been used, the SS funds would be much larger. There would be no “crisis” to argue about.

Intervention

August 27, 2017

Pew Research surveyed four generations of Americans, from the oldest Americans who are part of the Silent Generation, those who grew up during the Great Depression, to the Millennials, those born between the years 1983 – 2002. Pew asked the respondents to list ten events (not their own) or trends that happened during their lifetime that had the most influence on the country. 9-11 was at the top of the list for all four generations. Obama’s election, the tech revolution and the Iraq/Afghanistan war were the other events common on each list. Some differences among the generations were understandable. Some were a surprise to me. The Great Recession/Financial Crisis of 2008 was only on the Millennials list. Many in this generation were in the early stages of their careers when the recession began. Here is a link to the survey results. Perhaps you would like to make your own list. Keep in mind that the events must have happened during your lifetime.

I don’t think that the Boomer generation understands the long-term impact of the Great Recession. In another decade, many will discover how vulnerable the financial crisis left all of us, not just the Millennials. As we’ll see below, the crisis may be over but the response to the crisis is ongoing.

One of the trends common to each generation’s list was the tech revolution, which has reshaped much of the economy just as the last tech revolution did in the 1920s. The widespread use of electricity, radio and telephone in that decade transformed almost every sector of the economy and accelerated the mass migration of the labor force from the farm to the city.

Like today, a small number of people made great fortunes. Like today, the top 1% of incomes accounted for about 15% of all income (Saez, Piketty). The GINI index, a statistical measure of inequality of any data set, has risen significantly since 1967 (Federal Reserve). The GINI index ranges from 0, perfect equality, to 1, perfect inequality. Incomes in the U.S. are more equal than South Africa, Columbia and Haiti (Wikipedia) but we are last among developed countries.

For several decades, Thomas Piketty and Emmanuel Saez have collected the aggregate income and tax data of developed countries. Piketty is the author of Capital in the Twenty-First Century (Capital), which I reviewed here.  A recent NY Times article referenced a report from Piketty and Saez comparing the growth of after-tax, inflation-adjusted incomes from 1946-1980 (gray line labeled 1980) and 1980-2014 (red line labeled 2014). I’ve marked up their graph a bit.

IncomeGrowth1947-2014
The authors calculated net incomes after taxes and transfers to determine the effect of tax and social policies on income distribution. Transfers include social welfare programs like Social Security, TANF, and unemployment. Census Bureau surveys of household income include pre-tax income and it is these surveys which form the basis for the calculation of the GINI index and other statistical measures of inequality.

I am guessing that Piketty and Saez used their database of IRS post-tax income data then adjusted for transfer income based on Census Bureau surveys. The Census Bureau notes that people underreport their incomes on these surveys.  Is the IRS data more reliable?  Probably, but people do hide income from the IRS. Both Piketty and the Census Bureau note that the data does not capture non-cash benefits like food stamps, housing subsidies, etc.

From 1947 to the early 1960s, the very rich paid income tax rates of 90% so that would seem to explain the after-tax income data from Piketty and Saez. The federal government took a lot of money from the very rich, paid off war debts, built highways, flew to the moon and built a big defense network to fight the Cold War.  Those infrastructure projects employed the working class at a wage that lifted them into the middle class. So that should be the end of the story. High taxes on the rich led to more equality of after-tax income.

But that doesn’t explain the pre-tax income data from the Census Bureau. The very rich simply made less money or they learned how to hide it because of the extremely high tax rates.  In the Bahamas and Caymans, there grew a powerful financial industry devoted to hiding income and wealth from the taxman. In the first years of his administration, President Kennedy, a Democrat, understood that the extremely high tax rates were hurting investment, incentives and economic growth.  He proposed lowering both individual and corporate rates but could not get his proposal through the Congress before he died.  Johnson did push it through a few months after Kennedy’s death. The rate on the top incomes fell from 91% to 70%, still rather high by today’s standards.

An important component of income growth in the post war period from 1947-1970 was the lack of competition from other developed countries who had to rebuild their industries following World War 2. These two decades were the first when the government began collecting a lot of data, and this unusual period then became the base for many political arguments. Liberal politicians like Bernie Sanders and Elizabeth Warren advocate policies that they promise will return us to the trends of that period. It is unlikely that any policies, no matter how dramatic, could accomplish that because the rest of the world is no longer recovering from a World War.

We could enact a network of social support policies that resemble those in Europe but could we get used to a 10% unemployment rate that is customary in France? For thirty years beginning in the early 1980s, even Germany, the powerhouse of the Eurozone, had an unemployment rate that exceeded 8%. At that rate, many Americans think the economy is broken. Despite 17 quarters of growth, unemployment in the Eurozone is still 9.1%. Half of unemployed workers in the Eurozone have been unemployed for more than a year. In America, that rate of long term unemployed is only 13% (WSJ paywall).

The post-war period was marked by high tax rates and high federal spending, a period of robust government fiscal policy.  The federal government intervenes in the economy via a second channel – the monetary policy conducted by the central bank.  The Federal Reserve lowers and raises interest rates, and adjusts the effective money supply by the purchase or sale of Treasury debt.

The 1940s, 1970s and 2000s were periods of high intervention in both fiscal and monetary policy. The FDR, Truman, Eisenhower, Johnson and Nixon administrations exerted much pressure on the Fed to help finance war campaigns and the Cold War. In 1977, the Congress ensured more independence to the Federal Reserve by setting two, and only two, clear objectives that were to guide the Fed’s monetary policy in the future: healthy employment and stable inflation.

A rough guide to the level of central bank intervention is the interest rate set by the Fed. When rates are less than inflation, the Fed is probably doing too much in response to some acute or protracted crisis.

EffFundsRate-Infation

Let’s look at an odd – or not – coincidence. I’ll turn to the total return from stocks to understand the effects of central bank policies. There are two components to total return: 1) price appreciation, and 2) dividends. When price appreciation is more than 50% of total return, economic growth and company profits are doing well. Future profit growth looks good and more money comes into the market and drives up prices. When dividends account for more than half of total return, as it did in the 1940s and 1970s, both GDP and company profit growth are weak. Both decades were marked by heavy central bank and government intervention in the economy.

Here’s a link to an article showing the total return on stocks by decade. During the 2000s, the total return from stocks was below zero. An average annual return of 1.5% from dividends could not offset an annual loss of 2.4% in price appreciation. Hubris and political pressure following 9-11 led Fed Chairman Alan Greenspan to make several ill-advised interest-rate moves in the early 2000s that helped fuel the housing boom and the ensuing financial crisis. His successor, Ben Bernanke, continued the policy of heavy intervention. Following the financial crisis, the Fed kept interest rates near zero for nine years and has only recently begun a program of gradually increasing its key interest rate.

The price gains of the 2010s have lifted the average annual return of the past 18 years to 7.4%, and the portion from dividends is exactly half of that, at 3.72% per year.  It has taken extraordinary monetary policy to rescue investors, to achieve balanced returns  that are about average from our stock investments.  Some investors are betting that the Fed will always come to the rescue of asset prices.  That same gamble pushed the country to the financial crisis when the government did not rescue Lehman Brothers in September 2008.

The financial crisis should have been on each generation’s list.  Within ten years it will be.  It is still crouched in the tall grass.

///////////////////////////

Debt

Happy days are here again.  Yes, girls and boys, it’s time to raise the debt ceiling!  By the end of September, the Treasury will run out of money to pay bills unless the debt ceiling is raised. This past week, President Trump hinted/threatened that he would not sign a debt increase bill unless it included money to build the wall between the U.S. and Mexico.

The Congress has not had a budget agreement in several years and is unlikely to enact one this year. People may sound tough on debt but a Pew Research study
showed that a majority do not want to cut government programs, including Medicaid.

Liberal economists insist that government debt levels don’t matter if the interest on the debt can be paid. This article from Pew Research shows the historically low rate on the federal debt. However, Moody’s reports that the U.S. government pays the highest interest as a percentage of revenue among developed countries. As a percent of GDP, we are 4th at 2.5%.

Confidence Up

April 2nd, 2017

The Conference Board’s survey of Consumer Confidence shot up to 125, a 16 year high. Unfortunately, that previous high was set as the dot-com frenzy was nearing its end and just before the start of the 2001 recession. History could not possibly repeat itself, could it?

Confidence201703

There have been other frenzies in the past decades: the dot-com boom of the late ’90s, the housing and consumer debt boom of the ’00s, the run up in gold prices in the ’10s, the spike in interest rates in the late ’70s – eary ’80s. In the rear view mirror, the correction seems predictable.

From 1995 – 2000, the SP500 index tripled on the giddy expectations of a new global internet economy. Here was the plan: global supply chains spread among developing countries would assemble products which would be shipped to markets around the world. The U.S. and other developed countries could steer the global economy to new heights, and rid themselves of the nasty pollution that comes from manufacturing stuff.

Then, the new global digital economy went oops…

After falling back about 40%, the index then doubled from early 2003 through 2007. During that five year period, the house price index grew 40%, more than double its annual growth rate for the past century. In the old mortgage model, a lender would take a risk on the fortunes and reliability of a single family to repay a mortgage. Now, through the power of computerized algorithms, that risk could be sliced and diced so thin and spread among so many synthetic mortgages that the risk virtually disappeared. The smart people in the financial industry had finally figured out the secret to securitized debt. Every family could now build wealth by owning a home. Oh, happy days!

Then, housing went oops….

As the financial crisis gripped most of the developed world, central banks took on vast quantities of debt and expanded the money supply to counteract a slide into a global depression. Expanding the money supply usually brings an increase in inflation, and to protect against that coming inflation, investors around the world turned to gold. From the depths of the financial crisis in early 2009 toward the latter part of 2011, a period of less than 3 years, the price of gold doubled. But inflation did not rise as expected. The central banks had simply been fighting a strong undercurrent of deflation, stronger than even they had realized.

As inflation remained low, gold went oops….

The trick is to figure out beforehand what will go oops next. The pattern is this: an increasing number of people become convinced of “X” idea and begin to take it for granted. Then some series of events undermines a belief in “X” and the stampede begins. The massive increase in sovereign debt looks like a prime candidate for default and debacle but the central banks of developed countries have many legal and financial tools at their disposal to stem any panics.

For a dominant economic power like the U.S., the “X” has traditionally been based on private debt whose value can not be easily controlled by government dictate. In the late 90s, it was technology. Most of us associate that period with wildly inflated stock prices and IPOs that jumped in price on opening day. What may have escaped our attention is that corporate debt increased by almost 60% from the beginning of 1995 to the end of 2000. When the towers came down on 9-11, corporate debt had grown 75%. From early 2002 through 2005, there was no growth in corporate debt.

As corporate debt grew in the late 90s, government debt decreased. As corporate debt growth stopped in the early ’00s, household debt and government debt surged upwards. So let’s keep our eyes on this dance of corporate, household and government debt.

DanceOfDebt2016

Since the financial and housing crisis that began in 2008, federal govt debt has doubled, while household debt declined. It has taken eight years for household debt to finally surpass its 2008 high water mark, and is now approaching $15 trillion.

Since 2006, corporate debt has almost doubled. It is my guess that this is where the next crisis lies.

CorpDebt2016

After the next crisis, we will look back and see that there was such an obvious over-confidence in that “X.”  Analysts will help us understand the details and unfolding of the crisis till we think that we can avoid it next time.  Like whack-a-mole, the next crisis will pop up from another hidey hole.  The trick is to have several smaller hammers instead of one big hammer.

The Weathervane of Growth

April 10, 2016

CWPI (Constant Weighted Purchasing Index)

March’s survey of Purchasing Managers showed a big upsurge in new orders for the manufacturing (MFR) sector. Export orders were up 5.5% in both the manufacturing and services (SVC) sectors and overall output increased 2% or more.  After contracting for several months, MFR employment may have found a bottom.  The total of new orders and employment is still growing but below five year averages.

The broader CWPI is still expanding but at a slightly slower pace for the past seven months.  The cyclic pattern of declining growth followed by a renewal of activity has changed. While there is no cause to make any strategic changes to allocation, it does bear watching in the months ahead.

////////////////////////

IRA Standard of Care

Financial agents – investment advisors, stock brokers and insurance agents – have had different standards of care when they deal with their clients.  The first and highest standard is fiduciary: the agent should operate with the best interests of the client in mind.  Registered Investment Advisors (RIA) are registered with the SEC and follow this strict standard. The second and more lax standard is suitability: the agent should not sell the client anything that is not suitable for the client based on what the client has told them about their circumstances.  Here’s a short paper on the difference between the two standards.

This week the Obama administration issued new guidelines for agents servicing IRA account holders, requiring agents to maintain the higher fiduciary standard starting in 2017.  This requirement was left out of the Dodd-Frank finance reform bill because many in the investment industry lobbied against it.  Here is the first rule proposal in February.

Opponents will criticize the Obama administration for this “new” set of regulations but this policy has been recommended by some in the industry, on both sides of the political aisle, for at least 25 years.  During the 1980s Congress made several changes that made IRA accounts available to a wide swath of savers, most of whom were unfamiliar with the marketplace of financial products now available to them.

Some in the insurance and investment industries fought against the imposition of a stricter fudiciary standard because it would require more training and would likely reduce the sales commissions of agents.  The growing volume of tax deferred employee retirement plans has generated a steady stream of fees for those in the financial industry.

Keep in mind that the new policy only applies to retirement accounts.

////////////////////////

Debt

Banks are in the business of loaning money, meaning that they must loan money to stay in business.  Most of the time some part of the economy wants to borrow money.  Borrowers come in three types:  Household, Corporate and Government.  If households cut back on their borrowing, corporations may increase theirs.

A historical look at total debt as a percent of GDP shows several trends.  Keep in mind the leveling of debt since the financial crisis.  We’ll come back to that later.

In the thirty years following World War 2, debt levels remained fairly consistent with the pace of economic activity.  The three types of borrowers offset each other.  Households and corporations increased their borrowing while government, particularly the Federal government, paid down the high debt incurred to fight WW2.

In 1980 the Reagan administration and a Democratic House began running big deficits, contributing to a spike in the the total level of debt.  By 1993, when President Clinton took office, Federal and State Debt as a percent of GDP was about the same as it was at the end of WW2.

A combination of higher tax rates and cost cutting by a Republican House elected in 1994 led to a reduction in government spending as household and corporations increased their spending.  Total debt levels flattened during the late 1990s.

Following the 9/11 tragedy and a recession, government debt levels increased but now there was no offset in household borrowing as mortgage debt climbed.  Helping to curb the pronounced rise in total debt levels, a Democratic House at odds with a Republican president dampened the growth of government borrowing in the two years before the financial crisis.

Arguably the most severe crisis in eighty years, the financial crisis caused both households and corporations to cut back on their borrowing.  Offsetting this negative borrowing, the Federal government assumed an often overlooked role – the Borrower of Last Resort.  We are accustomed to the role of the Federal Reserve Bank as the Lender of Last Resort, but we might not be aware that some part of the economy has to be the Borrower.  That role can only be filled by the Federal government because the states and local governments are prohibited from running budget deficits.

Look again at the second chart showing the huge spike in government borrowing following the financial crisis.  Now remember the leveling off of total debt shown in the first graph.  The Federal government has increased its debt level by more than $10 trillion.  Almost $4 trillion of that has come from the lender of last resort, the Fed, but the rest of that borrowing has offset a significant deleveraging by corporations and households.  Had the Federal government not borrowed as much as it did, many banks would have experienced significant declines in profits to the point of going out of business.

There is a potential bombshell waiting in the $2 trillion in corporate profits that businesses have parked overseas to delay taxes on the income.  If Congress and the President were to lower tax rates so that corporations could “repratriate” these dollars, two things would happen: 1) corporations could lower their debt levels, using the cash to pay back the rolling short term loans they use to fund daily operations; and 2) the Federal government would lower its debt levels as the corporations paid taxes on those repatriated profits.

Great.  Lower debt is good, right?  Unless households were to step up their borrowing, total debt could fall significantly, causing another banking crisis.  Although politicians on both sides like to talk about bringing profits home, such a move will have to be done slowly so that the economy and the banking system can adjust in slow increments.

Partisans cheer when candidates express strong sentiments in rousing words, but cold caution must quench hot spirits. We can only trust that candidates for public office will temper their campaign rhetoric with prudence if entrusted with the office.

Growing Government Debt

March 6, 2016

Earlier this year and again last week I suggested that a broad index of energy companies would probably be a good investment for the long term investor.  This week’s inventory report from the U.S. Energy Information Administration (EIA) showed that crude oil inventories continued to climb but that demand for gasoline is up a strong 7% over last year.

The latest Baker Hughes rig count showed an 11th week of declines in North America.  Oil rigs are now at levels last seen in early 2008 and gas rigs are at a 70 year low.

In response to demand growth and a steadily declining supply, crude oil prices climbed almost 10% and energy ETFs like XLE and VDE climbed almost 8% this past week.

////////////////////////

Constant Weighted Purchasing Index (CWPI)

At the beginning of each month I update an index that is based on the Purchasing Managers Index (PMI) using a methodology initially developed by financial economist Roland Pelaez in 2003 as a possible forcasting indicator for recessions.  I modified that to include the dominant non-manufacturing part of the economy, and called this combined index the CWPI, which I have included in my blog for three years.

The PMI is a monthly survey of Purchasing Managers throughout the country that gauges expansion or contraction in several aspects of their business.  The two most important components in the model are employment and new orders.

For the first time since last October, the manufacturing component of the index rose but is still contracting slightly.  Export manufacturers have had to overcome a strong dollar in the past 1-1/2 years, which makes American made products more expensive overseas.  The services sector is still expanding and the composite reading is still strong, indicating that there is little risk of recession in the near term.

Although Friday’s employment report showed strong job gains of 240,000, growth in the employment component of the services sectors is slowing.

Mr. Pelaez has recently published  a peer reviewed recession forecasting tool that I have not reviewed yet but I do look forward to reading his insights. Recessions come infrequently, about once a decade, but a long term investor who can switch out of stocks and into Treasuries to avoid these recessions could theoretically triple their wealth.

A word of caution.  There are several inherent problems with trading models based on infrequent economic events like recessions: 1) backtesting can help one develop a model or trading rule that does little more than fit the historical data;  2) backtesting uses revised economic and financial data.  Unfortunately, we don’t get to make decisions with historically revised data.

A great example of this:  at the June 2008 meeting of the Fed, three months before the financial crisis imploded, the majority of economists at the meeting felt that the economy had skirted a recession.  As more data for the first and second quarters of 2008 showed a definite decline in GDP, the NBER actually marked the start of the recession six months before that meeting, in December 2007.  You want perfect?  Next universe that-a-way.

///////////////////////

Debt Doubts

In December 2009, I mentioned  a comment by Raymond Baer, the chairman of Swiss private bank Julius Baer, who warned: “The world is creating the final big bubble. In five years’ time, we will pay the true price of this crisis.”

That time has come and gone but these things don’t run on a calendar.  As the book “The Big Short” noted, a person has to be right and timely.  Some who bet on the implosion of the housing bubble ran out of money before the bubble burst.

Taking advantage of extremely low interest rates, companies continue to borrow.  Levels of corporate debt are nearly a third of GDP.

Instead of bringing some of its cash profits back into the U.S. and triggering a tax expense, Apple has borrowed money to fund operations and investment.  Banks and investors would rather loan money to Apple than some medium sized business.  How good is that for the long term health of the economy?

To understand the makings of a debt bubble, let’s compare rates of return on investment and debt. Let’s say that a 50/50 balanced portfolio can earn 5.5% per year; 7.5% for stocks, 3.5% for bonds.  If a mortgage can be had for 4%, then it makes sense to NOT pay down the mortgage.  A car lease or loan at a 2% interest rate?  Keep rolling the loan or lease.  A company like Johnson and Johnson can borrow money for 25 years at the same 4%.  Why would they pay down debt?

Debt continues to grow because there is no financial incentive to pay it down.  Some families may pay down debt out of conservative prudence but there is no economic sense in doing so as long as money can be borrowed at a rate that is below what one can earn with the money.

As an example, let’s say that a family is considering paying off the remaining $100K on their mortgage.  They can get a new mortgage for 3.5% – 4%.  If they can earn 5% on that money, why bother paying off the mortgage?  Persistently low interest rates cause families and businesses to make short term decisions that make sense – until they don’t.  Some families will pay off debt as a matter of prudence but the low interest rate environment encourages families and businesses to NOT pay off debt.

In 2009, Raymond Baer was referring to the amount of corporate debt that was being rolled over at the time in order to avoid taking a loss on the loan.  Central banks have helped subsidize that rising corporate debt with low interest rates.  Banks reciprocate by buying government debt.

Global government debt has DOUBLED from $28 trillion in 2007 to almost $56 trillion in 2015 (Global debt clock).  China’s government debt-to-GDP ratio has more than doubled from 21% in 2007 to an estimated 54% in 2008 (S. China Post)

In the U.S. and Europe, government banking agencies reciprocate by requiring banks to hold little if any reserve collateral for the Federal or central government debt the banks purchase.  It’s a great financial buddy system – until it’s not.  We have never lived in a world where central banks can create so much money with an entry in a ledger.  As long as no one runs for the exits, everything is OK.

Under the Dodd-Frank rules, the Federal Reserve does not rate state and municipal debt with the same safety it accords U.S. Treasury debt.  This forces banks to hold more collateral against the debt, making it less attractive.  The Dodd-Frank test is whether banks can survive for thirty days during a financial crisis.  Since municipal and state bonds don’t trade very frequently, their lack of liquidity makes them more susceptible to downward price pressures in a crisis.  The Fed wants banks to offset that risk.  Cities and states complain that this forces them to pay higher interest rates on their debt and gives them less access to the bond market.  What do governments do when they don’t like the judgment of finance professionals?  Get their legislators to pass laws to override that prudence.  Several bills in both the Senate and House have been proposed.  This is how the world goes to hell.  One step at a time. (WSJ article on municipal debt)

////////////////////

Bonds Bust ZLB

Howz dat for a headline?!  ZLB means “Zero Lower Bound”, or 0%. Last Monday, the central bank of Japan sold almost $20 billion of 10-year government bonds that paid a negative interest rate.  Buyers are paying the Japanese government a fee to loan the government money.  Bizarro world!  While I don’t know the details, the buyers are probably Japanese banks who “take one for the team” – lose money – to implement a plan that the central bank hopes will combat the threat of deflation.

Sugar Daddy

June 7, 2015

Older readers may remember Bizarro Superman, the mirror image of Superman, who did things backwards, or in reverse.  That’s the world we live in today; good news is bad, and vice versa.  The employment news was doubly good.  Job gains were stronger than expected at 280,000 but more importantly the unemployment rate went up a smidge, and for the right reasons.  As people become more confident in the job market, they re-enter the labor force, actively looking for work.  Discouraged job applicants have fallen 20% in the past twelve months.  The civilian labor force, the sum of employed and the unemployed, has grown.

Is good news good or bad?  If only the news would wear a hat, white or black, so we could tell. In Friday’s trading, investors bet on the timing of the Fed’s first interest rate increase.  September of this year or the beginning of 2016? When will Sugar Daddy, the Fed, take away the punch bowl of easy money?

The core work force, those aged 25 – 54 who drive the economy, continues to show growth greater than 1%.

Although hourly wage growth for all private employees has been modest at 2.3% annual growth, weekly earnings for production and non-supervisory employees have risen 30%, or 2.7% per year in the past decade, a period which has included the worst downturn since the 1930s depression.  This more positive outlook on wage growth does not fit well with some political narratives.

The decade from 1995 – 2005 had 36% gains, or 3.1% annual growth, only slightly above the gains of the past decade and yet this period included the go-go years of the dot-com bubble and the housing boom. Inflation was higher in that decade, and in inflation adjusted dollars, the earlier period was only slightly stronger than this past decade.  In short, we are doing suprisingly well considering the negative impacts of the financial crisis.

************************

CWPI

Every month I update the Constant Weighted Purchasing Index, a composite of the Purchasing Manager’s monthly index published by the Institute for Supply Management.  This month’s reading was similar to last month’s, continuing a trough in the strong growth region of this index.

**************************

Heaven On Earth

Last week I asked the question: Why can’t a government with a fiat money system simply give everyone a lot of money and create a heaven on earth?  The standard answer is that it would cause inflation.  For several millennia, when a government injects money into an economy, inflation soon follows as the supply of purchasing power increases without a concurrent increase in the supply of goods and services.  In the 18th century philosophers David Hume (On Money) and Adam Smith (Wealth of Nations) noted the phenomenon.  Peter Bernstein’s Power of Gold recounts ancient examples of kings and governments debasing metal monies and the inflation that ensued.

In the seven years since the recession began in late 2007, the government has borrowed and spent $27,000 per person and there has not been the slightest hint of inflation. Why? There are several reasons.  If a government borrows money from the private sector, there is no net injection of money into the system, no printing of money. A Federal Reserve FAQ on printing money is careful to note that “printing money” is the permanent financing of a government’s debt by a central bank.  Whatever people want to call it, when the Federal Reserve buys government debt, new money is injected into the system.  Since 2007, the Fed has injected almost $4 trillion (Balance Sheet), or about $12,000 per person, of new money without an uptick in inflation.  How is this possible?

There are two types of spending – today and tomorrow.  Spending for today is consumption.  Spending for tomorrow is investment.  Both types of spending drive demand for goods and services.  The paucity of private investment since 2007 is at levels not seen since the years immediately following World War 2.

Although government investment is a relatively small percentage of GDP, that has also fallen to historically low levels.

The sum of private and government investment as a percentage of GDP is shockingly low.

If we use 2007 investment levels as a base, the accumulated lack of investment is far more than the $4 trillion that the Fed has pumped into the economy.

The Fed’s injection of money into the system is primarily spent on government consumption, or today spending, which is helping to offset the lack of investment spending.  As investment spending rises, the Fed has been able to stop adding to its portfolio, although this “tomorrow” spending is still so low that the Fed can not begin to lighten its portfolio of government debt.

Advocates – economist Paul Krugman for one – of greater government investment spending, even if it borrowed money, hope to offset the lack of private confidence in the future.  Previous government stimulus spending did have little effect on overall economic growth simply because it did little more than offset the lack of long term confidence by those in the private sector.

Heaven On Earth

May 31, 2015

Although the unemployment rate has fallen below 5.5%, the labor participation rate is still rather low and wage growth is slow, prompting renewed calls for government stimulus. A 2010 article laid out the justifications for more government borrowing to spur the economy. Let’s review a few points made by these economists.

“Spending by the federal government always creates new money in the system, while taxation destroys it.”

The nature of money and the government’s relationship to money is certainly beyond the scope of a blog post. In short, money in all its forms is a claim. A central bank (called the Federal Reserve in the U.S.) is a government created institution which regulates and administers the supply of money and credit within a country, and manages the reserves of foreign currencies held within that country.  It acts as the government’s banker and is the lender of last resort both to the public and the government.  If the public will not buy all of the debt issued by the Treasury of a government, the central bank steps in and buys it, a practice known as “printing money” although there is no new money printed.

In a fiat (unbacked by any hard metal or asset) money system, a sovereign government has the power to create and destroy money claims at will.  As the 2010 article notes, all taxation is a destruction of money.  A $100 tax voids a taxpayer’s ability to make a $100 claim for some good or service.   A thief takes money with no promises.  A government takes money with some implied promise or threat but no exchange of value at the time of the taking.  Taxation is not an exchange, but a taking, a destroying, like letting a little bit of air out of a balloon.  As long as the government pumps in the same amount of air that it took out, the size of the balloon changes only in proportion to the change in population.

In 1960, two economists, Gurley and Shaw, coined the terms Inside Money and Outside Money to capture this unique license of government (Federal Reserve paper on this subject). Treasury bills and forms of government debt are claims on government, and termed outside money, as in outside the private marketplace. Money exchanges between people and companies in the private sector are termed inside money. Each dollar of inside money represents a debt by someone else within the private sector.  When government spends more than it taxes, it borrows and pumps outside money into the private sector balloon. Many of us might think inflation is the net change in the size of the balloon but it might be more helpful to imagine that the size of the balloon, or volume, is the size of the population and grows slowly and constantly, about 1% in the U.S.  Inflation, then, is a measure of the pressure inside the balloon. (Boyles’ Law  and other fun facts with gases)

Various economists in this article asserted that the government should pump more outside air into the balloon, which will cause the economy, the molecules inside the balloon, to speed up.  Is there any limit to the amount of outside money that a government can pump into the balloon?

“[A] government cannot become insolvent with respect to obligations in its own currency.”

If a government can make up money out of thin air, why not just give $100K to each of the 300 million citizens in the U.S.?  People who couldn’t afford a newer car could buy one, which would boost the sales of car manufacturers. New homes, new appliances, vacation trips – a shot in the arm for so many industries. Unemployment would practically vanish. Imported goods into the U.S. would soar, helping the workers and businesses in other countries.  People could pay off their credit card and student loan debts but banks might suffer because not as many people would want loans.  Stock prices would soar in value as families searched for a place to invest some of their windfall.  People who had already owned stocks and other assets before the boon would see their net worth increase exponentially.  Housing prices would climb as more people could afford to buy a house.

What about inflation?  Well, the government has already pumped in $8 trillion since the recession started in late 2007.

$8 trillion divided by a 300 million population is almost $27,000 per person.  Contrary to predictions of runaway inflation, it has been moderate or below the 2% target rate.  In fact, if we use the method of calculating inflation used in the Eurozone, we have had deflation in the first quarter of this year.   So any inflationary effect from a one time $100K boon would be less than disastrous.  Even if inflation climbed to a 1990s level, about 4 – 5%, what is the harm?

Most of us instinctively look at this scheme, furrow our brow, and get suspicious.  But why?  Why can’t a government with a fiat money system simply create heaven on earth?

Stay tuned till next week….