January 26, 2025
by Stephen Stofka
This is 11th in a series of debates on various issues. The debates are voiced by Abel, a Wilsonian with a faith that government can ameliorate social and economic injustices to improve society’s welfare, and Cain, who believes that individual autonomy, the free market and the price system promote the greatest good.
The notes at the end give more context to the arguments.
Cain began this week’s conversation. “We left off last week discussing alternatives to the income tax. Before we entertain alternatives, can we agree that the income tax should be abolished at the same time the country adopts a new scheme of taxation?”
Abel cleared his throat. “I’m not so sure about that. Can an alternative tax scheme raise the same amount of revenue?”
Cain raised an eyebrow. “If it didn’t, that would be more money for private consumption and investment.”
Abel grimaced. “That’s playing with fire. The country is already running persistent deficits. If there was a significant difference in revenue, it could seriously weaken the dollar.”
Cain said, “Our group favors a consumption tax to replace the income tax. They were the main source of federal revenue until the passage of the 16th Amendment in 1913.”
Abel shook his head. “Consumption taxes didn’t raise enough money to pay off Civil War debts and the pensions promised to veterans and their families. In the early 20th century, society was becoming more complex. There was a greater role for government. The greatest improvements in health and life span came in those decades. Public sanitation measures and vaccines reduced water borne illnesses and contagious diseases.”
Cain argued, “I agree that there was a greater role for government. It’s just gone too far. Particularly the role of the federal government in our lives. A consumption tax broadens the tax base. Gives voters a stake in the government’s spending.”
Abel nodded. “There are several types of consumption tax. Many developed countries use a VAT or value added tax, but it is a supplemental to an income tax.”
Cain’s displeasure was obvious. “Our group would not support another tax. Also, with a VAT, politicians are tempted to fiddle with the type of items subject to the tax. It invites interest groups to lobby for exclusions from the tax. That’s what goes on in Britain and many European countries. We advocate a tax that reduces favoritism.”
Abel argued, “Any tax scheme invites favoritism. For instance, Colorado has a flat income tax but many exclusions from income that are not included in federal income. Pensions, social security and charitable contributions are just a few examples.”
Cain shook his head. “A credible alternative would have to make alteration as difficult as possible for Congress – just like the Constitution is.”
Abel sighed. “Specific language makes compromise difficult. The law is full of words that are open to interpretation like ‘reasonable’ and ‘appropriate.’ Section 8 of Article 1 of the Constitution stipulates that the Congress provide for the ‘common Defence and general Welfare.’ What does the word ‘general’ mean in that context? It’s clearly not the common welfare or the founders would not have agreed on the insertion of the word ‘general.’ To this day, our two groups have been arguing about the scope of powers authorized by those two words.”
Cain tilted his head slightly. “Ok, granted it’s not easy. We are not striving for perfection, only clearly defined terms and transparency. No more backroom deals in Washington.”
Abel frowned. “Look, people and the institutions they create are too complicated for simple solutions. The only reason that the Constitution exists in a difficult to alter form is the small number of people who had a hand in its creation.”
Cain scoffed. “Each state had to ratify the Constitution and the Bill of Rights. In 1787, the Virginia legislature had 168 Senators and delegates. Today Virginia has only 140 members to represent a population that is sixteen times as large. Believe me, there was plenty of vociferous debate. The Constitution is a series of compromises hammered out in Philadelphia but reflecting the sentiments of those in the individual states.”
Abel interrupted, “The few who could vote. Men with property. The sentiments of the Declaration of Independence were noble and democratic, but this country’s Constitution was founded on governance by an aristocracy. After a bitterly fought Civil War, the passage of the 14th Amendment expressed the democratic sentiments that the founders could not embody in the original Constitution.”
Cain laughed. “Once again, we are getting off the topic. Our group wants specific, not broad, taxation powers that limit Congress and the President. It’s a principal-agent problem. We have to keep our elected representatives, our agents, on a short leash, or they will satisfy their own interests more than they do the people they represent. The text of the 16th Amendment was too broad and invited the corruption and complexity the tax code has become after more than a hundred years.”
Abel looked puzzled. “Your group wants an amendment with specific language?”
Cain nodded. “Yes, an amendment revoking the 16th Amendment and installing a consumption tax of some sort.”
Abel asked, “What about new home sales? They are included in GDP, but the consumption happens over years. The Bureau of Labor Statistics calculates an ‘imputed rent’ that a homeowner pays and collects each month. It’s based on market rents in that area.”
Cain shook his head. “It can be simple. The language of the amendment would target the revenue as a percentage of GDP. The means to get to that target would be left up to Congress.”
Abel looked interested. “Go on, tell me more about that.”
Cain continued, “Our group supports a national sales tax or VAT to replace the income tax. In 2023, the federal government collected $2.56 trillion in individual income taxes on a GDP of $27.2 trillion. That’s 9.2% of GDP. Let’s say a thirty-year average is 10% to make the math easy. A VAT or some other consumption tax rate could be adjusted each year based on quarterly GDP estimates that the government already does. That would not be cumbersome wording.”
Abel showed concern. “Your group strives for simplicity like it was the Holy Grail. In 2018, the Congressional Budget Office estimated the revenues from a VAT over a ten-year period. They noted that a broad tax base includes only 66% of personal consumption expenditures and those account for only 67% of GDP. Multiply those together and the tax base is only 44% of GDP. To collect the same revenue as individual income taxes, the tax rate would have to be 21% or so, not 10%.”
Cain counted on his fingers. “One, it would broaden the base so that more voters have skin in the game. Two, it would protect everyone’s privacy. Three, it would set clear and transparent limits on politicians in Washington. It’s well worth the price.”
Abel shook his head. “To abolish all tracking of income, all of the states would have to agree to a VAT to collect their taxes. What about Social Security taxes collected? For the past 15 years, those tax revenues have been 6.5% of GDP. The tax rate would have to be 36% to account for Social Security taxes. Add in state income taxes and the tax rate would be over 40%. Adding in state and local sales tax could bring the total tax bite to 50%.”
Cain argued, “Look at Britain. It has an income tax rate that starts at 20% and a VAT rate of 20%. A middle-income person could pay 60% total tax. The average effective tax rate in the U.S. is 15%. Add in 15% for the employer and employee contributions to FICA taxes. State and local taxes can add up to eight or ten percent. The total tax bite under our current system is close to 40%.”
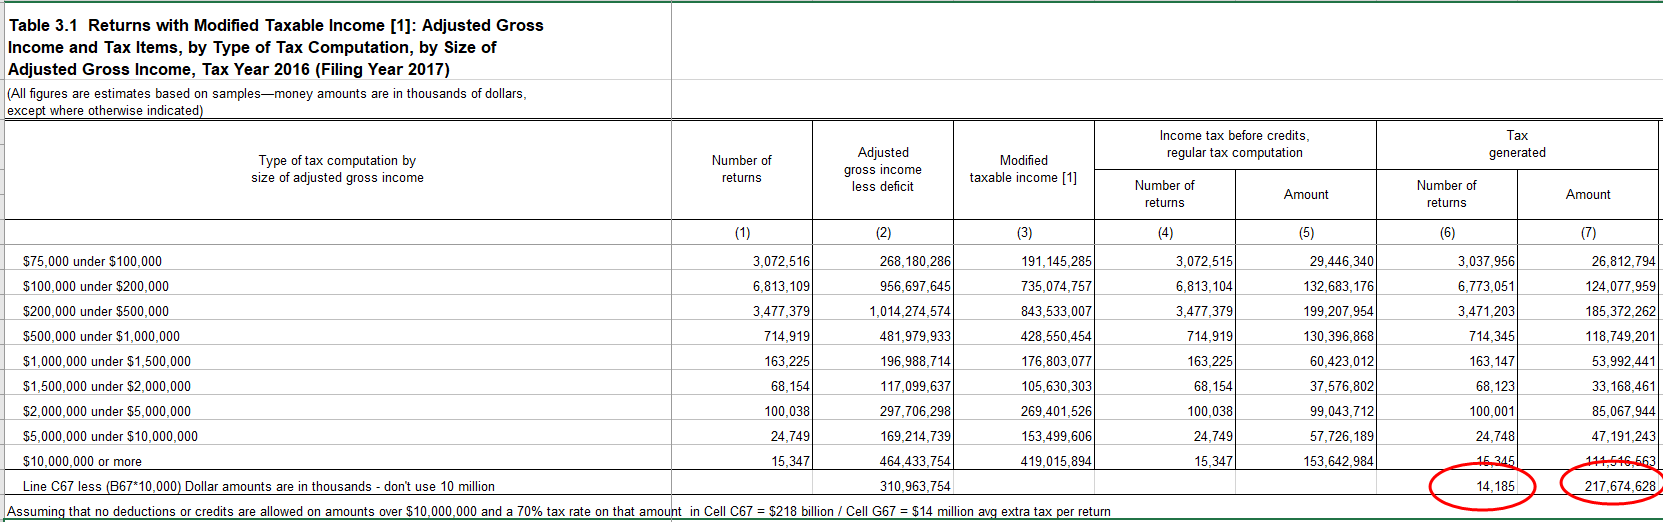
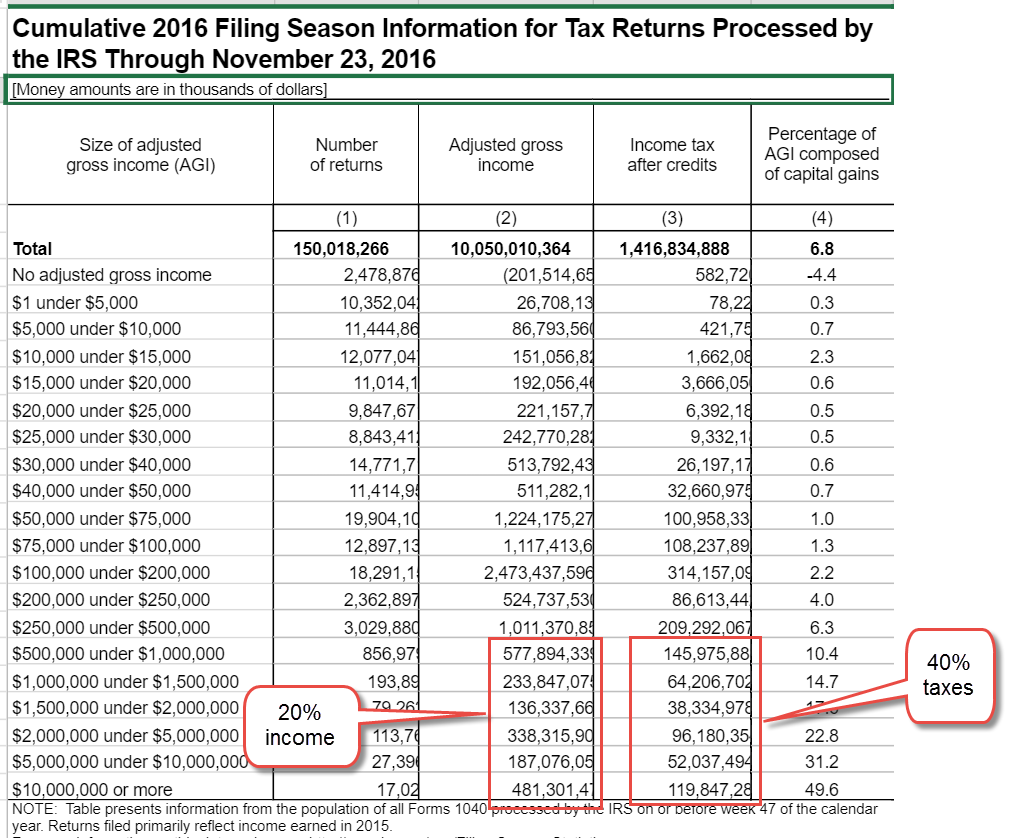
Abel frowned. “An analysis of 2021 IRS data showed that the bottom 50% of taxpayers paid an average of only 3.3% of gross income, not 15%. Voters will not go for a tax scheme that will place a huge burden on most taxpayers to reduce the tax burden on Elon Musk and the other 1%.”
Cain interrupted. “That’s one of the problems. Half of the voters have so little skin in the game that they let politicians get away with anything. That’s how the budget became so bloated with ‘gimmes.’”
Abel replied, “Well, that’s a discussion for another day. I just don’t think a VAT is a practical alternative as a complete replacement for the individual income tax. Sure, we all like simple but the burden of common costs and the distribution of benefits is too complex for simple policies.”
Cain pursed his lip. “The more complex the policy, the less transparent. In a democracy, transparency is crucial.”
Abel raised an eyebrow. “I agree but I don’t think your group can sell a tax policy that would increase the tax bite for the lower half of income earners by at least ten to fifteen percent. It might throw the economy into a recession within a year.”
Cain objected, “I think voters can be convinced. This last election has shown that voters are tired of progressive policies.”
Abel smirked. “Trump won the popular vote by 1.6%. The House has a slim majority. The Senate has a 53-seat majority only because Democrats had almost twice as many Senators up for re-election as Republicans. It’s the luck of the draw. It’s certainly not a mandate as Republicans are claiming.”
Cain shook his head. “A lot of traditionally Democratic voters went for Trump. Voter sentiment is shifting.”
Abel smiled. “That’s a discussion for another time.”
Cain turned to go. “See you next week.”
////////////////////
Photo by Mary Farrell on Unsplash
The Tax Foundation explains the difference between a value-added-tax (VAT) and a national sales tax. https://taxfoundation.org/taxedu/glossary/value-added-tax-vat/ The European Union has a quick explainer on how a VAT works https://taxation-customs.ec.europa.eu/taxation/vat/how-does-vat-work_en
This Investopedia article explains several types of consumption tax. https://www.investopedia.com/terms/c/consumption-tax.asp
Abel brought up Colorado’s exclusions from income as an example of the favoritism that exists even in simple flat tax schemes. https://tax.colorado.gov/individual-income-tax-guidance-publications.
The effective tax rate is the tax divided by the adjusted gross income. On form 1040, it is line 24 divided by line 11. Popular tax software programs usually note the effective tax rate on their summary page.
Cain stressed the many legislative debates that ensued during the ratification process. This is a two-book set that contains the Federalist papers and arguments in several state legislatures. https://www.amazon.com/Debate-Constitution-Federalist-Anti-Federalist-Ratification/dp/1598534114/ref=sr_1_1
In response to Abel’s argument that the Constitution was a product of elite sentiments, Cain noted that there was far more representation of each district within a state than there is today. In 1787, the population of Virginia was 420,000 with the caveat that Negro slaves were counted as 3/5ths of a person. The actual population was about 532,000. Today the population is 8.7 million, sixteen times larger, yet the legislature is smaller. Counting Negroes as 3/5 of a person in the Constitution was a compromise about the amount of tax each state had to pay for the nation’s common expenses. Northern states wanted to share common expenses according to the population of each state. Southern states insisted that Negro slaves were property and should not be counted. Counting Negroes as 3/5 of a person was a compromise about money and the burden of taxation. https://csac.history.wisc.edu/2022/08/01/population-and-constitution-making-1774-1792/
Abel argued that a 21% VAT would be needed to replace individual income tax revenue. In 2023, individuals paid $2.56 trillion in income taxes. The CBO estimated that a VAT on a broad base of items would tax only two-thirds of personal consumption expenditures (FRED Series PCE) which was $18.8 trillion in 2023. 66% of $18.8 trillion equals a $12.4 trillion tax base. $2.56 trillion collected divided by a $12.4 trillion tax base equals a 20.6% tax rate. Here is a link to the CBO’s summary https://www.cbo.gov/budget-options/54820
Taxes collected on Social Security is FRED Series https://fred.stlouisfed.org/seriesBeta/W780RC1Q027SBEA.
Cain compared a 50% tax bite with combined income tax rates and VAT rates in Britain. Income tax rates in Britain start at 20%. https://www.taxesforexpats.com/country-guides/uk/uk-vs-us-taxes.html#part1 The VAT rate is 20% https://taxfoundation.org/data/all/eu/value-added-tax-2024-vat-rates-europe/