Minority Control

October 13, 2019

by Steve Stofka

On September 15, 2008 the trading firm Lehman Brothers declared bankruptcy. A small number of outstanding shares traded on the stock market that day. The SP500 lost almost 5% of its value. New Yorkers gathered in Times Square to watch the ticker tape display. A small number of people controlled the direction of the market and constructed a reality that they sold to the rest of us.

In politics, a few key people control the direction and fate of legislation. In the Senate, the Majority Leader decides whether to bring legislation up for a vote. Even if a bill makes it out of a Senate committee, the Majority Leader can stop it from reaching the full Senate.  Unlike the Majority Leader in the House, his position is practically impregnable. Legislation vetoed by the President can be overridden by Congress. There is no recourse to a veto by the Senate Majority Leader.

The current holder of the position is Sen. Mitch McConnell from Kentucky. He is up again for re-election next year. When Democrats held the Senate, Sen. Harry Reid ruled with a similar disregard for others in his own party as well as the minority.

In 2014, 800,000 voters chose McConnell. In effect, less than 1% of the country’s voters control the course of legislation in the U.S. Did the founders of this country intend that one person should control Congress? James Madison, the chief crafter of the Constitution, worried that a majority would overwhelm and take advantage of a minority (Feldman, 2017). Accordingly, the Constitution is structured so that a minority controls power. However, one person is a very small minority. What would the founders think of the current arrangement in Congress? If Americans wanted a king with veto-proof power, America would still be a colony of Britain.

Our method of electing a President is a 230-year-old compromise between republicanism and democracy. An electoral college composed of men not subject to the passions of the crowd would elect the leader of the country. It was an Enlightenment model of dispassionate rationality.

Even if they had Fox News and CNN on Election night at the time of the founding, all the thirteen states were in the same Eastern time zone. At a recent symposium on our election, former RNC chair Michael Steele pointed out the west coast states are mostly taken out of the Presidential election (C-Span.org, 2019). By 5 P.M. Pacific time, they are discouraged from voting because much of the action has already been called. The founders did not design a system for four time zones.

We have 50 states but the election for President takes place in eight to twelve battleground states. Most polling is done at the national level, not in the battleground states. Many polls do not accurately survey the sentiments of the critical minority of voters in the states that will decide the election.

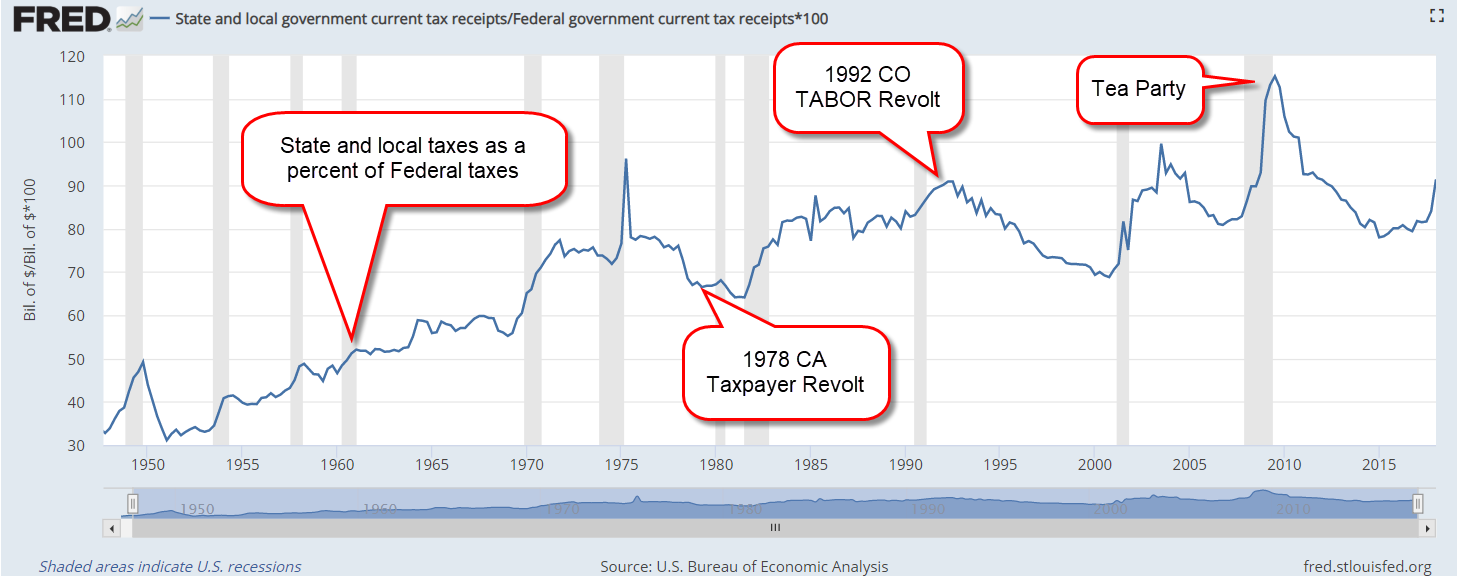
A minority of people own and control much of the wealth of the world. They now pay a lower percentage of their income than the bottom 50%. That includes federal, state and local taxes. In the Triumph of Injustice, due to be released next week, authors Saez and Zucman (2019) tally up the tax bills for the rich and ultra-rich. The book is #1 bestseller at Amazon and it hasn’t been published yet.

In 1980, the top 1% paid 47% of their income in total taxes at all levels. Now they are down to 23% and below the rate paid by the bottom half of incomes. Two sets of rules – one set for the peasants and one for the castle royalty. The Constitution prohibits the granting of titles so the rich granted themselves the titles. This book is sure to get a lot of media attention. Like we need more controversy.

Notes:

Feldman, N. (2017). Three Lives of James Madison: genius, partisan, president. [Print]. New York: Random House.

C-Span.org. (2019, October 7). National Popular Vote Election, Part 2. [Video]. Retrieved from https://www.c-span.org/video/?464997-2/national-popular-vote-election-part-2

Saez, E. & Zucman, G. (2019) Triumph of Injustice: How the Rich Dodge Taxes and How to Make Them Pay. [Print]. Available for pre-order at https://www.amazon.com/Triumph-Injustice-Rich-Dodge-Taxes/dp/1324002727

Effective tax rates: If you make $100,000 and you pay $25,000 in federal, social security, state, sales and property tax, then your total effective tax rate is 25%.

Photo: WyrdLight.com [CC BY-SA 3.0 (https://creativecommons.org/licenses/by-sa/3.0)%5D Page URL: https://commons.wikimedia.org/wiki/File:Bodiam-castle-10My8-1197.jpg

Unauthorized Tax Revenue

September 1, 2019

by Steve Stofka

This might be a sensitive subject for some – the amount of taxes that unauthorized immigrants pay. Homeland Security uses the term “unauthorized” (Note #1). Some people prefer the adjective “undocumented” but many immigrants have adequate documentation. Some prefer to use the adjective “illegal” but the only illegal act is being in the country without proper authorization. If someone is speeding but is obeying all other traffic laws, are they an illegal driver? In most cases, they are a legal driver committing an illegal act.

 Those who defend immigrants point out that they pay taxes, so they are contributing to our society. I was curious as to how much because I have not heard an immigrant advocate offer any data. I told my trusty hunting dog, Google, to go find them facts and bring them on back to me.

First the big picture. The total Federal, State and local taxes paid in 2016 was $5,300 billion, or $5.3 trillion (Note #3). What was the share that unauthorized immigrants paid? The Institute on Taxation and Tax Policy recently estimated that they paid almost $12 billion dollars in state and local taxes. The IRS says they paid $9 billion in payroll taxes (FICA) and almost $1 billion in income taxes (Note #4). The total is $22 billion.

How do they report? They get Federal ID numbers called ITINs. To encourage compliance with our tax laws, the IRS says they do not share this information with the immigration and naturalization folks in Homeland Security. I was amazed that unauthorized immigrants would file tax returns. They are not eligible for social security benefits or earned income credits available to low income families. They are not eligible for TANF – what most people call welfare. The only benefits they are entitled to are those directed toward children – free public education and school meals, child medical care and SNAP (food stamps).

So why file? If you follow that IRS link, you’ll find that an unauthorized immigrant who shows “good moral behavior” may have their deportation proceedings waived or be eligible to apply for citizenship after ten years of residence. What is one sign of good moral behavior? Paying taxes. What is a sign of bad moral behavior and might get someone deported? Not paying taxes. Good incentive to pay taxes.

Homeland Security estimated 12 million unauthorized immigrants in 2015. In the aftermath of the financial crisis, unauthorized immigration grew by a small 70,000 per year (Note #5). In the 2000s, the influx was almost 500,000 per year, and that was a decline from the record 1.4 million apprehended at the southern border in 2000. In 2019, the number of border apprehensions will approach one million (Note #6).

Numbers like these cause Americans to disagree strongly about policy choices related to immigration. In the 1980s, in the late 1990s and again in the 2000s, the numbers were high and we argued. This time is no different. These numbers don’t include visa overstays which make up 40 – 50% of the unauthorized immigrant population (Note #7). Let’s guesstimate the population at 15 million, about 4.6% of the population. That 4.6% is paying less than 1/2% of total taxes.

We can go look at unauthorized immigrants and say that they are leveraging their taxes – paying a small amount of tax to receive proportionately more in benefit. But that is the case for all low-income people, unauthorized or not. Low-income people buy less stuff, so they pay less in sales tax. They live in lower-valued properties, so they pay less property tax. They make less money, so they pay less income tax. Those are the three primary sources of tax revenue in the U.S.

When President Trump said he wanted higher quality immigrants, he meant that he is not anti-immigrant. He is anti-poor-immigrant. Like Trump, some say we don’t need more poor people; we already have too many poor people.  Some people anticipate that their taxes will go up to provide benefits for the growing number of poor people, documented or not. Few want higher taxes to pay for services to people who just arrived in the country.

When my grandfather came to this country more than a 100 years ago, there was no income tax, no social security tax and property taxes were relatively low. The only benefit for immigrant families was public education. There were no school lunches, no food stamps, no medical care for children. Despite that, anti-immigrant sentiment was strong enough to pass a bill in 1924 that cut off legal immigration for all except northern Europeans. Our grandparents and great-grandparents were far less tolerant of immigrants than we are today.

Let’s keep some perspective. People who are concerned that they will have to pay higher taxes for benefits are not evil or uncaring. Low-income people who are worried about competition for their jobs in the construction industry are not moral slugs. Whatever your occupation, imagine that the number of people available to do that kind of work doubled in your community. How would you feel? The more the merrier? Probably not. Those workers will compete for your job and that competition will hamper any future salary increases you can expect.

We all need to admit that immigration presents complicated moral, political and economic choices. History has taught us that we don’t know how to solve this problem in a way that satisfies most of us. Each time we have to choose which side of the rope tug we are on. Each side hurls insults and curses at the other side. This is not the new normal. This is the old normal. How about if we try the new normal, sit down and hash out the difficult details of a compromise?

////////////////////////////

Notes:

  1. Homeland Security uses “unauthorized” to refer to those in the country without proper authorization
  2. Tax Policy Center calculation of total taxes paid to governments at all levels  
  3. Estimate of taxes paid by unauthorized immigrants – PDF
  4. IRS data on payroll and income tax paid by unauthorized immigrants- PDF
  5. Estimate of unauthorized immigrants – PDF
  6. Apprehensions at the border – CBP
  7. Visa overstays – Potitifact

Tax Brawl

Taxation with representation ain’t so hot either – Gerald Barzan

August 26, 2018

by Steve Stofka

The debate over taxes focuses on the size of national programs, and the Federal taxes collected for those programs. In the past fifty years, state and local government (SLG) taxes have risen to equal the burden of Federal taxes. Despite this rise, SLGs must increase tax revenues to meet obligations and historic growth rates. Republicans control most states and will turn to property and sales tax for the additional revenue.

Fifty years ago, SLG tax receipts were half of all Federal tax receipts, including Social Security. For every tax dollar a worker sent to Washington, he sent fifty cents to his SLG. During the past decade, the SLG tax share has averaged ninety cents.

StatePctFed

In the engine model I first introduced in July, Federal taxes were drained from the economic engine. Because SLGs do not have super powers to create money, their taxes stay within the engine and grease the gears. 72% of SLG taxes are under the category of mandatory business production – they are levied on goods and services received by the taxpayers. These include property, sales and business taxes and a plethora of licensing fees. A family who cannot pay their property taxes loses their home. Sales taxes are mandatory at the time of purchase. When SLG taxes are high, households must work more hours or cut expenses to meet the burden. Unlike Federal taxes, higher SLG taxes can force families to work more and increase GDP (Note#1).

For the past thirty years, SLG taxes have grown 6.6% each year, 1-1/2% above the 5.2% annual growth in spending. In the past ten years, tax receipts have grown at half that rate – 3.2%, barely above the 3.0% growth in spending. SLGs have not saved enough to meet the pension benefits and medical care promised the Boomer generation. SLGs will need to raise revenues, cut spending or both.

23% of total SLG tax receipts are taxes collected on personal income. Taxes on business income make up an additional 5%. Sixty years ago, those personal and business shares of the SLG tax pie were 7% and 3%.

SLGIncPctSLGTotal

Republicans oppose raising taxes, especially income taxes, and they control the legislatures in 32 states. In 26 of those states, they control the governorship as well (Note #2).  Democrats have total control of only six states, one of them California, where income and sales tax make up a whopping 50% of state revenues (Note #3). Many SLGs will cut spending and raise additional revenue through higher property and sales taxes and licensing fees. This lowering of the income tax share will move the mix of income and production taxes to the model of sixty years ago when production taxes were 87% of total SLG tax receipts.

In 2017, single family homeowners averaged $3300 in property taxes. Some states like Colorado have low property taxes averaging only $2000 (Note #4). Personal property taxes have averaged almost 7% annual growth during the past thirty years. Expect 8 – 10% annual growth in the next decade and a population shift to those states which can curb the growth of their taxes. Angry homeowners and taxpayers are sure to kick up a ruckus at City Councils and State Legislatures around the country.

//////////////////////////////

  1. In 2007, Christina and David Romer analyzed the effect of tax changes on GDP. They found that a 1% exogenous tax increase resulted in a 2 – 3% reduction in real GDP. They classified tax changes implemented for long-term growth as exogenous. Here is a one page summary of the PDF.
  2. One of several sources on Republican dominance of state legislatures. The Hill.
  3. Income and sales tax make up 50% of California’s tax revenues (CA Research Bureau)
  4. Denver Post article on property taxes

//////////////////////////////////

Miscellaneous

NYT had an article on senior scams this week. Because those older than 50 own 70% of deposit balances, they are prime targets of fraud. This was novel: a retired IT pro who thought he was working from home as an employee gave his new “employer” his bank information so that his paycheck could be direct deposited. Common scams: Check fraud is still common, as are overpayments and other excuses to get you to give up your bank account information. Only you should be initiating such a transaction.

Vanguard’s projections of expected returns for various asset classes over the next ten years. Domestic stocks 3.9%. Bonds 3.3%