November 20, 2016
Did you know that the U.S. has the highest Presidential voting record in the world? 100%. No other country comes close. How do we achieve this extraordinary participation rate? The Electoral College (EC).
What the heck is the Electoral College and why doesn’t any other democracy use this system? Firstly, the U.S. is not strictly a Democracy, in which people vote directly for their leader. It is a democratic (small ‘d’) republic. Within this republic, the states are semi-autonomous regions in a Federal alliance. It is the states, not the people, who elect the President.
Each Prez election is a survey conducted by the state asking its citizens: who do you want the state to vote for in the Presidential race? The survey is voluntary. Each state has its own rules for participation in the survey. Federal election law specifies a set of common rules that each state has to follow in conducting their survey.
Each state gets a certain number of Electoral College votes based on population. The survey in each state simply tells the state what the wishes of the people are for President. There is no requirement in the Constitution that a state must follow the survey results, but each state has, over time, passed state laws that promise to abide by the will of the people in that state.
In 2000 and again in 2016, the Democratic candidate won the popular vote of all the states but lost the state by state vote in the Electoral College. Some people in dense urban areas who vote Democratic would like to abolish the Electoral College. If there were no college, Presidential candidates could concentrate their campaign resources and promises to win the vote in the urban areas and largely leave the less populous areas of the country alone.
In the current system, a candidate must mount a campaign that involves and employs people in each state, a difficult if not impossible task. The appeal and focus of the campaign must be broader than just urban or rural areas. Resources and time are limited so a candidate must make critical choices regarding the deployment of those limited tools.
A candidate must surround him or herself with smart people who can:
1) organize and deploy human and media resources within each state,
2) organize the outreach for financial support,
3) search for and identify undercurrents of sentiment and concern in each state,
4) compact a message that will resonate with those sentiments and concerns,
5) sample and analyze the ongoing responses to a candidate’s message.
There is an algorithmic strategy used in many fields called “win-stay, lose-shift.” The problem is commonly called the multi-handled bandit. In a casino with many one-armed bandits what is the best strategy to maximize profits and minimize losses? Mathematically, the problem may be insoluble but a reliable quasi-solution exists that is better than chance. Stay with a particular bandit as long as it wins, then shift when it loses and start again.
Donald is a casino owner so he may be familiar with the strategy and used it quite successfully to conduct an unusual campaign. A campaign has a number of characteristics – a saying or slogan (“Si se puede” or “Build the wall”), a policy (foreign trade or national security), an issue (abortion or honesty), or an attitude (impassioned, combative, or calm and reassuring). A candidate feeds people’s sentiments into each of these characteristics like one would feed coins into a slot machine. Now pull the handle. If that theme pays off the majority of the time, then stick with it. If it doesn’t, then shift.
Now here’s the brilliant part that Donald played whether he was conscious of it or not. Every political bandit that was a loser for Donald Trump was not only abandoned but moved over to Hillary’s casino. In many cases, she couldn’t win at them either.
Honesty? Donald had a problem. Load up the honesty bandit and move it over to Hillary’s casino. Let her feed people’s sentiments into that bandit and see if it pays off. The woman issue? Another non-paying bandit for Donald. Again, move it over to Hillary’s side and let her see if she can win with the machine. In both cases, she pulled the handles over and over again with only modest success.
Each Presidential campaign seems to bring some new innovation. Successes are often incorporated into later campaigns. Obama’s campaign was noted for its ability to raise money online with many small donations. The campaign carefully tested the appearance of different web pages, measuring even the appearance of one click button over another. Obama outraised his opponents in the 2008 and 2012 campaigns. In the 2016 race, Hillary Clinton and her superPACS outraised Donald Trump almost 2:1, yet he won. (Bloomberg)
We should all wish that a President has a successful term. Unsuccessful terms are usually accompanied by economic and military events that are not good for ourselves, our families, and our communities. Whether Donald Trump has a successful term or not, he has certainly made a long lasting impact on future campaigns for President. Who can be out with the first book? Already CNN is advertising a comprehensive look at the election. As we put a bit more distance in the hindsight mirror, expect a number of books on the election. Masters’ theses and doctoral dissertations will explore the many aspects of the campaign.
//////////////////////////////////
Election Autopsy
After each Presidential election, those in the campaign business do an autopsy of both the losing and winning campaigns. What worked? What didn’t? Dems need to ask themselves if they neglected the needs of everyday working Americans. In 2008, Obama promised that the needs, values and perspective of his grandparents, who raised him, would guide his decisions. Then he and his party started bailing out the banks, car companies and solar industry as many ordinary people struggled and suffered with job loss, home loss and bankruptcy. With majorities in both Houses, he fiddled with decades old Democratic dreams like healthcare and climate change while working class Americans felt discarded.
Some attribute the heavy Demcratic losses in 2010 to Obamacare but that was only a symbol for the larger betrayal that many Obama voters felt. Having control of both the Presidency and Congress is a mandate that a party can abuse. It is given to that party to get something done fairly quickly. When a political party uses it for pet projects, people turn away or vote the other way. Many turned away in the 2010 election. Six years later, Republicans control the majority of state legistatures, the governerships, the House and Senate.
As Majority House Leader, Nancy Pelosi certainly had a hand in the growing disaffection with the Party yet she insists that she should continue in her role as Minority Leader. Her strength as a formidable fund-raiser may prove to be the winning card that trumps her past errors.
/////////////////////////////////
Vaccines
A familiar meme on social media is that there is a vaccine conspiracy between pharmaceutical companies and the government who force parents to vaccinate their children and pad the pockets of Big Pharma. The U.S. has a policy of giving infants and children more vaccines than any other developed country. Do pharmaceutical companies make millions off vaccines? You be the judge.
The PVC13 vaccine given to older people costs the provider $16 per dose (CDC Price List). In March 2016, the discounted price from Kaiser was $313 for the vaccine alone. The labor to give the vaccine was a separate line item. That is a 2000% markup on the vaccine itself by Kaiser, not the manufacturer.
It is the providers who administer the vaccines who make the money. Investors who own the stocks of a pharmaceutical company often pressure the company to get out of the vaccine business because most vaccines are low margin products and yet carry partial liability.
If the pharma companies don’t want to bother making many vaccines, should the government simply build their own vaccine manufacturing labs? Patents and other intellectual property could be a hurdle but Congress could arrange to purchase them or use eminent domain to set a price and seize the intellectual property.
//////////////////////////
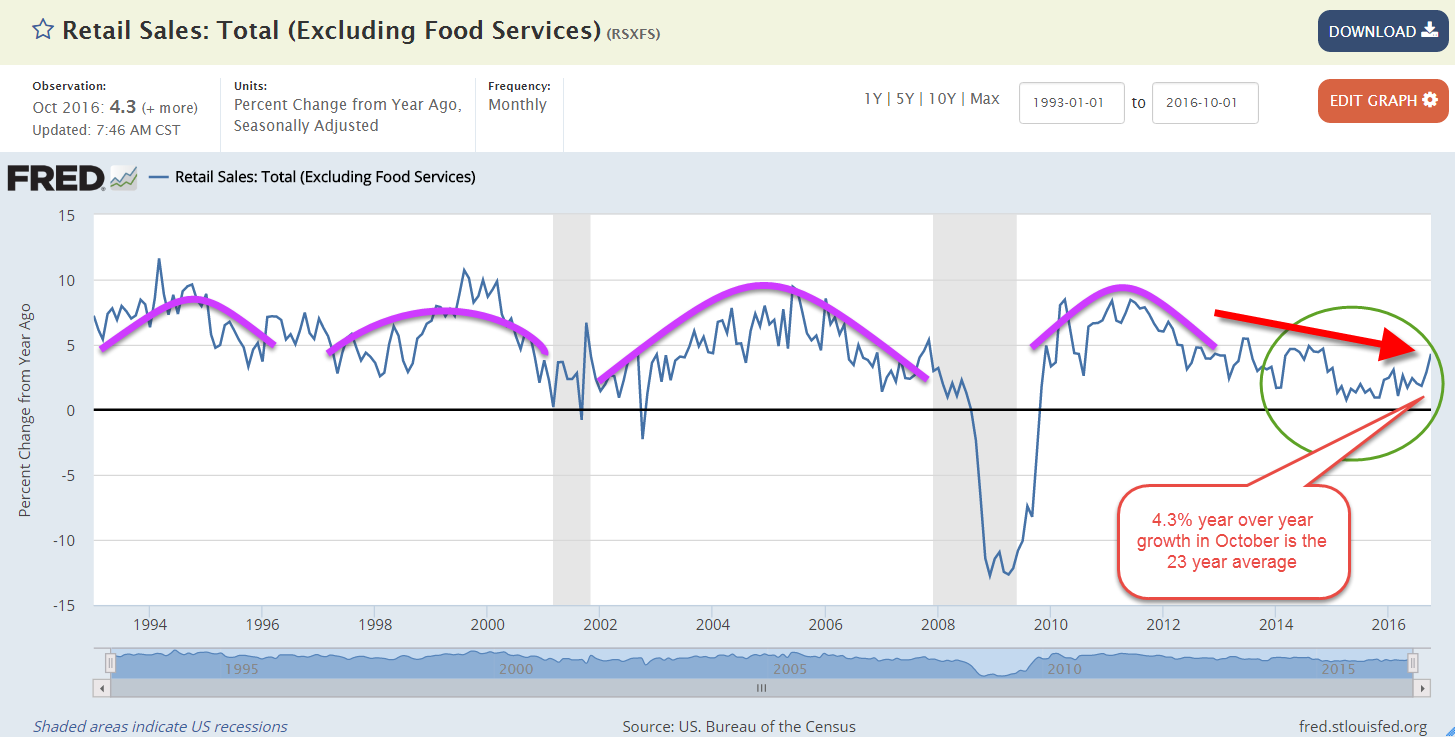
Retail Sales
Average = Strong. When growth is rather anemic, a return to average seems strong. In October, retail sales rose 4.3% above October sales in 2015, a welcome bump up from the lackluster growth of the past two years. Last month I showed that recent sales growth less population and inflation growth has been negative or close to 0.
The stock and bond markets have been shifting money around in anticipation of fiscal stimulus and more relaxed regulation from a Republican Party in control of the levers of government. Small business stocks (VBR) are up more than 10% and financial companies (XLF, VFH) have shot up about 12%. Consumer discretionary stocks (XLY, VCR) are up about 4% while the more defensive consumer staples stocks (XLP, VDC) are down 2%. Oil stocks (XLE, VDE) are up about 3%.
Will consumers put aside their cautions and spend more? Active stock managers are certainly hoping so.
/////////////////////////
Ideas for IRA contributions
Emerging market stocks are still up 8% YTD after falling more than 6% in November. Much of that decline has come on the heels of Trump’s election win.
A broad bond index has fallen almost 4% in the past few months.