June 23, 2019
by Steve Stofka
After the Federal Reserve meeting this week, traders are betting on a cut in interest rates in July and the market hit all-time highs. Is a cut in interest rates warranted at this time? Such an action is usually taken in response to weak employment numbers, a decline in retail sales or sluggish GDP growth. Let’s review just how good the economy is.
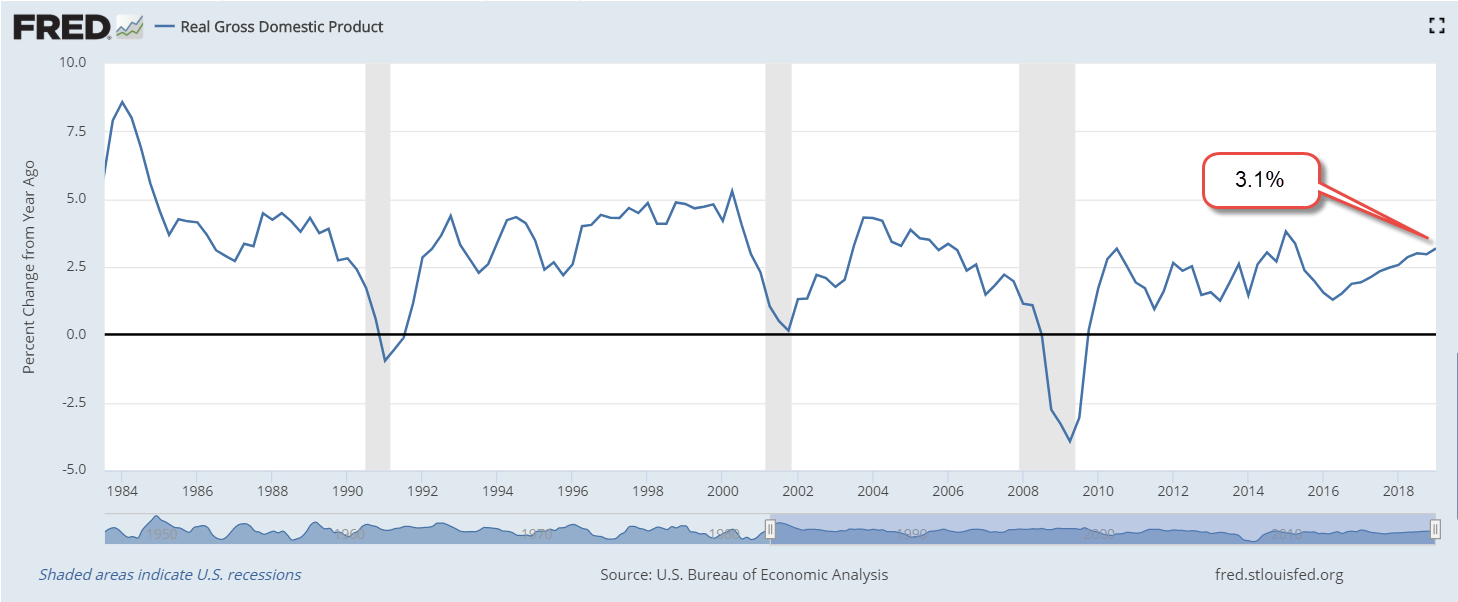
Unemployment is at 50-year lows. The percent of people unemployed more than fifteen weeks is near the lows of the late 1990s. At almost 18 million vehicles, auto sales are near all-time highs. Real retail sales continue to grow more than 1% annually. In the first quarter of this year, real GDP growth was over 3%. Ongoing tariffs may cause real GDP to decline one percent but a growth rate above 2% is above average for this recovery after the financial crisis.

Corporate profits have been strong. In fact, that may account for the volatility of the past two decades. The chart below is after tax corporate profits (CP) as a percent of GDP. The multi-decade norm is in the range of 5-8% but the past twenty years have been above that trend except for the plunge in profits and GDP during the GFC.
Companies have paid part of those extra profits as dividends to shareholders who tend to be cautious pension funds or older, wealthier and more cautious individuals. Some profits have been used to buy back shares and boost the return to existing shareholders.
Despite the above average profits, investors still have a strong thirst for lower yielding government debt. Why? The Federal Reserve has kept interest rates below a market equilibrium, which is currently about 3.8%, far above the current 2.4% federal funds rate (Note #1). As with any price ceiling, the below-market price creates a shortage. In this case, the shortage is in the capital investors want to supply to governments to meet the demand for capital. Consequently, investors have been searching for alternative substitutes or near-substitutes. That distortion is being reflected in stock market prices.
Despite a strong economy and corporate profits, the SP500 has gained less than 5% from its peak high in February 2018 after the passage of the 2017 tax cuts. Including dividends, the SP500 has gained just 5.7% in 16 months. If we turn the clock back a few weeks to the end of May, the total return of the SP500 during the past fifteen months was a big, flat zero. Those gains of the past sixteen months have come in the past three weeks on the hope and the hint of rate cuts.
An intermediate bond ETF like Vanguard’s BIV has returned 5.2% in the same period. On a scale of increasing risk 1-5, with 1 being a safe investment, BIV is rated a 2. The SP500 is rated a 4. Investors buying the broad stock market have not been rewarded for the additional risk they are taking. How long will this situation persist? For as long as the Fed keeps a price ceiling on interest rates.
///////////////////
Notes: A popular model of equilibrium interest rates is the Taylor rule proposed in 1993 by John B. Taylor, a member of the Council of Economic Advisors under three presidents. The Atlanta Fed has a utility that calculates the current rate and allows the reader to change the parameters. Click on the graph icon, accept the default parameters and the utility graphs the equilibrium rate and the historical Fed funds rate.