This week, the Congressional Budget Office (CBO) released their estimate of the fiscal impact of the AHCA, the draft version of the Republican health care reform plan. I’ll take a look at the CBO methodology later in this post. For those who may be tiring of the almost constant focus on the AHCA, let’s turn our attention to some economic indicators.
/////////////////////
CWPI (Constant Weighted Purchasing Index)
February’s survey of purchasing managers (PMI) indicated a broad base of confidence among purchasing managers in most industries. New orders in manufacturing are surging, an expansion more typical in the early stages of recovery after recession. Regardless of how one feels about Trump, there is a sense of renewal in the business community. Consumer Confidence is at record highs. Confident of finding another job, the number of employees who are quitting their jobs is at a 16 year high.
The CWPI is a composite of both the manufacturing and non-manufacturing PMI surveys and is weighted toward the two strongest indicators of future growth, employment and new orders. Since October, the composite has been rising from mild to strong growth.
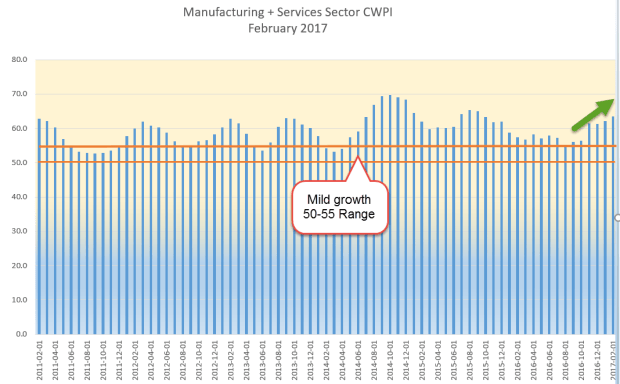
For most of 2016, new orders and employment were below their five year average. Since October, they have been above that average.

//////////////////////
Housing
The Housing Market Index released by the National Assn of Homebuilders just set a multi-year record. Housing starts are strong and single family homes under construction are the best in ten years. A popular ETF of homebuilders, XHB, is nearing a recovery high set in August 2015. 58,000 construction employees found work during a particularly warm February. Now the big picture. As a percent of the working age population, housing starts are still at multi-decade lows.
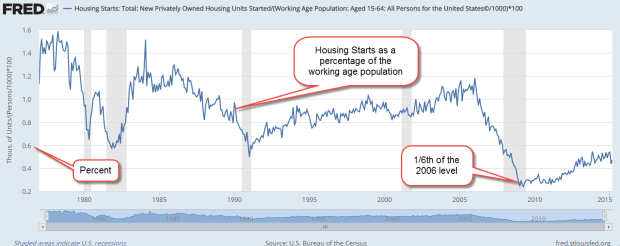
There has been an upshift toward multi-family units in some cities but, in a broad historical context, these are also near all time lows as a percent of the working age population.

A primary driver of new housing construction, both single and multi-family, is the growth in new households, which is still soft. In 2016, households grew by 1%, below the 30 year average of 1.2%, and far below the 70 year average of 1.7%.
//////////////////////////////
Consumer Credit
Here’s an interesting data series from the FRED database at the Federal Reserve: the percent of people with subprime credit in each county. Click on the link and zoom in to see the data for a particular county. In New York City, Manhattan has a 16% subprime rate, less than half the 35% rate of the nearby Bronx. Give the link a few seconds to load the data and display the map.
Subprime
On July 1st, the credit rating agencies will remove tax liens and judgments from their records if liens do not include the full name, address, SSN or date of birth of the debtor. This will raise the credit scores of hundreds of thousands of subprime consumers.
//////////////////////
Real Estate Pricing Tool
Trulia has a heat map, by zip code, of the median home price per square foot. I will include this handy tool on the tool page.
//////////////////////
IRS Data
Of the 145 million returns filed, 46 million itemized deductions. Under the Republican draft of tax reform (PDF), almost all deductions would be eliminated in favor of a standard deduction that is almost twice as large as current law, $12,000 vs. $6300. (Deductions, Child Credits ). Half of capital gains, interest and dividends would not be taxed. For most filers, the dreaded 1040 tax form is only 14 lines. Publishers of tax software like Intuit are sure to lobby against such simplicity.

Health insurance reform is the prerequisite to tax reform. If House Speaker Paul Ryan encounters strong resistance in his own party to health insurance reform, his tax reform plan will be stymied as well.
/////////////////////////
AHCA
This past Monday, the Congressional Budget Office released their “score” (summary report and full PDF report) of the American Health Care Act, or AHCA. Score is a euphemism for the 10 year cost estimate that the CBO customarily gives on proposed legislation.
The CBO was careful to stress the uncertainty of their estimate. A critical component is the human response to changing incentives and the tentativeness of future state legislation. With most major legislation, the CBO estimates the macroeconomic effects. They did not include such an analysis in this report and note that fact. In short, the CBO is saying “take this estimate with a grain of salt.”
The headline number was the amount of people estimated to lose their health insurance over the next ten years – a whopping 24 million. Democrats used this ballpark estimate as a defining fact as they bludgeoned the plan. How did the CBO come up with their numbers?
Medicaid is the health insurance program for low income families and individuals. When the program was introduced in 1965, enrollment was 1/4 million. Today, 74 million are on the program. The federal government and states share the costs of the program; the federal share averages 57%. Under the ACA’s Medicaid expansion, low income individuals younger than 65 without children could enroll. An increase in the income threshold enabled more people to qualify for the program. The federal share was guaranteed to not fall below 90% of those individuals enrolled under the expansion guidelines.
Medicaid (CMS) reports that 16.3 million people were added to Medicaid under the ACA expansion program and represent almost 75% of all enrollment under ACA. California has 12% of the U.S. population, but accounts for more than 25% of additional enrollees under Medicaid expansion. (State-by-state Medicaid enrollment ) Only 31 states adopted Medicaid expansion. The CBO estimates that those 16.3 million are 50% of the total pool of individuals that would be eligible if all states adopted the expansion program. So the CBO estimate of the total pool is almost 33 million.
Undere current law, the CBO estimates that additional states will adopt expansion so that 80% of the estimated total pool, or 26.4 million, will be enrolled under Medicaid expansion by 2026. Under the AHCA, the CBO estimates that only 30% of that eligible population of 33 million, about 10 million, will be enrolled as of 2026. 26.4 million (under ACA) – 10 million (under AHCA) equals 16 million whom the CBO estimates will lose coverage under Medicaid. Note that this is a lot of blue sky math.
To summarize the ten year loss estimate under the rollback of Medicaid expansion: 6 million current enrollees and 10 million anticipated enrollees.
Medicaid expansion accounts for 16 million fewer enrollees. Where are the remaining 8 million missing? In the non-group private market. Currently, there are 11.5 – 12 million enrolled in these individual plans, an increase of about 5 million over the 6.6 million enrollees in 2007 (Health and Human Services brief) . The CBO estimates that, in 2018 and 2019, 2 million additional enrollees would take advantage of the ACA subsidies to buy policies. That results in a potential pool of about 14 million. Under the AHCA, the CBO estimates that the non-group private insurance market will return to its former level of 6 – 7 million, a loss of about 8 million.
Voila! 16 million under Medicaid expansion + 8 million in non-group private insurance = 24 million loss.
/////////////////////
Side Note
How do people get their health insurance?
74 million people, about 25% of the population, are enrolled in Medicaid. Half of Medicaid enrollees are children.
55 million, about 16% of the population, are on Medicare.
Over 150 million, or 50% of the population, are enrolled in an employer group plan (Kaiser Family Foundation).
Approximately 27 million, or 9% of the population, are uninsured.
Before the ACA, almost 50 million, or 16% of the population, were classified as uninsured. About 6 million of these uninsured had high deductible insurance plans called catastrophic plans. Offered by large insurance companies, they contained exclusions for pre-existing conditions, did not cover pregnancy, or mental disease, but were adequate for many self-employed tradespeople, contractors, consultants and farmers. (Info) In late 2013, the ACA redefined catastrophic plans by specifying the minimum benefits that a catastrophic plan must offer and, in 2014, began offering these plans through the state health care exchanges.