The Bureau of Labor Statistics (BLS) released their monthly Employment Summary this past Friday and the market cheered, the Dow jumping up 100 or so at the open. The Sunday talk shows have been abuzz about the report, which showed a January gain of 243,000 jobs. After 5 months of increasing job gains, how improved are Obama’s chances of re-election? Does the improving job picture cause the Republican Presidential contenders to change course a bit? Wanting not to appear as though they are rooting against the American economy, do the contenders aim at specific policies of Obama in the coming months? With the S&P500 index at 1344, some market pundits are whispering the 1500 mark that the S&P could take a run at this year. Holy moly, macanoli, what a buzz about one labor report!
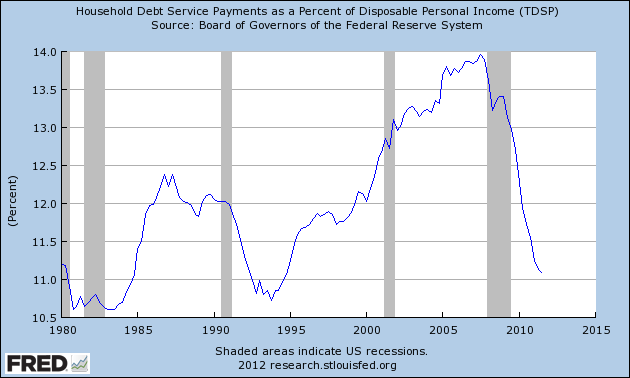
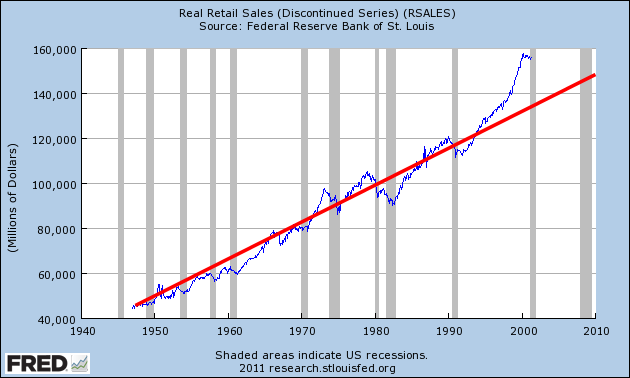
The labor report is only part of the picture puzzle that shows an improving economy. The ISM manufacturing report was slightly below expectations but still growing. Two key components of the index, new orders and backlogs, showed a robust increase, hinting at continuing improvement in the coming months. The recent durable goods report shows that businesses are building inventories, a sign that expectations are improving. Retail sales tapered off in December, but Personal Income was slightly above expectations, growing .5% over November. Caterpillar, the large equipment maker, is looking forward to revenue and profit increases in 2012, reducing earlier concerns of a global recession. A recent report indicates that the ongoing contraction in China’s manufacturing has slowed and is close to the neutral mark between contraction and growth.
So, what’s not to like?
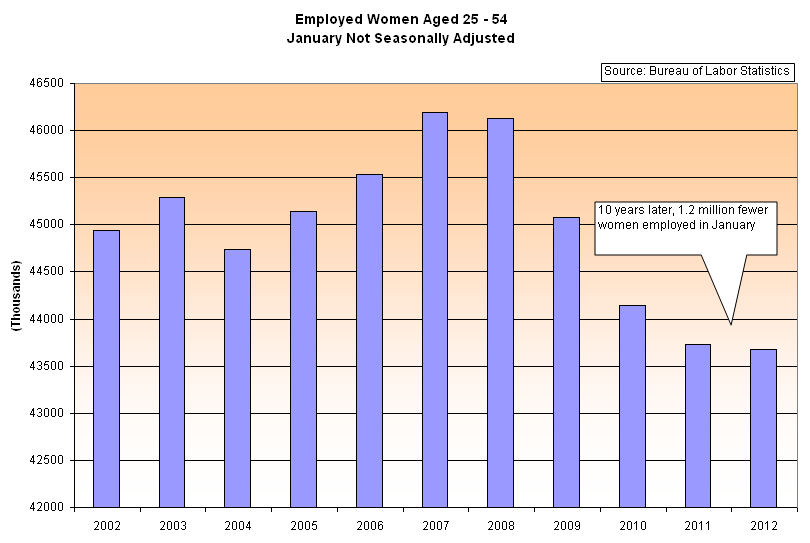
Looking past the monthly headline numbers of job growth, let’s look at this country’s core work force, men and women aged 25-54. The BLS just made several census adjustments which resulted in upward revisions to seasonally adjusted job growth from April to December. Instead of looking at seasonally adjusted numbers, I’ll take a look at the raw numbers from the BLS employment report for January and compare them to BLS January data for the past ten years.
A unseasonably warm winter throughout much of the U.S. gave a boost to construction jobs in the office building and multi-family residential construction. Although the construction industry is still far below 2007 levels, that boost shows up in a comparison of employed men aged 25 – 54 from last January to this January. (Click to enlarge in separate tab)

The ongoing attrition in government jobs, which disproportionately employs women, has slowed but is still evident in comparisons with past Januaries.
This rather tepid growth, or lack of it, in our core work force is troubling. This age demographic forms the backbone of a healthy economy, raising children, buying furniture and homes, saving for retirement and their kid’s college. Any job growth is good, but when I see a better improvement in the employment numbers for this group, I will know that we are building a resilient economy, one that can withstand some shocks. We know of some possible shocks – the probable default of Greece, the ongoing recession in Europe and the possibility of some armed conflict with Iran, to name but three. The shocks we don’t forsee are what can push our economy off balance. Last year was a reminder of the impact of unforeseen shocks. The tsunami in Japan and the flooding in Thailand not only devastated those countries and their people but impacted supply chains in Asia and consequently sent after shocks throughout the world.
Recently fashionable has been talk of a decoupling of the U.S. and emerging countries’ economies from the sovereign debt and financial troubles in Europe. If recent history has taught us nothing, it is that much of the world is joined together by interdependent webs of financial conglomerates and the monetary policies of nation states, by the tension between global consumer demand and multi-national supply chains to meet that demand.