Future Fumbles

Every Christmas, the President and his faithful scribe journey to Camp David near Thurmont, MD. There on the top of the mountain they wait for God to give them the 10 year economic forecast, including the projected GDP and unemployment rate for the nation. In February, or January if the President is leaving office, he presents the tablets of wisdom to Congress in the annual budget. The Congressional Budget Office then uses these projections to score various spending bills and programs, divining their future impact on the budget of the nation.

Actually, the economic forecast is painstakenly crafted each January by the President’s economic advisors, who are locked in a dungeon on the 4th sublevel under the White House, where they tear at each other limbs until the victor emerges from the dungeon gloom with his forecast, which he presents to the President.

In January 2001, just as President Clinton was leaving office, he presented what is called the “Legacy” budget to Congress. It included a robust growth of 5.4% in GDP during the early part of the 2000s, tapering to a 5.1% growth at the end of the decade. This rosy projection was far above the 3% that the nation had experienced during the past thirty years. After 9-11, President Bush’s administration revised growth projections to a more reasonable 2.2% growth for 2002, then forecast a slightly more subdued GDP growth than Clinton had envisioned but never below 5%. So how did these prognostications match up with reality? Below is a chart of projections (Source – last table on the page) and the official GDP numbers as determined by the BEA. (Click to enlarge in a separate tab)

Actual GDP numbers were a bit above Bush’s post 9-11 forecast – until 2009 and 2010. Projected 2009 GDP of $15 trillion was almost a trillion more than what we actually produced. 2010’s performance was more than a trillion below Bush’s forecast 8 years earlier. Federal revenues average about 18% of GDP so each trillion below GDP projections represents $180 billion in revenue that is not going to come into the Treasury as planned. Those plans assume unemployment at less than 6%. As it has climbed to above 9%, the shortage of revenue is even more pronounced.

Below is a chart of projected unemployment rates for the past decade and the actual average unemployment rate for each of the past eight years. Clinton’s projections, occurring before 9-11, were rosy. Bush’s post 9-11 projects were fairly accurate. His economic team anticipated a faster rebound after the recession of 2002 but the unemployment rate actually dropped below projections during the heated years when the housing market rose dramatically.
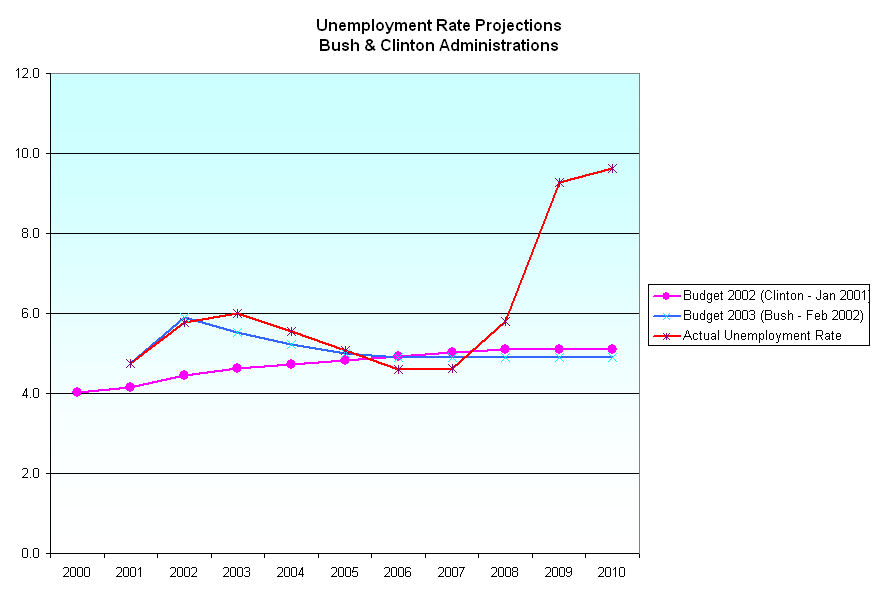
What neither projection could envision was the severe recessionary unemployment of 2008 – 2010. What becomes obvious is that Presidential budget forecasts have not included recessions unless they were ongoing at the time of the forecast. Since recessions occur fairly regularly in an average seven year cycle, it appears that these forecasts are unrealistically optimistic. Since they help determine economic policy, spending on social and defense programs, they should include such a likelihood or we are doomed to be “surprised” at the onset of every recession. Each “surprise” results in a deficit, adding to the total debt of the nation.

Under the current budget process, there is no upside for a President’s economic team to project recessions since it means a projection of less revenues for the government, and thus, less funding for their programs. A more realistic budget process would include at least a mild recession every 7 years. If a President is elected and there has not been a recession in 3 years, then his forecast assumptions should include a recession 4 years in the future. Unrealistic optimism only hurts both the finances and the spirit of our people when recessions occur, revenues fall and programs have to be curtailed or cut.

Mortgage Mosh Pit

In my series of Federal teat suckers, I’ll now look at the housing market.  If you are a homeowner with a 30 year mortgage, it might surprise you to find that you are on the home stamp program, a program that may pay you each month about the same as the average food stamp recipient.

President Obama has recently spoken about a 5 – 7 year transition of the mortgage market from federal quasi-governmental agencies like Fannie Mae and Freddie Mac to the private market.  The problem is:  private market lenders do not want to loan money to homeowners for thirty years.  A 30 year mortgage has no prepayment penalty so that the homeowner can pay off the loan at any time and refinance when rates are lower.  In the private market, lenders – and bondholders – like to be paid more interest when they tie up their money for longer periods of time and 30 years is a very long time. A history of the 30 year mortgage.

Let’s compare Joe homeowner to one of the largest and most dependable companies in the world – Johnson and Johnson (J&J).  For more than a 100 years, this company has regularly paid dividends to their stockholders and paid off their bonds.  In August 2010, the company sold 30 year bonds at 4.5% (Source).  Joe homeowner could get a 30 year mortgage for about 4.4% at that time.  What would you choose if you had the money?  Loan it to J&J or loan it to Joe homeowner for his mortgage?  In a realistic private mortgage market, Joe homeowner, with a good credit rating, would need to pay 2 – 3% above what Johnson and Johnson is paying simply because Joe is a riskier bet than J&J.  But that higher interest rate would price a lot of potential homeowners out of the market. 

The monthly mortage payment (PI) on a $250,000 30 year loan at 5% interest is $1342.  At 7%, the monthly payment is $1663, more than $300 higher.  At 8%, the monthly payment is $1834, a $500 free monthly premium to the homeowner.  So why do banks and mortgage companies loan money on mortgages?  Because the Federal government backs 90% of the mortgages in this country.  The government and its quasi-government mortgage agencies effectively loan the credit rating of the richest country on the planet, the United States, to little Joe homeowner, enabling him to save hundreds of dollars each month on his house. 

In Colorado in 2007, a low income family of 3 received a little over $400 a month in food stamps (Source).   Food does not build equity –  homes do.  The government’s home stamp program pays Joe about as much as the food stamp family and lets him keep any home appreciation – or lately, depreciation.  In addition to the home stamp program, the federal government has a stamp tax program that enables Joe to write off most of his mortgage payment for the first ten years since it mostly interest.  Not only does Joe get $300+ a month in savings on his mortgage but gets an additional $150+ a month in reduced income taxes. 

Until the meltdown in the housing market, the thinking was that real estate values always went up so the government was happy to loan its credit rating to homeowners at little or no cost.  Happy teat-sucking homeowners voted for the politicians who continued these home welfare programs. Then, in 2007, the unthinkable happened.  First home prices stopped rising, then started to decline in some markets.  Then the banking crisis of 2008 hit and price declines accelerated, leaving many recent homeowners “underwater”, owing more money on their house than it was worth.  Job losses and continuing price declines led many homeowners to walk away from their homes.  As of mid 2010, Fannie Mae and Freddie Mac had “borrowed” $148 billion from the Treasury (Source) to make up for the losses.  Mega-banks have written down billons and some estimate that the default total will approach $1 trillion.

In a recent Bloomberg article, “About $600 billion of the [Option ARM – Adjustable Rate Mortgage] loans were made from 2005 through 2007, according to industry newsletter Inside Mortgage Finance. Of those packaged into bonds, some 20 percent have been liquidated at losses to investors, and almost half of the remaining ones are at least 30 days delinquent, in foreclosure or have been seized by lenders, according to data from JPMorgan.” “A model developed by JPMorgan Chase & Co. analysts predicts that 70 percent of remaining option-ARM loans that were bundled into bonds will eventually default.” 

The federal government will continue to be pumping in money to the home stamp program for years.  The $148 billion already pumped in is just a down-payment on this program.  In his 2012 Budget, Obama wants to spend $85 billion on the Food Stamp program called SNAP, an annualized increase of 7.5% over 2010 spending.  If only we could hold the increases in the cost of the home stamp program to those levels.

Fiscal Foolery

Along with the 2012 budget proposal, the Office of Management and Budget at the White House, updates the historical tables of receipts and outlays based on information from the Treasury and other departments.  Below is a chart of 70 years of Federal receipts, including social security tax receipts.  As you can see, we are at near historic lows.  The small spike in receipts in 1969 occurred when the Johnson administration adopted a unified budget which included social security funds, which hid the true cost of the Vietnam War. (Click to enlarge in separate tab)

The chart below shows a 70 year history of total federal outlays, including any social security payments.  Spending in this past year was about the same level as under President Reagan in 1984.  It was too high in 1984 and 2010 but it is not at catastrophic levels, despite what you might hear.  When spending rose under the Reagan administration, Democrats sounded the alarm.  Now it is the Republicans turn to sound the spending siren on the Obama administration.

The problem is both spending and revenue. Spending needs to come down a few percentage points to a historical average of about 20% and revenue needs to increase to historical averages of about 18%. The  chart below shows the 65 year history of the annual surplus or deficit and the current extent of the problem – it’s a big problem.

The longer term problem are those historical averages.  Over several decades a country can not continue to spend 2% more than it collects.  The rational agreement would be to target federal outlays at 19% of GDP and increase revenues to the same amount.  Rational discussion takes leadership and courage, something that has been sorely lacking in Washington.  Our representatives have become poll followers, pandering to voters who turn like a weather vane in the economic wind.   

Back To The Future

President Obama released his 2012 budget proposal yesterday. House Republicans continue to sort through spending cut proposals for this year’s budget before they tackle the fiscal plan for next year. At about 15% of GDP, Federal revenues are the lowest in more than 50 years, prompting calls for higher taxes on the rich or draconian spending cuts. Over the next few weeks and months, the “budget battle” will drag on. You don’t need to wait for the blow by blow description. It has already been written – over 30 years ago.

Change some of the names and the dollar amounts in this 1978 Time article and you will have a fairly accurate description of the fiscal fight. In fact, you won’t need to change some of the names. Alice Rivlin, recently a member of the bipartisan Debt Commission, was then Director of the Congressional Budget Office. In 1978, she said “If you’re really concerned about the growth in Government, then you have to go after the uncontrollables.” That was the word then for entitlement programs and they have proved to be exactly that – uncontrollable. More than 30 years later, have they become any less uncontrollable?

Moocher Madness

President Richard Nixon famously said “I am not a crook.”  Everyday Americans say – not so famously – “I am not a moocher.”  Thom referred me to a blog at the NY Times which recounts the many ways in which most of us mooch off the government in one form or another and yet think we are not beneficiaries of a federal program.

Today President Obama released his budget for fiscal year 2012, which starts in September of this year.  Republicans pooh-poohed the President’s lack of effort to offer any serious reductions in federal government spending.  Some Democrats criticized proposed cuts or freezes in spending. Neither Republicans or Democrats want to talk about the 800 lb gorillas in the room – entitlement programs and defense spending, which take up about 70% of federal spending.  Republican politicians have vowed to cut spending but will find that most of their constituents get some kind of favor from a government program.  When Republicans begin to offer cuts to specific programs they may find themselves in a hive of angry hornets – their constituents.

Not all government programs hand out money directly to the beneficiaries of those programs.  Some programs are indirect transfers of money through tax credits and deductions.  Tax breaks for a minority of taxpayers are another form of spending by the government for that favored minority. 

A review of an IRS analysis of tax returns from 1990 – 2008 gives us a peek into the many government programs that offer tax advantages and how many of us claim these breaks.   When the bipartisan debt commission recently advocated for eliminating special tax favors like the mortgage interest deduction in exchange for lower tax rates, politicians on both sides of the aisle cowered.  In 2008, 34% of returns itemized deductions rather than take the standard deduction.  80% of itemizers take the home mortgage interest deduction so this one deduction becomes a reason for itemizing. Only a minority of taxpayers claim the deduction but it has become a sacred cow like Social Security and Medicare.

Low income seniors are treated favorably under the tax code. 17% of taxpayers received Social Security benefits in 2008 but only 60% paid any tax on that income.  Seniors vote.  What politician will touch that one?
17% of taxpayers claim the unearned tax credit, a subsidy program for low income families with children.  18% of taxpayers claim the child care tax credit.   14% of taxpayers claim a student loan interest deduction, an educational expense credit or a tuition and fees credit.

In one form or another most of us suck on the federal government’s teat.  Taxpayers claiming any farm income was only 1.3% of tax returns yet talk of abolishing farm subsidies is met by cries of anguish and anger from beleagured small farmers.  Most of these subsidies go to large multinational agricultural companies who raise the alarm when any mention is made of reducing or abolishing these programs.  Oil companies cry out if their tax allowances might be given over to solar and other renewable energy industries.

The majority of us enjoy tax breaks on any health insurance premiums – the portion paid by us and the portion paid by the employer. We don’t get a tax break for life, home or auto insurance – just health insurance. This tax benefit is another sacred cow.  No wants to give up their “gim-mes” from the federal government. 

Imagine a world where individuals and corporations pay a flat percentage tax on income; where there is no favoritism given to home buyers or oil companies.   It’s a horrible thought, isn’t it?

Tax Limbo

Back in the ancient days before the Internet, before Disco, even before the Beatles, Chubby Checker popularized a song called “Limbo Rock”. The dance craze involved bending backwards and shimmying under a limbo stick, a bar, that could be raised or lowered. An Olympic pole vaulter tries to get over the bar. A limbo dancer tries to get under the bar.

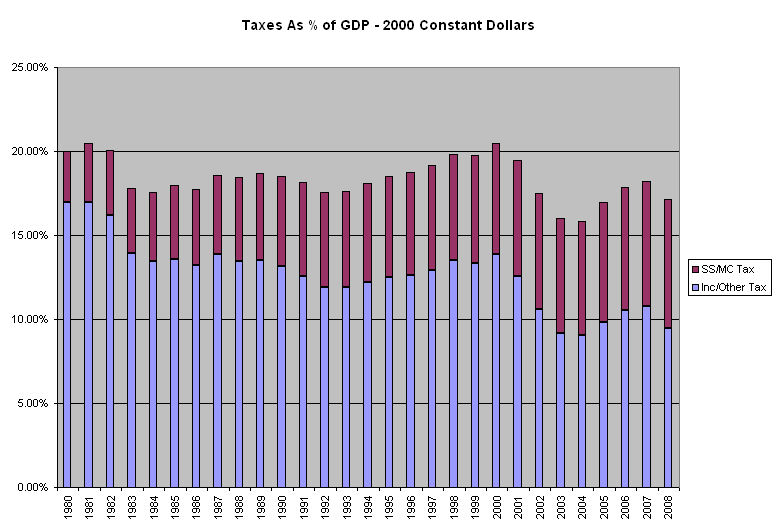
Below is a 30 year graph of Federal revenues as a percentage of GDP.

The Heritage Foundation has a 70 year chart of Federal revenues, showing the 18% historical average – the bar – of revenues to GDP and projected 2010 revenues of less than 15%.  The AP released a story today that Federal revenues for the 2011 tax year are also projected to be below 15%. 

We don’t like bending over backwards, so we party on under a different bar, one that we keep raising.  That bar is the national debt.

Those to the left of center will repeat their mantra that the government needs to spend more when times are tough.  “Raise the bar,” they chant. Those on the right will continue to press for more spending cuts (but not defense spending, their sacred cow). “Stoop lower,” they encourage.  A reasonably sane person would say we need both cuts and higher taxes if we are to avoid the long term problems of ballooning government deficits and long term debt.

Housing: Satellite View

A few weeks ago, Standard and Poors released their monthly Case-Shiller index, showing continued weakness in the housing market.   The graph on page 1 charts the year over year percent change in housing prices for 20 cities in the U.S.  After rising above 0 in the early part of 2010, the index has now taken a dive below 0, indicating increased price pressures from foreclosures and a labor market that is still far from healthy.

Let’s step back and look at another data series, an index of housing prices from the Federal Housing Finance Agency, which compiles data from Fannie Mae and Freddie Mac purchases and refinances.  The large volume of mortgages guaranteed by these two quasi-governmental agencies provides an annual data set of more than a million mortgages, 60 times larger than the Case-Shiller data set that usually makes headlines.

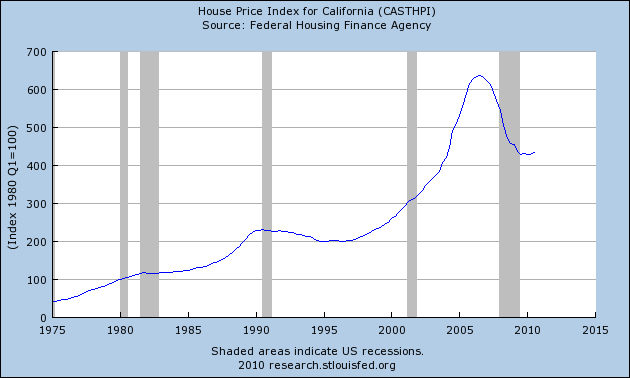
Courtesy of the FRED database at the Federal Reserve in St. Louis, we can see below a 35 year history of housing prices in California (Source)  From this multi-decade viewpoint, we can see the real estate spike that occurred during the past decade. (Click to enlarge in a separate tab)

Spotting trends in stock prices or housing prices is more art than science.  Below I’ve drawn my guesstimation of the 40 year and 20 year trend lines in the California housing index.

As a comparison, let’s look at a more even tempered state, Colorado.(Source)  Here we can see a more sustainable growth pattern in prices. Again, I’ve drawn a trendline in red to show a guesstimation of the long term trend.

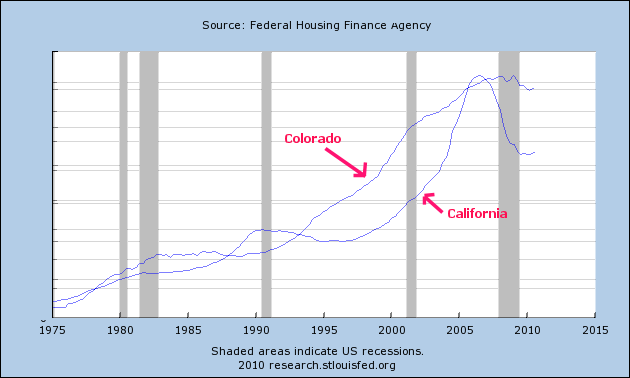
A comparison graph of the two states reveals just how strongly the California index shot up during the past decade.  The scales are different for each state but reveal interesting historical patterns and a caution to California homeowners. 

Colorado experienced little growth in housing prices during the 80s.  For Californians, their slow growth period was from the late 80s to the late nineties. During the late nineties and early part of the 2000s, the growth pattern was similar to Colorado.  After the recession of 2002-3, California housing prices exploded upward while Colorado prices maintained the same growth pattern.  During the past two years and over the next several years, California prices will continue a painful return to the long term trend.  Colorado homeowners will see the same flatlining of prices that they experienced during the 80s but that is far better than the rollercoaster ride that California homeowners are currently on.

Tax Myths

Like many people I believed in several tax myths.  Twenty years ago, my accountant helped me better understand some of the things I took for granted as true.  I had started a contracting business a few years before.

Myth: Tax rate. I believed that, because I was in a 28% tax bracket, I paid 28% of my income in taxes. 
“Too many people confuse their marginal tax rate, which is 28% in your case, with their effective tax rate,” my accountant said.  We were reviewing my corporate and personal income tax returns.  She pointed me to the Taxable Income line on my personal tax return. 
“That’s your taxable income,” she said.  Then she pointed me to the Tax line that followed.  “That’s your tax.  What is the percentage of the tax to your taxable income?” she asked. 
“About 16%,” I replied. 
“That’s your effective tax rate,” she said.

She continued, “I have other contractor clients who want to buy a new truck.  They reason that, because they can deduct the purchase from their taxable income and they are in a similar tax bracket as you, the government is effectively paying for 30% of the cost of the truck.  It sounds like a great deal to them and justifies the cost of a new truck.  I ask them whether the first dollar they make or the last dollar they make will go to the new truck payment.  This sounds puzzling at first. If the first dollar they make goes to the truck payment and that first dollar is taxed at only 10%, then the government is only picking up 10% of the cost for the new truck.  Is the extra cost of a new truck justified if the government only picks up 10%?  Do you see what my point is?  You can’t say that you buy groceries and other necessities with the first dollar you make and then say you’ll  buy the truck with the last dollar you make.”  I nodded.

“The decision whether to buy a new truck,” she said, “should be based on a number of factors: additional work capability, reliability, less down time, savings from truck repairs, to name a few.  Any tax savings is just one of those factors.  It shouldn’t be the prime factor.  Unless you pay cash for the truck, you’ll have interest charges that will add about 15% to the purchase price.  At your effective tax rate, the government is simply picking up the interest you would pay on a truck loan.”

Myth:  Capital Gains Tax. In the middle nineties, I wanted to sell some part of a mutual fund and put the money in a different mutual fund to diversify a little bit. I was a reasonably new and unsophisticated investor who had read that diversification was good.  I had held off selling any shares in the fund for about a year because I didn’t want to pay the capital gains tax on the sale.  Once again, my accountant gave me another tax lesson. 
“Many people don’t realize that when they sell a mutual fund, they often pay little in capital gains tax or they may report a loss.  For many funds, you have been paying the tax each year on any capital gains the fund has realized.” 
That surprised me. She pointed me to a form in my tax return (Schedule D).
“Here’s the capital gains your fund had this year,” she said.  That increased your taxable income and you paid tax on it.  For many people, tax considerations should not be the prime reason they buy or sell a mutual fund, especially a stock fund.  There are some bond funds and other less common investments which are not taxable and that’s a different story.”

Myth:  Tax deferred accounts. In the mid nineties, I considered whether my company should set up a 401K retirement plan but the administrative costs and restrictions were impractical for a company my size.
“For employees  the tax deferral feature and any matching employer contribution to a 401K plan are a big plus.  For small companies with just a few employees, you lose the benefit of the employer contribution because you are the employer.” 
“But what about the tax advantages?” I asked. 
“Unlike many employees whose work hours are more or less fixed,” she replied, “you can offset the tax advantage of a 401K by working a few extra hours a week.  In effect you are paying the taxes now so that you won’t have to pay them in the future.  30 years from now you won’t remember the extra hours you worked.  You will have more control of your retirement funds.  Who knows what Congress will decide to do with IRAs and 401Ks 30 years from now?” 
“But,” I asked, “I’ll be in a lower tax bracket when I’m retired and I’ll pay less taxes on the money I take out of my IRA or 401K.”
“That’s true.  But there is the matter of how a tax rate feels.  When you are 75 years old and are on a fixed income, believe me, a 10% income tax rate feels like 20% or 30%.  At a 10% tax rate, you have to take over $1100 out of your IRA or 401K to net $1000 to meet your expenses.  At that age, you are very conscious of your dwindling savings.  In your 30s, 40s and 50s, you can command more money for your labor than you can in your 60s, 70s and 80s.   You can work a little extra now in order to buy peace of mind later and hopefully avoid having to get a part time job in your 70s to make ends meet.”

Pensions

The Adam Smith Institute Blog at the Christian Science Monitor carried a financial story about pensions in Hungary that had several misconceptions.  The Christian Science Monitor, while noted for its reporting in other areas, is not a financial publication.  The Washington Examiner then linked to this blog and it went around the internet as a case of “European countries taking private pensions”.  If this were the case, I knew I would find the story as a prominent feature in the Financial Times, the leading source of financial news in Europe, or in the Wall St. Journal, the leading source of financial news on this side of the Atlantic.  If this were true, then this is pretty big news to the bond market. 

At a Wall St. Journal blog, a reporter gave a more complete description of the transition which Hungary is planning.  Here is an excerpt. Emphasis added by me.

Hungarians will have until Jan. 31, 2011, to decide whether they opt to return fully to the state’s pay-as-you-go pension regime. Only the private pension fund members who wish to remain in their respective pension funds will need to express their wish. Those who don’t do that will automatically return to the state scheme.

“They have two options: they either stay or decide to return, [and] both decisions have their consequences,” [Economy Minister Gyorgy] Matolcsy said at a press conference in parliament after a government meeting.

The assets of those who decide to return to the state scheme will be kept in individual accounts and will remain inheritable by the spouse, Mr. Matolcsy said.

Hungary has a hybrid social security scheme similar to what George Bush proposed about 6 years ago.  Designed to encourage people to save for retirement, some of each person’s social security taxes could be invested in private pension funds.  The private pension fund is supposed to generate a return that will provide 30% of a retirees pension payment (Social Security check, in the U.S.) and Hungary supplies 70% of the pension payment.  Here’s the kernel of this story:  Hungary had promised to make up or “top off” a retiree’s pension, i.e. pay more than 70%, if the retirees private plan had not made the returns necessary to supply 30% of the full scheduled monthly pension payment the retiree was due.  Hungary can no longer promise to “top up” pension payments above the 70%.  What happened? 

Hungary has a large debt load.  It can borrow private pension money that a retiree chooses to turn over to the state at a net effective rate that is less than the bond market charges for Hungary’s debt.  The U.S. government borrows Social Security money at about 3 – 4%, a rate less than what the bond market usually (except for the past few years) charges the U.S. for its medium to long term debt.

Secondly, people close to or in retirement in Hungary took on more risk than they should have.  Many private pension funds lost value during the past two years and could not meet the 30% portion of the scheduled pension payment.  In a difficult economic environment, Hungary found itself “topping up” more and more private pensions. 

According to the Financial Times, France and Ireland are shifting state pension assets away from stocks and into government debt and cash.  Estonia, a prudently managed nation with no debt, has even considered reducing state contributions to private pension plans.

The question for developed countries with hybrid pension, or Social Security, schemes is how to design a system that encourages people to save for retirement but encourages prudent financial management.  If I were a Hungarian citizen and my government said they would make up any shortfall in the returns of my private pension funds, I would have rolled the dice and invested in riskier stocks that would hopefully generate big returns for me.  How could I lose when the government has promised they would make up the difference?  Then, whoops, the financial crisis hit and Hungary found that their hybrid pension system had inadvertently rewarded risky behavior. 

If I were a Hungarian citizen nearing or in retirement, I would be angry, of course.  The government had promised me that I could have my cake and eat it too and I like fairy tales and vote for the politicians who tell those tall tales.

More Sunlight

Every December it seems as though the sun will continue drifting south, never to return to the northern hemisphere.  Then in early January, the sun that used to come up over the neighbor’s chimney for the past week or so is now coming up just a tiny bit north of that chimney.  An economy can act like the winter’s sun, moping about in the doldrums until a few signs appear that things are going to get better.

In the past few months, initial claims for unemployment have fallen slowly but steadily, approaching that magic mark of 400,000, which economists regard as a milepost on the way to a healthy economy.  Another gauge of recovery are tax receipts.

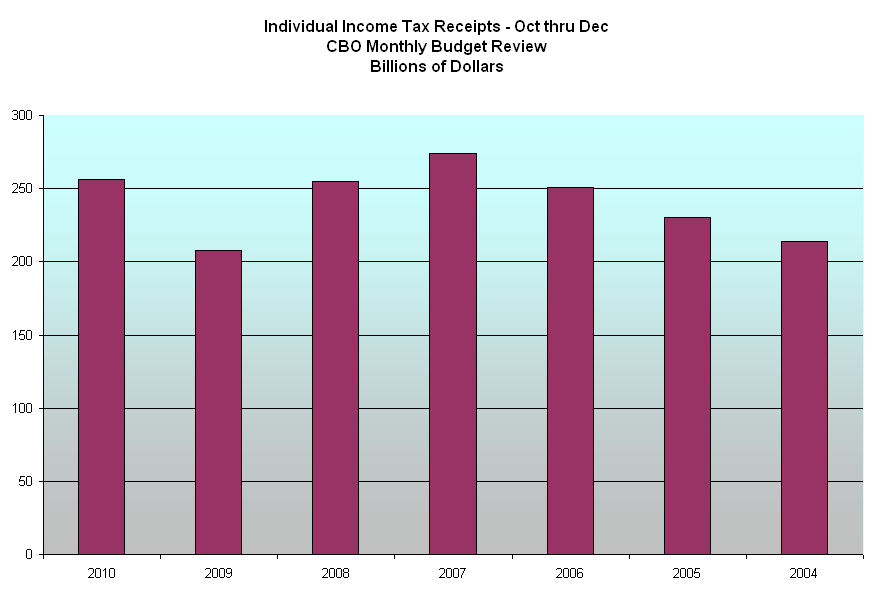
Every month the Congressional Budget Office (CBO) publishes a review of the country’s finances.  In January’s review  the CBO notes that withholding taxes and other income taxes have increased over 20% in the last calendar quarter of 2010 (1st quarter of the U.S. Treasury’s fiscal year 2011 which started in October 2010).  Withholding and social security taxes make up about 80% of overall receipts to the treasury.  Below is a comparison of this past October – December with the same quarter of earlier years.

We can judge the health of local and state economies by the amount of sales tax collected.  The increased amount of witholding taxes in the past quarter is a barometer of a recovering economy.