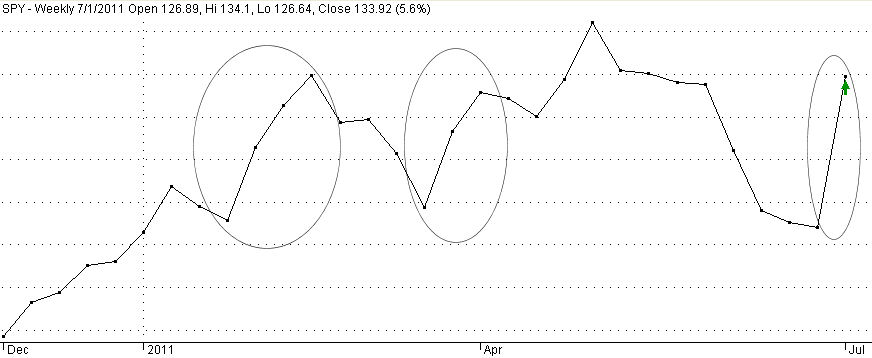
In late January, it took 3 weeks of trading for the S&P index to rise up 5% from a brief drop at 1270 to its mid-February peak of 1340. (Shown above and below is a chart of an ETF, SPY, that tracks the index – ETF prices are 1/10th of the index) After the Japan tsunami, the index once again touched that 1270 low before rising up again to that 1340 level. That upward move again took 3 weeks. This past week the index again rose from the 1270 low to the same 1340 level in ONE week.
A 5% upward move in a broad index in one week is dramatic. When did we last see such a dramatic move? In early July of last year, the index rose about the same amount.
Since 2000, the history of these abrupt upward moves reveals that they come in two varieties: the first is an underlying argument about the long term health of our economy and corporate profits; the second are crises. (Click to show larger graph in a separate tab)

There were several closely clustered sharp upward moves in the spring of 2000 as the long bull market of the 1990s was coming to a close. After 9/11 the market rose sharply in a week after crashing the week before. In the last half of 2002 there were two such abrupt moves as early hopes that the country could pull out of recession were dashed in the first two moves. The final move up in late March 2003 marked the beginning of the 5 year bull market of the 2000s. Not until February 2008 did we see another weekly surge, shortly after the recession began in December 2007. The next event occurred in October 2008 during the ongoing financial crisis when there was a sudden rise in prices following a breathtaking 20% decline the previous week as equity holders ran for cover after the financial crisis exploded. For the next several months in late 2008 and early 2009, we had five steep upward price moves as buyers and sellers scrambled for safety or bargains. Three more spikes occurred in March, April and July of that year as the country pulled its way up from the depths of the financial mudpit.
After the July 4th holiday in 2010, the market rose steeply, canceling out the abrupt drop of the week before. This past week, 51 weeks after the spike of 2010, the index spiked again, canceling out not a week’s worth of decline but a month of gradual decline.
Does this past week’s surge mark the beginning of a third leg up in the 2 year old bull market or a fakeout “relief rally” by buyers hopeful that the economy’s growth is not faltering? Why have 3 of these price surges happened around the July 4th holiday?
The end of June marks the end of the 2nd quarter. Many traders have taken an early holiday. The market is left to retail investors, you and me, and fund managers adjusting their holdings before the end of the quarter, when they publish their holdings. After eight weeks of steadily declining prices, retail investors may overreact to a few pieces of good news. The delay of Greece’s default – it is only a delay – was the first piece of good news. The Chicago Purchasing Manager’s Index and the monthly ISM manufacturing report, while not boffo, were encouraging to those hoping that the recent signs of a manufacturing slump were temporary. This coming Wednesday’s ADP Employment report will give a sneak preview of the Labor Dept’s monthly Employment Report next Friday. Also on Wednesday, the ISM Non-Manufacturing survey will take the pulse of the service sector of the economy. If there are some positive surprises this week, then this could be the start of the third leg up in stock prices. If there are negative surprises, watch out below…
